Uncategorized
The 11 Retailers Most At Risk Of Bankruptcy In The Next 12 Months
The 11 Retailers Most At Risk Of Bankruptcy In The Next 12 Months
By Cara Salpini of RetailDive
The first nine months of 2023 have seen big-name…
Share this:


By Cara Salpini of RetailDive
The first nine months of 2023 have seen big-name retailers including David’s Bridal, Bed Bath & Beyond and Party City file for bankruptcy. And more could be on the way.
Moody’s Investors Service in July said defaults in retail and apparel would continue to rise, jumping from 6% to 8.6% in the following 12 months as weakening consumer spending and high product, labor and freight costs weigh on businesses. And in a Sept. 20 report, S&P Global Ratings warned that the risk of a U.S. recession in the next 12 months, while lower than the start of the year, was still elevated.
“A lot of retail is consumer discretionary so in the event of an economic pullback, or economic uncertainty, you’ll see some of that revenue come down because it’s more of a discretionary purchase,” Elizabeth Han, a senior director on Fitch Ratings’ U.S. leveraged finance team, said in an interview.
Han noted supply chain and inventory challenges, as well as inflation and other macroeconomic concerns have affected retailers as well. Fitch has witnessed more distressed debt exchanges from retailers recently, and Han cited high interest rates as another challenge for companies loaded down with debt.
“There was really no expectation that the velocity of interest rate hikes would be this fast in such a short timeframe. I think there was some sense of, ‘if the Fed is going to raise rates, it won’t even be until next year,’ and then here we are,” Han said. “So I think some companies, they’ve just kind of caught a little bit off guard.”
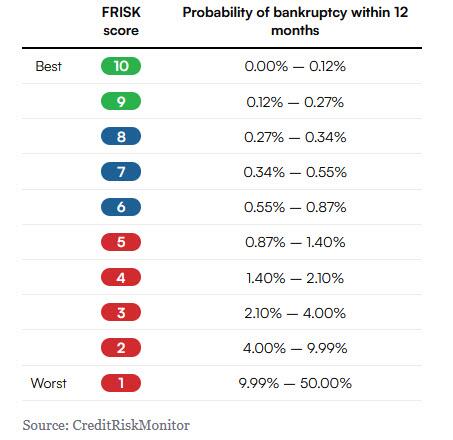
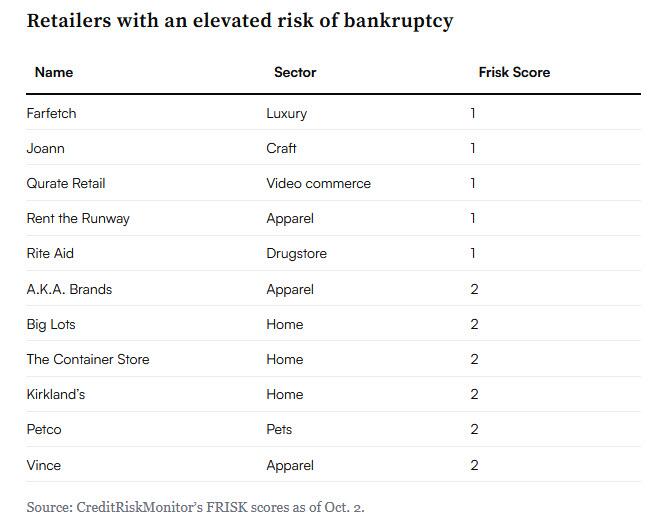
Fitch’s own list of vulnerable retailers includes players like 99 Cents, At Home, Belk, Rugs USA and Joann. CreditRiskMonitor, which labels companies with a FRISK score to measure the probability of them filing for bankruptcy within 12 months, listed 11 noteworthy retailers and brands with either a 4% to 10% chance of filing for bankruptcy or a 10% to 50% chance.
The story of who files and who doesn’t often comes down to debt, according to David Silverman, senior director of Fitch Ratings’ U.S. retail team.
“Abercrombie & Fitch and J. Crew actually had very similar operating stories,” Silverman said. “These are mid-tier, mall-based department store brands that had lost their way a little bit. One ended up undertaking a number of distressed debt exchanges and ultimately filed bankruptcy at the beginning of the pandemic. The other one didn’t really and still doesn’t really have any debt.”
The other difference? “One of them went through an LBO and one of them didn’t,” Silverman said.
The majority of high-profile retail bankruptcies in the past few years have featured a leveraged buyout, Silverman noted, including Neiman Marcus, J. Crew and Toys R Us. And several retailers at risk according to CreditRiskMonitor, or by Fitch’s measure, are either currently owned by private equity or had previous private equity ownership.
Some occupy sectors that seemed to thrive during the pandemic, like home, pets or crafting. Trends that buoyed those sectors are showing signs of reversing, and the boost the pandemic gave some of those businesses may have been simply a “positive interruption” to an otherwise negative trajectory, according to Silverman.
“Some companies that saw this period as a little bit more temporal took the opportunity to say, ‘Look, we’re over-earning, let’s take some cash flow and pay down debt. Let’s clean up the balance sheet,’” Silverman said. “Unfortunately, there were a number of consumer and retail companies that felt like, ‘The strength that we are seeing today is going to continue’ … and they actually made decisions that turned out to be, frankly, regrettable.”
Here’s a closer look at a few of the companies with a higher risk of bankruptcy in the next 12 months, and how they got here.
Joann
It’s been a series of ups and downs for Joann since the pandemic hit in 2020. The craft retailer was downgraded by S&P Global toward the beginning of that year in a slew of credit downgrades that swept across the industry as the financial challenges of the pandemic became clear.
For most of the retail industry, the pandemic meant temporary store closures that lasted for months and deeply slashed revenue. Joann was no different, and it suffered along with the rest of retail from the initial impact of closures. But later on in 2020 and into early 2021, Joann benefited from a consumer base that was mostly stuck at home — and interested in crafting.
The strong market led Joann to file for an IPO in February 2021, though private equity firm Leonard Green & Partners maintained majority ownership of the company after. But later in 2021, Joann was already showing signs that it couldn’t hold onto the gains it made during the pandemic. The retailer’s sales fell nearly 30% in Q2 that year as it lapped “unprecedented sales growth” from the year prior and struggled against supply chain challenges and new COVID variants.
This year, the craft retailer has been working to cut costs across its supply chain and product assortment. The retailer laid off an unspecified number of employees in September amid changes to its corporate structure, which included its vice president and controller (who was also its former interim CFO). Joann entered into a $100 million first-in, last-out facility in March to shore up liquidity, and at the end of July had long-term debt of $1.1 billion. CEO Wade Miquelon also retired in May, with no permanent replacement named yet.
The company has a FRISK Score of 1 with CreditRiskMonitor, which represents a 10% to 50% chance of bankruptcy in the next 12 months, and its market capitalization has declined by 89% over the last 12 months, according to the firm.
Rite Aid
Rumors have swirled as recently as the past few weeks that Rite Aid is preparing to file for bankruptcy. The drugstore retailer, which saw an upswing during the pandemic as shoppers sought out vaccines, COVID tests and masks, listed about $3.3 billion of long-term debt on its balance sheet in June.
The retailer has no permanent CEO yet following the departure of Heyward Donigan, who had been CEO since 2019, in January. And sales have been mostly on the decline. Revenue in the retailer’s first quarter in June this year fell 6%, after a meager 0.5% increase in Q4 and a 2.3% decline in Q3.
“Rite Aid starts its new fiscal year much as it ended its old one: as a company with a reasonable level of sales, but which is encumbered by a balance sheet and business model that does not work in its favor,” GlobalData Managing Director Neil Saunders said in emailed comments in June.
Saunders blamed Rite Aid’s “eyewatering level of debt” as a key challenge, saying the retailer’s liabilities exceed its assets by almost $1 billion, “which gives the company virtually no financial headroom, and no possibility of paying down what it owes.” Interest payments in Q1 alone were $65.2 million.
The company has a FRISK Score of 1 with CreditRiskMonitor, which represents a 10% to 50% chance of bankruptcy in the next 12 months, and its market capitalization has declined by 92% over the last 12 months, according to the firm.
Big Lots
2023 has been a hard year for Big Lots, which saw sales fall by double digits in each of the past two quarters. In May, with sales down 18% year over year, the retailer said it was being tactical about preserving liquidity and had identified $100 million in SG&A savings.
Big Lots has shuttered four distribution centers this year and turned to store leasebacks to reduce costs. And in August, as sales fell 15%, the retailer announced further cost-cutting initiatives. CEO Bruce Thorn said at the time that inflation was hitting its lower-income consumer particularly hard.
The retailer’s financial struggles extend beyond this year, though.
“Their revenue, profit before tax, retained profit, total assets and net worth have all declined for the last two years,” Matthew Debbage, CEO of the Americas and Asia at Creditsafe, said in an email. “But their liabilities have increased for two years. This isn’t a good combination.”
The company has a FRISK Score of 2 with CreditRiskMonitor, which represents a 4% to 10% chance of bankruptcy in the next 12 months, and its market capitalization has declined by 71% over the last 12 months, according to the firm.
The Container Store
Like Joann, despite the initial pain of the pandemic — The Container Store’s sales fell nearly 28% in the first quarter of 2020 — the surge of consumers staying home for prolonged periods of time proved to be a boon to the retailer’s sales (albeit a temporary one).
By the third quarter that year, which ended the day after Christmas in 2020, The Container Store was posting 20.5% growth, which spiked to 30.4% growth in Q4. But gone are the days of shoppers spending most of their days at home, remodeling and organizing their spaces. Net sales in the first quarter this year were down 21%, which CEO Satish Malhotra attributed to the “challenging macro environment.”
The company announced layoffs in May, and while it didn’t specify the number of employees impacted, The Container Store said it eliminated some open roles and reduced around 15% of workers at its support center and less than 3% at the company’s store and distribution center operations. In September, Malhotra agreed to take a temporary pay cut of 10% on his base salary to help pay for employee raises.
The company has a FRISK Score of 2 with CreditRiskMonitor, which represents a 4% to 10% chance of bankruptcy in the next 12 months, and its market capitalization has declined by 56% over the last 12 months, according to the firm.
Petco
Petco operates in another space that saw an increase during the pandemic, as consumers adopted new pets or treated their existing ones. Deemed essential, pet retailers mostly stayed open during the pandemic, and some saw spikes in sales and traffic as a result.
Petco saw its annual sales jump 11% in 2020 and 18% in 2021 before slowing down to 4% growth last year. The retailer in August saw second-quarter sales rise 3.4%, but it swung to a loss in the quarter. A large problem for Petco, like others on this list, is its debt.
Silverman said Petco is one of a group of retailers on this list that was “highly levered to begin with.”
“Already the expectations or the need to perform for these companies is higher than a company that I think doesn’t have an onerous capital structure to contend with,” Silverman said.
Petco has paid down $75 million in principal on its term loan so far this year, according to its Q2 release. Petco CFO Brian LaRose said at that time that the company is “focused on debt paydown and cash flow, both of which will be supported by our productivity initiatives in addition to tightly controlled expense management.”
The company has a FRISK Score of 2 with CreditRiskMonitor, which represents a 4% to 10% chance of bankruptcy in the next 12 months, and its market capitalization has declined by 65% over the last 12 months, according to the firm.
Uncategorized
February Employment Situation
By Paul Gomme and Peter Rupert The establishment data from the BLS showed a 275,000 increase in payroll employment for February, outpacing the 230,000…
Share this:


By Paul Gomme and Peter Rupert
The establishment data from the BLS showed a 275,000 increase in payroll employment for February, outpacing the 230,000 average over the previous 12 months. The payroll data for January and December were revised down by a total of 167,000. The private sector added 223,000 new jobs, the largest gain since May of last year.

Temporary help services employment continues a steep decline after a sharp post-pandemic rise.


Average hours of work increased from 34.2 to 34.3. The increase, along with the 223,000 private employment increase led to a hefty increase in total hours of 5.6% at an annualized rate, also the largest increase since May of last year.

The establishment report, once again, beat “expectations;” the WSJ survey of economists was 198,000. Other than the downward revisions, mentioned above, another bit of negative news was a smallish increase in wage growth, from $34.52 to $34.57.

The household survey shows that the labor force increased 150,000, a drop in employment of 184,000 and an increase in the number of unemployed persons of 334,000. The labor force participation rate held steady at 62.5, the employment to population ratio decreased from 60.2 to 60.1 and the unemployment rate increased from 3.66 to 3.86. Remember that the unemployment rate is the number of unemployed relative to the labor force (the number employed plus the number unemployed). Consequently, the unemployment rate can go up if the number of unemployed rises holding fixed the labor force, or if the labor force shrinks holding the number unemployed unchanged. An increase in the unemployment rate is not necessarily a bad thing: it may reflect a strong labor market drawing “marginally attached” individuals from outside the labor force. Indeed, there was a 96,000 decline in those workers.


Earlier in the week, the BLS announced JOLTS (Job Openings and Labor Turnover Survey) data for January. There isn’t much to report here as the job openings changed little at 8.9 million, the number of hires and total separations were little changed at 5.7 million and 5.3 million, respectively.

As has been the case for the last couple of years, the number of job openings remains higher than the number of unemployed persons.

Also earlier in the week the BLS announced that productivity increased 3.2% in the 4th quarter with output rising 3.5% and hours of work rising 0.3%.

The bottom line is that the labor market continues its surprisingly (to some) strong performance, once again proving stronger than many had expected. This strength makes it difficult to justify any interest rate cuts soon, particularly given the recent inflation spike.
unemployment pandemic unemploymentUncategorized
Mortgage rates fall as labor market normalizes
Jobless claims show an expanding economy. We will only be in a recession once jobless claims exceed 323,000 on a four-week moving average.
Share this:


Everyone was waiting to see if this week’s jobs report would send mortgage rates higher, which is what happened last month. Instead, the 10-year yield had a muted response after the headline number beat estimates, but we have negative job revisions from previous months. The Federal Reserve’s fear of wage growth spiraling out of control hasn’t materialized for over two years now and the unemployment rate ticked up to 3.9%. For now, we can say the labor market isn’t tight anymore, but it’s also not breaking.
The key labor data line in this expansion is the weekly jobless claims report. Jobless claims show an expanding economy that has not lost jobs yet. We will only be in a recession once jobless claims exceed 323,000 on a four-week moving average.
From the Fed: In the week ended March 2, initial claims for unemployment insurance benefits were flat, at 217,000. The four-week moving average declined slightly by 750, to 212,250
Below is an explanation of how we got here with the labor market, which all started during COVID-19.
1. I wrote the COVID-19 recovery model on April 7, 2020, and retired it on Dec. 9, 2020. By that time, the upfront recovery phase was done, and I needed to model out when we would get the jobs lost back.
2. Early in the labor market recovery, when we saw weaker job reports, I doubled and tripled down on my assertion that job openings would get to 10 million in this recovery. Job openings rose as high as to 12 million and are currently over 9 million. Even with the massive miss on a job report in May 2021, I didn’t waver.
Currently, the jobs openings, quit percentage and hires data are below pre-COVID-19 levels, which means the labor market isn’t as tight as it once was, and this is why the employment cost index has been slowing data to move along the quits percentage.

3. I wrote that we should get back all the jobs lost to COVID-19 by September of 2022. At the time this would be a speedy labor market recovery, and it happened on schedule, too
Total employment data
4. This is the key one for right now: If COVID-19 hadn’t happened, we would have between 157 million and 159 million jobs today, which would have been in line with the job growth rate in February 2020. Today, we are at 157,808,000. This is important because job growth should be cooling down now. We are more in line with where the labor market should be when averaging 140K-165K monthly. So for now, the fact that we aren’t trending between 140K-165K means we still have a bit more recovery kick left before we get down to those levels.

From BLS: Total nonfarm payroll employment rose by 275,000 in February, and the unemployment rate increased to 3.9 percent, the U.S. Bureau of Labor Statistics reported today. Job gains occurred in health care, in government, in food services and drinking places, in social assistance, and in transportation and warehousing.
Here are the jobs that were created and lost in the previous month:

In this jobs report, the unemployment rate for education levels looks like this:
- Less than a high school diploma: 6.1%
- High school graduate and no college: 4.2%
- Some college or associate degree: 3.1%
- Bachelor’s degree or higher: 2.2%

Today’s report has continued the trend of the labor data beating my expectations, only because I am looking for the jobs data to slow down to a level of 140K-165K, which hasn’t happened yet. I wouldn’t categorize the labor market as being tight anymore because of the quits ratio and the hires data in the job openings report. This also shows itself in the employment cost index as well. These are key data lines for the Fed and the reason we are going to see three rate cuts this year.
recession unemployment covid-19 fed federal reserve mortgage rates recession recovery unemploymentUncategorized
Inside The Most Ridiculous Jobs Report In History: Record 1.2 Million Immigrant Jobs Added In One Month
Inside The Most Ridiculous Jobs Report In History: Record 1.2 Million Immigrant Jobs Added In One Month
Last month we though that the January…
Share this:


Last month we though that the January jobs report was the "most ridiculous in recent history" but, boy, were we wrong because this morning the Biden department of goalseeked propaganda (aka BLS) published the February jobs report, and holy crap was that something else. Even Goebbels would blush.
What happened? Let's take a closer look.
On the surface, it was (almost) another blockbuster jobs report, certainly one which nobody expected, or rather just one bank out of 76 expected. Starting at the top, the BLS reported that in February the US unexpectedly added 275K jobs, with just one research analyst (from Dai-Ichi Research) expecting a higher number.
Some context: after last month's record 4-sigma beat, today's print was "only" 3 sigma higher than estimates. Needless to say, two multiple sigma beats in a row used to only happen in the USSR... and now in the US, apparently.

Before we go any further, a quick note on what last month we said was "the most ridiculous jobs report in recent history": it appears the BLS read our comments and decided to stop beclowing itself. It did that by slashing last month's ridiculous print by over a third, and revising what was originally reported as a massive 353K beat to just 229K, a 124K revision, which was the biggest one-month negative revision in two years!

Of course, that does not mean that this month's jobs print won't be revised lower: it will be, and not just that month but every other month until the November election because that's the only tool left in the Biden admin's box: pretend the economic and jobs are strong, then revise them sharply lower the next month, something we pointed out first last summer and which has not failed to disappoint once.
In the past month the Biden department of goalseeking stuff higher before revising it lower, has revised the following data sharply lower:
— zerohedge (@zerohedge) August 30, 2023
- Jobs
- JOLTS
- New Home sales
- Housing Starts and Permits
- Industrial Production
- PCE and core PCE
To be fair, not every aspect of the jobs report was stellar (after all, the BLS had to give it some vague credibility). Take the unemployment rate, after flatlining between 3.4% and 3.8% for two years - and thus denying expectations from Sahm's Rule that a recession may have already started - in February the unemployment rate unexpectedly jumped to 3.9%, the highest since February 2022 (with Black unemployment spiking by 0.3% to 5.6%, an indicator which the Biden admin will quickly slam as widespread economic racism or something).

And then there were average hourly earnings, which after surging 0.6% MoM in January (since revised to 0.5%) and spooking markets that wage growth is so hot, the Fed will have no choice but to delay cuts, in February the number tumbled to just 0.1%, the lowest in two years...

... for one simple reason: last month's average wage surge had nothing to do with actual wages, and everything to do with the BLS estimate of hours worked (which is the denominator in the average wage calculation) which last month tumbled to just 34.1 (we were led to believe) the lowest since the covid pandemic...

... but has since been revised higher while the February print rose even more, to 34.3, hence why the latest average wage data was once again a product not of wages going up, but of how long Americans worked in any weekly period, in this case higher from 34.1 to 34.3, an increase which has a major impact on the average calculation.

While the above data points were examples of some latent weakness in the latest report, perhaps meant to give it a sheen of veracity, it was everything else in the report that was a problem starting with the BLS's latest choice of seasonal adjustments (after last month's wholesale revision), which have gone from merely laughable to full clownshow, as the following comparison between the monthly change in BLS and ADP payrolls shows. The trend is clear: the Biden admin numbers are now clearly rising even as the impartial ADP (which directly logs employment numbers at the company level and is far more accurate), shows an accelerating slowdown.

But it's more than just the Biden admin hanging its "success" on seasonal adjustments: when one digs deeper inside the jobs report, all sorts of ugly things emerge... such as the growing unprecedented divergence between the Establishment (payrolls) survey and much more accurate Household (actual employment) survey. To wit, while in January the BLS claims 275K payrolls were added, the Household survey found that the number of actually employed workers dropped for the third straight month (and 4 in the past 5), this time by 184K (from 161.152K to 160.968K).

This means that while the Payrolls series hits new all time highs every month since December 2020 (when according to the BLS the US had its last month of payrolls losses), the level of Employment has not budged in the past year. Worse, as shown in the chart below, such a gaping divergence has opened between the two series in the past 4 years, that the number of Employed workers would need to soar by 9 million (!) to catch up to what Payrolls claims is the employment situation.

There's more: shifting from a quantitative to a qualitative assessment, reveals just how ugly the composition of "new jobs" has been. Consider this: the BLS reports that in February 2024, the US had 132.9 million full-time jobs and 27.9 million part-time jobs. Well, that's great... until you look back one year and find that in February 2023 the US had 133.2 million full-time jobs, or more than it does one year later! And yes, all the job growth since then has been in part-time jobs, which have increased by 921K since February 2023 (from 27.020 million to 27.941 million).

Here is a summary of the labor composition in the past year: all the new jobs have been part-time jobs!

But wait there's even more, because now that the primary season is over and we enter the heart of election season and political talking points will be thrown around left and right, especially in the context of the immigration crisis created intentionally by the Biden administration which is hoping to import millions of new Democratic voters (maybe the US can hold the presidential election in Honduras or Guatemala, after all it is their citizens that will be illegally casting the key votes in November), what we find is that in February, the number of native-born workers tumbled again, sliding by a massive 560K to just 129.807 million. Add to this the December data, and we get a near-record 2.4 million plunge in native-born workers in just the past 3 months (only the covid crash was worse)!

The offset? A record 1.2 million foreign-born (read immigrants, both legal and illegal but mostly illegal) workers added in February!

Said otherwise, not only has all job creation in the past 6 years has been exclusively for foreign-born workers...

... but there has been zero job-creation for native born workers since June 2018!

This is a huge issue - especially at a time of an illegal alien flood at the southwest border...

... and is about to become a huge political scandal, because once the inevitable recession finally hits, there will be millions of furious unemployed Americans demanding a more accurate explanation for what happened - i.e., the illegal immigration floodgates that were opened by the Biden admin.
Which is also why Biden's handlers will do everything in their power to insure there is no official recession before November... and why after the election is over, all economic hell will finally break loose. Until then, however, expect the jobs numbers to get even more ridiculous.


Wendy’s has a new deal for daylight savings time haters


Mortgage rates fall as labor market normalizes


Shipping company files surprise Chapter 7 bankruptcy, liquidation


Economic Earthquake Ahead? The Cracks Are Spreading Fast


February Employment Situation
Wendy’s teases new $3 offer for upcoming holiday


Inside The Most Ridiculous Jobs Report In Recent History: Record 1.2 Million Immigrant Jobs Added In One Month
Inside The Most Ridiculous Jobs Report In History: Record 1.2 Million Immigrant Jobs Added In One Month
-

 Uncategorized2 weeks ago
All Of The Elements Are In Place For An Economic Crisis Of Staggering Proportions
-

 Uncategorized1 month ago
Cathie Wood sells a major tech stock (again)
-

 Uncategorized3 weeks ago
California Counties Could Be Forced To Pay $300 Million To Cover COVID-Era Program
-

 Uncategorized2 weeks ago
Apparel Retailer Express Moving Toward Bankruptcy
-

 Uncategorized3 weeks ago
Industrial Production Decreased 0.1% in January
-

 International2 days ago
Walmart launches clever answer to Target’s new membership program
-

 International2 days ago
EyePoint poaches medical chief from Apellis; Sandoz CFO, longtime BioNTech exec to retire
-

 Uncategorized3 weeks ago
RFK Jr: The Wuhan Cover-Up & The Rise Of The Biowarfare-Industrial Complex