Robotic cells market: Driven by the increasing industrial automation - Technavio
PR Newswire
NEW YORK, Feb. 1, 2023
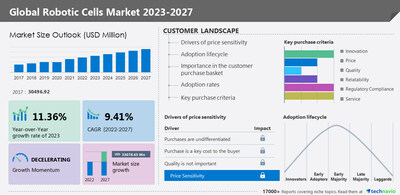
NEW YORK, Feb. 1, 2023 /PRNewswire/ -- The robotic cells market size is forecasted to grow by USD 33,078.65 million from 2022 to 2027. However, the growth momentum will decelerate at a CAGR of 9.41%, according to a recent market study by Technavio. The growth of the market will be driven by technological advances in the integration of robotic cells, the rising industrial automation, and the increasing penetration of pre-configured robotic cells. Charts & data tables about market and segment sizes for a historic period of five (2017-2021) years have been covered in this report. Download The Sample Report
Technavio has extensively analyzed 15 major vendors, including ABB Ltd., ABL Automazione Spa, Amtec Solutions Group Inc., Arcos Srl, Bystronic Laser AG, Carl Cloos Schweisstechnik GmbH, Desarrollo de Maquinas y Soluciones Automaticas SL, Evomatic AB, Hitachi Ltd., HUMARD Automation SA, IPG Photonics Corp., KC Robotics Inc., Maquinaria Electronica Esmerilado y Pulido SA, Mexx Engineering, Okuma Corp., Peak Analysis and Automation Ltd., PROMOT Automation GmbH, Remtech Systems, RITM Industry LLC, and Scott Technology Ltd.
To get detailed insights about the vendor landscape, buy the report
Key benefits for industry players and stakeholders –
The report offers information on the criticality of vendor inputs, including R&D, CAPEX, and technology.
It also provides detailed analyses of the market's competitive landscape and vendors' product offerings.
The report also provides a qualitative and quantitative analysis of vendors to help clients understand the wider business environment as well as the strengths and weaknesses of key market players. Data is qualitatively analyzed to categorize vendors as pure play, category-focused, industry-focused, and diversified; it is quantitatively analyzed to categorize vendors as dominant, leading, strong, tentative, and weak.
Customer Landscape - Analysis of price sensitivity, Adoption lifecycle, Customer purchase basket, Adoption rates, and Purchase criteria by Technavio
One of the core components of the customer landscape is price sensitivity, an analysis of which will help companies refine marketing strategies to gain a competitive advantage.
Another key aspect is price sensitivity drivers (purchases are undifferentiated, the purchase is a key cost to buyers, and quality is not important), which range between LOW and HIGH.
Furthermore, market adoption rates for all regions have been covered.
Get a holistic overview of the market from industry experts to evaluate and develop growth strategies. Download the Sample Report
The market is segmented by segment application (material handling, welding and soldering, assembly, and others), type (turnkey cells and custom cells), and geography (APAC, Europe, North America, South America, and Middle East and Africa).
Segmentation by material handling (Inclusion/Exclusion)
The market growth in the material handling segment will be significant during the forecast period. Material handling robots are used in various industries, such as automotive, electrical and electronics, industrial machinery, and food and beverage, to automate material handling applications. In the automotive industry, material handling robots are used for heavy payload handling applications, the transfer of heavy materials, and the placing of windscreens at sufficient heights, which allows the nearby human operator to inspect them thoroughly before fixation. Such factors will increase segment growth during the forecast period.
What are the key data covered in this Robotic Cells Market report?
CAGR of the market during the forecast period
Detailed information on factors that will drive the growth of the Robotic Cells Market between 2023 and 2027
Precise estimation of the size of the Robotic Cells Market size and its contribution to the market in focus on the parent market
Accurate predictions about upcoming trends and changes in consumer behavior
Growth of the Robotic Cells Market industry across APAC, Europe, North America, South America, and Middle East and Africa
A thorough analysis of the market's competitive landscape and detailed information about vendors
Comprehensive analysis of factors that will challenge the growth of Robotic Cells Market vendors
Related Reports:
The robotic lawn mower market size is expected to accelerate at a CAGR of 15.73% and reach USD 1,069.21 million by 2026. The increasing demand from the commercial segment is notably driving the robotic lawn mower market growth, although factors such as the availability of alternatives may impede the robotic lawn mower market growth.
The industrial robotics services market size is predicted to surge by USD 7,429.08 million from 2022 to 2027 at a CAGR of 6.9%. The surge in demand for industrial robots is notably driving the market growth, although factors such as the high cost of services may impede the market growth.
Robotic Cells Market Scope
Report Coverage
Details
Page number
170
Base year
2022
Historic period
2017-2021
Forecast period
2023-2027
Growth momentum & CAGR
Decelerate at a CAGR of 9.41%
Market growth 2023-2027
USD 33,078.65 million
Market structure
Fragmented
YoY growth 2022-2023 (%)
11.36
Regional analysis
APAC, Europe, North America, South America, and Middle East and Africa
Performing market contribution
APAC at 74%
Key countries
US, China, Japan, South Korea, and Germany
Competitive landscape
Leading Vendors, Market Positioning of Vendors, Competitive Strategies, and Industry Risks
Key companies profiled
ABB Ltd., ABL Automazione Spa, Amtec Solutions Group Inc., Arcos Srl, Bystronic Laser AG, Carl Cloos Schweisstechnik GmbH, Desarrollo de Maquinas y Soluciones Automaticas SL, Evomatic AB, Hitachi Ltd., HUMARD Automation SA, IPG Photonics Corp., KC Robotics Inc., Maquinaria Electronica Esmerilado y Pulido SA, Mexx Engineering, Okuma Corp., Peak Analysis and Automation Ltd., PROMOT Automation GmbH, Remtech Systems, RITM Industry LLC, and Scott Technology Ltd.
Market dynamics
Parent market analysis, Market growth inducers and obstacles, Fast-growing and slow-growing segment analysis, COVID-19 impact and recovery analysis and future consumer dynamics, Market condition analysis for forecast period.
Customization purview
If our report has not included the data that you are looking for, you can reach out to our analysts and get segments customized.
Table of contents:
1 Executive Summary
1.1 Market overview
Exhibit 01: Executive Summary – Chart on Market Overview
Exhibit 02: Executive Summary – Data Table on Market Overview
Exhibit 03: Executive Summary – Chart on Global Market Characteristics
Exhibit 04: Executive Summary – Chart on Market by Geography
Exhibit 05: Executive Summary – Chart on Market Segmentation by Application
Exhibit 06: Executive Summary – Chart on Market Segmentation by Type
Exhibit 07: Executive Summary – Chart on Incremental Growth
Exhibit 08: Executive Summary – Data Table on Incremental Growth
Exhibit 09: Executive Summary – Chart on Vendor Market Positioning
2 Market Landscape
2.1 Market ecosystem
Exhibit 10: Parent market
Exhibit 11: Market Characteristics
3 Market Sizing
3.1 Market definition
Exhibit 12: Offerings of vendors included in the market definition
3.2 Market segment analysis
Exhibit 13: Market segments
3.3 Market size 2022
3.4 Market outlook: Forecast for 2022-2027
Exhibit 14: Chart on Global - Market size and forecast 2022-2027 ($ million)
Exhibit 15: Data Table on Global - Market size and forecast 2022-2027 ($ million)
Exhibit 16: Chart on Global Market: Year-over-year growth 2022-2027 (%)
Exhibit 17: Data Table on Global Market: Year-over-year growth 2022-2027 (%)
4 Historic Market Size
4.1 Global robotic cells market 2017 - 2021
Exhibit 18: Historic Market Size – Data Table on Global robotic cells market 2017 - 2021 ($ million)
Exhibit 164: Scott Technology Ltd. - Business segments
Exhibit 165: Scott Technology Ltd. - Key offerings
Exhibit 166: Scott Technology Ltd. - Segment focus
13 Appendix
13.1 Scope of the report
13.2 Inclusions and exclusions checklist
Exhibit 167: Inclusions checklist
Exhibit 168: Exclusions checklist
13.3 Currency conversion rates for US$
Exhibit 169: Currency conversion rates for US$
13.4 Research methodology
Exhibit 170: Research methodology
Exhibit 171: Validation techniques employed for market sizing
Exhibit 172: Information sources
13.5 List of abbreviations
Exhibit 173: List of abbreviations
About Us
Technavio is a leading global technology research and advisory company. Their research and analysis focus on emerging market trends and provide actionable insights to help businesses identify market opportunities and develop effective strategies to optimize their market positions. With over 500 specialized analysts, Technavio's report library consists of more than 17,000 reports and counting, covering 800 technologies, spanning 50 countries. Their client base consists of enterprises of all sizes, including more than 100 Fortune 500 companies. This growing client base relies on Technavio's comprehensive coverage, extensive research, and actionable market insights to identify opportunities in existing and potential markets and assess their competitive positions within changing market scenarios.
Meet the Bitcoinetas, a fleet of transformative vehicles on a mission to spread the bitcoin message everywhere they go. From Argentina to South Africa,…
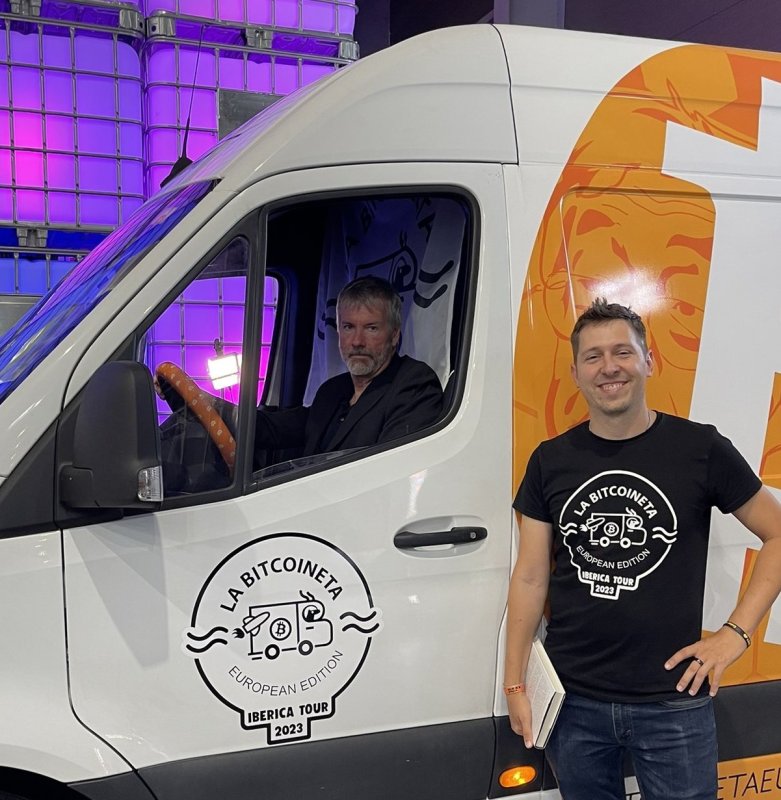
You may have seen that picture of Michael Saylor in a bitcoin-branded van, with a cheerful guy right next to the car door. This one:
Ariel Aguilar and La Bitcoineta European Edition at BTC Prague.
That car is the Bitcoineta European Edition, and the cheerful guy is Ariel Aguilar. Ariel is part of the European Bitcoineta team, and has previously driven another similar car in Argentina. In fact, there are currently five cars around the world that carry the name Bitcoineta (in some cases preceded with the Spanish definite article “La”).
Argentina: the original La Bitcoineta
The story of Bitcoinetas begins with the birth of 'La Bitcoineta' in Argentina, back in 2017. Inspired by the vibrancy of the South American Bitcoin community, the original Bitcoineta was conceived after an annual Latin American Conference (Labitconf), where the visionaries behind it recognized a unique opportunity to promote Bitcoin education in remote areas. Armed with a bright orange Bitcoin-themed exterior and a mission to bridge the gap in financial literacy, La Bitcoineta embarked on a journey to bring awareness of Bitcoin's potential benefits to villages and towns that often remained untouched by mainstream financial education initiatives. Operated by a team of dedicated volunteers, it was more than just a car; it was a symbol of hope and empowerment for those living on the fringes of financial inclusion.
The concept drawing for La Bitcoineta from December 2017.
Ariel was part of that initial Argentinian Bitcoineta team, and spent weeks on the road when the car became a reality. The original dream to bring bitcoin education even to remote areas within Argentina and other South American countries came true, and the La Bitcoineta team took part in dozens of local bitcoin meetups in the subsequent years.
The original La Bitcoineta from Argentina.
One major hiccup came in late 2018, when the car was crashed into while parked in Puerto Madryn. The car was pretty much destroyed, but since the team was possessed by a honey badger spirit, nothing could stop them from keeping true to their mission. It is a testament to the determination and resilience of the Argentinian team that the car was quickly restored and returned on its orange-pilling quest soon after.
Argentinian Bitcoineta after a major accident (no-one got hurt); the car was restored shortly after.
Over the more than 5 years that the Argentinian Bitcoineta has been running, it has traveled more than 80,000 kilometers - and as we’ll see further, it inspired multiple similar initiatives around the world.
In early 2021, the president of El Salvador passed the Bitcoin Law, making bitcoin legal tender in the country. The Labitconf team decided to celebrate this major step forward in bitcoin adoption by hosting the annual conference in San Salvador, the capital city of El Salvador. And correspondingly, the Argentinian Bitcoineta team made plans for a bold 7000-kilometer road trip to visit the Bitcoin country with the iconic Bitcoin car.
However, it proved to be impossible to cross so many borders separating Argentina and Salvador, since many governments were still imposing travel restrictions due to a Covid pandemic. So two weeks before the November event, the Labitconf team decided to fund a second Bitcoineta directly in El Salvador, as part of the Bitcoin Beach circular economy. Thus the second Bitcoineta was born.
Salvadoran’s Bitcoineta operates in the El Zonte region, where the Bitcoin Beach circular economy is located.
The eye-catching Volkswagen minibus has been donated to the Bitcoin Beach team, which uses the car for the needs of its circular economy based in El Zonte.
Late 2021 saw one other major development in terms of grassroots bitcoin adoption. On the other side of the planet, in South Africa, Hermann Vivier initiated the Bitcoin Ekasi project. “Ekasi” is a colloquial term for a township, and a township in the South African context is an underdeveloped urban area with a predominantly black population, a remnant of the segregationist apartheid regime. Bitcoin Ekasi emerged as an attempt to introduce bitcoin into the economy of the JCC Camp township located in Mossel Bay, and has gained a lot of success on that front.
Bitcoin Ekasi was in large part inspired by the success of the Bitcoin Beach circular economy back in El Salvador, and the respect was mutual. The Bitcoin Beach team thus decided to pass on the favor they received from the Argentinian Bitcoineta team, and provided funds to Bitcoin Ekasi for them to build a Bitcoineta of their own.
Bitcoin Ekasi’s Bitcoineta as seen at the Adopting Bitcoin Cape Town conference.Bitcoin Ekasi’s Bitcoineta as seen at the Adopting Bitcoin Cape Town conference. Hermann Vivier is seen in the background. South African Bitcoineta serves the needs of Bitcoin Ekasi, a local bitcoin circular economy in the JCC Camp township.
Bitcoin Ekasi emerged as a sister organization of Surfer Kids, a non-profit organization with a mission to empower marginalized youths through surfing. The Ekasi Bitcoineta thus partially serves as a means to get the kids to visit various surfer competitions in South Africa. A major highlight in this regard was when the kids got to meet Jordy Smith, one of the most successful South African surfers worldwide.
Coincidentally, South African surfers present an intriguing demographic for understanding Bitcoin due to their unique circumstances and needs. To make it as a professional surfer, the athletes need to attend competitions abroad; but since South Africa has tight currency controls in place, it is often a headache to send money abroad for travel and competition expenses. The borderless nature of Bitcoin offers a solution to these constraints, providing surfers with an alternative means of moving funds across borders without any obstacles.
Photo taken at the South African Junior Surfing Championships 2023. Back row, left to right:
Mbasa, Chuma, Jordy Smith, Sandiso. Front, left to right: Owethu, Sibulele.
To find out more about Bitcoineta South Africa and the non-profit endeavors it serves, watch Lekker Feeling, a documentary by Aubrey Strobel:
The European Bitcoineta started its journey in early 2023, with Ariel Aguilar being one of the main catalysts behind the idea. Unlike its predecessors in El Salvador and South Africa, the European Bitcoineta was not funded by a previous team but instead secured support from individual donors, reflecting a grassroots approach to spreading financial literacy.
European Bitcoineta sports a hard-to-overlook bitcoin logo along with the message “Bitcoin is Work. Bitcoin is Time. Bitcoin is Hope.”
The European Bitcoineta is a Mercedes box van adorned with a prominent Bitcoin logo and inspiring messages, and serves as a mobile hub for education and discussion at numerous European Bitcoin conferences and local meetups. Inside its spacious interior, both notable bitcoiners and bitcoin plebs share their insights on the walls, fostering a sense of camaraderie and collaboration.
Inside the European Bitcoineta, one can find the wall of fame, where visitors can read messages from prominent bitcoiners such as Michael Saylor, Uncle Rockstar, Javier Bastardo, Hodlonaut, and many others.On the “pleb wall”, any bitcoiner can share their message (as long as space permits).
Introduced in December 2023 at the Africa Bitcoin Conference in Ghana, the fifth Bitcoineta was donated to the Ghanaian Bitcoin Cowries educational initiative as part of the Trezor Academy program.
Bitcoineta West Africa was launched in December 2023 at the Africa Bitcoin Conference. Among its elements, it bears the motto of the Trezor Academy initiative: Bitcoin. Education. Freedom.
Bitcoineta West Africa was funded by the proceeds from the bitcoin-only limited edition Trezor device, which was sold out within one day of its launch at the Bitcoin Amsterdam conference.
With plans for an extensive tour spanning Ghana, Togo, Benin, Nigeria, and potentially other countries within the ECOWAS political and economic union, Bitcoineta West Africa embodies the spirit of collaboration and solidarity in driving Bitcoin adoption and financial inclusion throughout the Global South.
Bitcoineta West Africa surrounded by a group of enthusiastic bitcoiners at the Black Star Square, Accra, Ghana.
All the Bitcoineta cars around the world share one overarching mission: to empower their local communities through bitcoin education, and thus improve the lives of common people that might have a strong need for bitcoin without being currently aware of such need. As they continue to traverse borders and break down barriers, Bitcoinetas serve as a reminder of the power of grassroots initiatives and the importance of financial education in shaping a more inclusive future. The tradition of Bitcoinetas will continue to flourish, and in the years to come we will hopefully encounter a brazenly decorated bitcoin car everywhere we go.
If the inspiring stories of Bitcoinetas have ignited a passion within you to make a difference in your community, we encourage you to take action! Reach out to one of the existing Bitcoineta teams for guidance, support, and inspiration on how to start your own initiative. Whether you're interested in spreading Bitcoin education, promoting financial literacy, or fostering empowerment in underserved areas, the Bitcoineta community is here to help you every step of the way. Together, we will orange pill the world!
This is a guest post by Josef Tetek. Opinions expressed are entirely their own and do not necessarily reflect those of BTC Inc or Bitcoin Magazine.
Over the last few years, digital currencies and gold have become decent barometers of speculative investor appetite. Such isn’t surprising given the evolution…
Over the last few years, digital currencies and gold have become decent barometers of speculative investor appetite. Such isn’t surprising given the evolution of the market into a “casino” following the pandemic, where retail traders have increased their speculative appetites.
“Such is unsurprising, given that retail investors often fall victim to the psychological behavior of the “fear of missing out.” The chart below shows the “dumb money index” versus the S&P 500. Once again, retail investors are very long equities relative to the institutional players ascribed to being the “smart money.””
“The difference between “smart” and “dumb money” investors shows that, more often than not, the “dumb money” invests near market tops and sells near market bottoms.”
That enthusiasm has increased sharply since last November as stocks surged in hopes that the Federal Reserve would cut interest rates. As noted by Sentiment Trader:
“Over the past 18 weeks, the straight-up rally has moved us to an interesting juncture in the Sentiment Cycle. For the past few weeks, the S&P 500 has demonstrated a high positive correlation to the ‘Enthusiasm’ part of the cycle and a highly negative correlation to the ‘Panic’ phase.”
That frenzy to chase the markets, driven by the psychological bias of the “fear of missing out,” has permeated the entirety of the market. As noted in “This Is Nuts:”
“Since then, the entire market has surged higher following last week’s earnings report from Nvidia (NVDA). The reason I say “this is nuts” is the assumption that all companies were going to grow earnings and revenue at Nvidia’s rate. There is little doubt about Nvidia’s earnings and revenue growth rates. However, to maintain that growth pace indefinitely, particularly at 32x price-to-sales, means others like AMD and Intel must lose market share.”
Of course, it is not just a speculative frenzy in the markets for stocks, specifically anything related to “artificial intelligence,” but that exuberance has spilled over into gold and cryptocurrencies.
Birds Of A Feather
There are a couple of ways to measure exuberance in the assets. While sentiment measures examine the broad market, technical indicators can reflect exuberance on individual asset levels. However, before we get to our charts, we need a brief explanation of statistics, specifically, standard deviation.
“Like a rubber band that has been stretched too far – it must be relaxed in order to be stretched again. This is exactly the same for stock prices that are anchored to their moving averages. Trends that get overextended in one direction, or another, always return to their long-term average. Even during a strong uptrend or strong downtrend, prices often move back (revert) to a long-term moving average.”
The idea of “stretching the rubber band” can be measured in several ways, but I will limit our discussion this week to Standard Deviation and measuring deviation with “Bollinger Bands.”
“Standard Deviation” is defined as:
“A measure of the dispersion of a set of data from its mean. The more spread apart the data, the higher the deviation. Standard deviation is calculated as the square root of the variance.”
In plain English,this meansthat the further away from the average that an event occurs, the more unlikely it becomes. As shown below, out of 1000 occurrences, only three will fall outside the area of 3 standard deviations. 95.4% of the time, events will occur within two standard deviations.
A second measure of “exuberance” is “relative strength.”
“In technical analysis, the relative strength index (RSI) is a momentum indicator that measures the magnitude of recent price changes to evaluate overbought or oversold conditions in the price of a stock or other asset. The RSI is displayed as an oscillator (a line graph that moves between two extremes) and can read from 0 to 100.
Traditional interpretation and usage of the RSI are that values of 70 or above indicate that a security is becoming overbought or overvalued and may be primed for a trend reversal or corrective pullback in price. An RSI reading of 30 or below indicates an oversold or undervalued condition.” – Investopedia
With those two measures, let’s look at Nvidia (NVDA), the poster child of speculative momentum trading in the markets. Nvidia trades more than 3 standard deviations above its moving average, and its RSI is 81. The last time this occurred was in July of 2023 when Nvidia consolidated and corrected prices through November.
Interestingly, gold also trades well into 3 standard deviation territory with an RSI reading of 75. Given that gold is supposed to be a “safe haven” or “risk off” asset, it is instead getting swept up in the current market exuberance.
The same is seen with digital currencies. Given the recent approval of spot, Bitcoin exchange-traded funds (ETFs), the panic bid to buy Bitcoin has pushed the price well into 3 standard deviation territory with an RSI of 73.
In other words, the stock market frenzy to “buy anything that is going up” has spread from just a handful of stocks related to artificial intelligence to gold and digital currencies.
It’s All Relative
We can see the correlation between stock market exuberance and gold and digital currency, which has risen since 2015 but accelerated following the post-pandemic, stimulus-fueled market frenzy. Since the market, gold and cryptocurrencies, or Bitcoin for our purposes, have disparate prices, we have rebased the performance to 100 in 2015.
Gold was supposed to be an inflation hedge. Yet, in 2022, gold prices fell as the market declined and inflation surged to 9%. However, as inflation has fallen and the stock market surged, so has gold. Notably, since 2015, gold and the market have moved in a more correlated pattern, which has reduced the hedging effect of gold in portfolios. In other words, during the subsequent market decline, gold will likely track stocks lower, failing to provide its “wealth preservation” status for investors.
The same goes for cryptocurrencies. Bitcoin is substantially more volatile than gold and tends to ebb and flow with the overall market. As sentiment surges in the S&P 500, Bitcoin and other cryptocurrencies follow suit as speculative appetites increase. Unfortunately, for individuals once again piling into Bitcoin to chase rising prices, if, or when, the market corrects, the decline in cryptocurrencies will likely substantially outpace the decline in market-based equities. This is particularly the case as Wall Street can now short the spot-Bitcoin ETFs, creating additional selling pressure on Bitcoin.
Just for added measure, here is Bitcoin versus gold.
Not A Recommendation
There are many narratives surrounding the markets, digital currency, and gold. However, in today’s market, more than in previous years, all assets are getting swept up into the investor-feeding frenzy.
Sure, this time could be different. I am only making an observation and not an investment recommendation.
However, from a portfolio management perspective, it will likely pay to remain attentive to the correlated risk between asset classes. If some event causes a reversal in bullish exuberance, cash and bonds may be the only place to hide.
BUFFALO, NY- March 11, 2024 – Impact Journals publishes scholarly journals in the biomedical sciences with a focus on all areas of cancer and aging research. Aging is one of the most prominent journals published by Impact Journals.
Credit: Impact Journals
BUFFALO, NY- March 11, 2024 – Impact Journals publishes scholarly journals in the biomedical sciences with a focus on all areas of cancer and aging research. Aging is one of the most prominent journals published by Impact Journals.
Impact Journals will be participating as an exhibitor at the American Association for Cancer Research (AACR) Annual Meeting 2024 from April 5-10 at the San Diego Convention Center in San Diego, California. This year, the AACR meeting theme is “Inspiring Science • Fueling Progress • Revolutionizing Care.”
Visit booth #4159 at the AACR Annual Meeting 2024 to connect with members of the Agingteam.
About Aging-US:
Agingpublishes research papers in all fields of aging research including but not limited, aging from yeast to mammals, cellular senescence, age-related diseases such as cancer and Alzheimer’s diseases and their prevention and treatment, anti-aging strategies and drug development and especially the role of signal transduction pathways such as mTOR in aging and potential approaches to modulate these signaling pathways to extend lifespan. The journal aims to promote treatment of age-related diseases by slowing down aging, validation of anti-aging drugs by treating age-related diseases, prevention of cancer by inhibiting aging. Cancer and COVID-19 are age-related diseases.
Agingis indexed and archived byPubMed/Medline (abbreviated as “Aging (Albany NY)”), PubMed Central, Web of Science: Science Citation Index Expanded (abbreviated as “Aging‐US” and listed in the Cell Biology and Geriatrics & Gerontology categories), Scopus (abbreviated as “Aging” and listed in the Cell Biology and Aging categories), Biological Abstracts, BIOSIS Previews, EMBASE, META (Chan Zuckerberg Initiative) (2018-2022), and Dimensions (Digital Science).
Please visit our website at www.Aging-US.com and connect with us:
We use cookies on our website to give you the most relevant experience by remembering your preferences and repeat visits. By clicking “Accept”, you consent to the use of ALL the cookies.
This website uses cookies to improve your experience while you navigate through the website. Out of these, the cookies that are categorized as necessary are stored on your browser as they are essential for the working of basic functionalities of the website. We also use third-party cookies that help us analyze and understand how you use this website. These cookies will be stored in your browser only with your consent. You also have the option to opt-out of these cookies. But opting out of some of these cookies may affect your browsing experience.
Necessary cookies are absolutely essential for the website to function properly. These cookies ensure basic functionalities and security features of the website, anonymously.
Cookie
Duration
Description
cookielawinfo-checbox-analytics
11 months
This cookie is set by GDPR Cookie Consent plugin. The cookie is used to store the user consent for the cookies in the category "Analytics".
cookielawinfo-checbox-functional
11 months
The cookie is set by GDPR cookie consent to record the user consent for the cookies in the category "Functional".
cookielawinfo-checbox-others
11 months
This cookie is set by GDPR Cookie Consent plugin. The cookie is used to store the user consent for the cookies in the category "Other.
cookielawinfo-checkbox-necessary
11 months
This cookie is set by GDPR Cookie Consent plugin. The cookies is used to store the user consent for the cookies in the category "Necessary".
cookielawinfo-checkbox-performance
11 months
This cookie is set by GDPR Cookie Consent plugin. The cookie is used to store the user consent for the cookies in the category "Performance".
viewed_cookie_policy
11 months
The cookie is set by the GDPR Cookie Consent plugin and is used to store whether or not user has consented to the use of cookies. It does not store any personal data.
Functional cookies help to perform certain functionalities like sharing the content of the website on social media platforms, collect feedbacks, and other third-party features.
Performance cookies are used to understand and analyze the key performance indexes of the website which helps in delivering a better user experience for the visitors.
Analytical cookies are used to understand how visitors interact with the website. These cookies help provide information on metrics the number of visitors, bounce rate, traffic source, etc.
Advertisement cookies are used to provide visitors with relevant ads and marketing campaigns. These cookies track visitors across websites and collect information to provide customized ads.


