Uncategorized
Robotic process automation market 2023-2027: A descriptive analysis of five forces model, market dynamics, and segmentation – Technavio
Robotic process automation market 2023-2027: A descriptive analysis of five forces model, market dynamics, and segmentation – Technavio
PR Newswire
NEW YORK, Feb. 1, 2023
NEW YORK, Feb. 1, 2023 /PRNewswire/ — According to Technavio, the global rob…
Share this:

Robotic process automation market 2023-2027: A descriptive analysis of five forces model, market dynamics, and segmentation - Technavio
PR Newswire
NEW YORK, Feb. 1, 2023
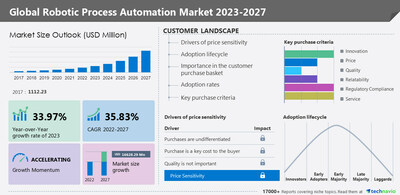
NEW YORK, Feb. 1, 2023 /PRNewswire/ -- According to Technavio, the global robotic process automation market size is estimated to grow by USD 16,628.29 million from 2022 to 2027. The market is estimated to grow at a CAGR of 35.83% during the forecast period. Moreover, the growth momentum will accelerate. North America will account for 44% of the market's growth during the forecast period. The report provides a comprehensive analysis of growth opportunities at regional levels, new product launches, the latest trends, and the post-pandemic recovery of the global market. For more Insights on market size, Request a sample report
Global robotic process automation market - Five forces
The global robotic process automation market is fragmented, and the five forces analysis covers–
- Bargaining power of buyers
- The threat of new entrants
- Threat of rivalry
- Bargaining power of suppliers
- Threat of substitutes
- For an interpretation of Porter's five forces model – buy the report!
Global robotic process automation market – Customer landscape
The report includes the market's adoption lifecycle, from the innovator's stage to the laggard's stage. It focuses on adoption rates in different regions based on penetration. Furthermore, the report also includes key purchase criteria and drivers of price sensitivity to help companies evaluate and develop their growth strategies.
Global robotic process automation market - Segmentation assessment
Segment overview
Technavio has segmented the market based on type (services and software) and end-user (BFSI, IT/ITES, telecom, logistics, and others).
- The services segment will account for a significant share of the market's growth during the forecast period. This segment includes consulting, implementing, and training services. Service providers are improving their consulting, training, and advising offerings due to intense rivalry in the market. Continuous improvements in automation services that offer high scalability while minimizing costs have increased the demand for RPA.
Geography overview
Based on geography, the global robotic process automation market is segmented into North America, Europe, APAC, South America, and Middle East and Africa. The report provides actionable insights and estimates the contribution of all regions to the growth of the global robotic process automation market.
- North America is estimated to account for 44% of the growth of the global market during the forecast period. Industries in the region focus on improving cognitive automation throughout their business operations with the help of RPA. The adoption of RPA is expected to increase, as industries are focusing on transforming their business operations. The optimization, transformation, and transition in industries are expected to increase the adoption of RPA during the forecast period
Global robotic process automation market – Market dynamics
Key factor driving market growth
- Improved cost savings for businesses are driving the growth of the market.
- Industries are focusing on optimizing operational costs, which include the reduction of manual labor.
- The implementation of RPA ensures a high return on investments, and its cost is lower than the procurement of industrial workers with different skill sets.
- RPA can be easily integrated with different business applications, which allows industries to reduce the overhead cost related to manpower.
- With the help of RPA, industries can expand their working capabilities with more flexibility.
- They can manage business processes at a lower cost by reducing expenses in procuring on-shore and off-shore manpower.
- Such factors will fuel the market growth during the forecast period.
Leading trends influencing the market
- Emerging trends in business process transformation are supporting market growth.
- Various business operations are interlinked with other processes. For instance, robotic process automation plays a major role in service delivery automation.
- Industries such as banking and financial services focus on timely deliverables and precision.
- With the integration of robotic process automation, they can process a large amount of data, which enables fast data exchange with a high level of precision.
- Such factors will further propel the market growth during the forecast period.
Major challenges hindering the market growth
- The subscription cost of robotic process automation software is challenging the market growth.
- The implementation of RPA software includes the price quoted by a third-party vendor.
- Therefore, the subscription of RPA involves scheduled software updates and maintenance, and the pricing is based on the business model implementation.
- Several regulatory terms and conditions need to be settled between the end-user and software provider before entering a contract.
- This can increase the subscription cost or the cost incurred in design and development.
- In case of conflict, the subscription negotiation has to be renewed, or the business model should be changed, both of which are time-intensive processes that can lead to downtime.
- This affects the business process and productivity, which may limit the market growth during the forecast period.
What are the key data covered in this robotic process automation market report?
- CAGR of the market during the forecast period
- Detailed information on factors that will drive the growth of the robotic process automation market between 2023 and 2027
- Precise estimation of the size of the robotic process automation market and its contribution to the parent market
- Accurate predictions about upcoming trends and changes in consumer behavior
- Growth of the robotic process automation market across North America, Europe, APAC, South America, and Middle East and Africa
- A thorough analysis of the market's competitive landscape and detailed information about vendors
- Comprehensive analysis of factors that will challenge the growth of robotic process automation market vendors
Gain instant access to 17,000+ market research reports.
Technavio's SUBSCRIPTION platform
Related Reports:
The digital process automation market size is expected to increase by USD 8.08 billion from 2021 to 2026, and the market's growth momentum will accelerate at a CAGR of 15.46%. This report extensively covers digital process automation market segmentation by deployment (on-premises and cloud) and geography (North America, Europe, APAC, MEA, and South America).
The size of the process automation market in Europe is expected to increase by USD 2.43 billion from 2021 to 2026. The report extensively covers segmentation by type (discrete automation and process automation) and geography (Germany, UK, France, and Rest of Europe).
Robotic Process Automation Market Scope | |
Report Coverage | Details |
Page number | 178 |
Base year | 2022 |
Historic period | 2017-2021 |
Forecast period | 2023-2027 |
Growth momentum & CAGR | Accelerate at a CAGR of 35.83% |
Market growth 2023-2027 | USD 16,628.29 million |
Market structure | Fragmented |
YoY growth 2022-2023 (%) | 33.97 |
Regional analysis | North America, Europe, APAC, South America, and Middle East and Africa |
Performing market contribution | North America at 44% |
Key countries | US, China, Japan, UK, and Germany |
Competitive landscape | Leading vendors, market positioning of vendors, competitive strategies, and industry risks |
Key companies profiled | Accenture Plc, Advanced Systems Concepts Inc., Amelia US LLC, Atos SE, Automation Anywhere Inc., Cognizant Technology Solutions Corp., Deloitte Touche Tohmatsu Ltd., Genpact Ltd., Infosys Ltd., International Business Machines Corp., Kofax Inc., Microsoft Corp., NICE Ltd., Nintex Global Ltd., Nippon Telegraph and Telephone Corp., OnviSource Inc., Pegasystems Inc., SS and C Technologies Holdings Inc., UiPath Inc., and WorkFusion Inc. |
Market dynamics | Parent market analysis, market growth inducers and obstacles, fast-growing and slow-growing segment analysis, COVID-19 impact and recovery analysis and future consumer dynamics, and market condition analysis for the forecast period. |
Customization purview | If our report has not included the data that you are looking for, you can reach out to our analysts and get segments customized. |
Browse for Technavio's information technology market reports
Table of contents
1 Executive Summary
- 1.1 Market overview
- Exhibit 01: Executive Summary – Chart on Market Overview
- Exhibit 02: Executive Summary – Data Table on Market Overview
- Exhibit 03: Executive Summary – Chart on Global Market Characteristics
- Exhibit 04: Executive Summary – Chart on Market by Geography
- Exhibit 05: Executive Summary – Chart on Market Segmentation by Type
- Exhibit 06: Executive Summary – Chart on Market Segmentation by End-user
- Exhibit 07: Executive Summary – Chart on Incremental Growth
- Exhibit 08: Executive Summary – Data Table on Incremental Growth
- Exhibit 09: Executive Summary – Chart on Vendor Market Positioning
2 Market Landscape
- 2.1 Market ecosystem
- Exhibit 10: Parent market
- Exhibit 11: Market Characteristics
3 Market Sizing
- 3.1 Market definition
- Exhibit 12: Offerings of vendors included in the market definition
- 3.2 Market segment analysis
- Exhibit 13: Market segments
- 3.3 Market size 2022
- 3.4 Market outlook: Forecast for 2022-2027
- Exhibit 14: Chart on Global - Market size and forecast 2022-2027 ($ million)
- Exhibit 15: Data Table on Global - Market size and forecast 2022-2027 ($ million)
- Exhibit 16: Chart on Global Market: Year-over-year growth 2022-2027 (%)
- Exhibit 17: Data Table on Global Market: Year-over-year growth 2022-2027 (%)
4 Historic Market Size
- 4.1 Global robotic process automation market 2017 - 2021
- Exhibit 18: Historic Market Size – Data Table on Global robotic process automation market 2017 - 2021 ($ million)
- 4.2 Type Segment Analysis 2017 - 2021
- Exhibit 19: Historic Market Size – Type Segment 2017 - 2021 ($ million)
- 4.3 End-user Segment Analysis 2017 - 2021
- Exhibit 20: Historic Market Size – End-user Segment 2017 - 2021 ($ million)
- 4.4 Geography Segment Analysis 2017 - 2021
- Exhibit 21: Historic Market Size – Geography Segment 2017 - 2021 ($ million)
- 4.5 Country Segment Analysis 2017 - 2021
- Exhibit 22: Historic Market Size – Country Segment 2017 - 2021 ($ million)
5 Five Forces Analysis
- 5.1 Five forces summary
- Exhibit 23: Five forces analysis - Comparison between 2022 and 2027
- 5.2 Bargaining power of buyers
- Exhibit 24: Chart on Bargaining power of buyers – Impact of key factors 2022 and 2027
- 5.3 Bargaining power of suppliers
- Exhibit 25: Bargaining power of suppliers – Impact of key factors in 2022 and 2027
- 5.4 Threat of new entrants
- Exhibit 26: Threat of new entrants – Impact of key factors in 2022 and 2027
- 5.5 Threat of substitutes
- Exhibit 27: Threat of substitutes – Impact of key factors in 2022 and 2027
- 5.6 Threat of rivalry
- Exhibit 28: Threat of rivalry – Impact of key factors in 2022 and 2027
- 5.7 Market condition
- Exhibit 29: Chart on Market condition - Five forces 2022 and 2027
6 Market Segmentation by Type
- 6.1 Market segments
- Exhibit 30: Chart on Type - Market share 2022-2027 (%)
- Exhibit 31: Data Table on Type - Market share 2022-2027 (%)
- 6.2 Comparison by Type
- Exhibit 32: Chart on Comparison by Type
- Exhibit 33: Data Table on Comparison by Type
- 6.3 Services - Market size and forecast 2022-2027
- Exhibit 34: Chart on Services - Market size and forecast 2022-2027 ($ million)
- Exhibit 35: Data Table on Services - Market size and forecast 2022-2027 ($ million)
- Exhibit 36: Chart on Services - Year-over-year growth 2022-2027 (%)
- Exhibit 37: Data Table on Services - Year-over-year growth 2022-2027 (%)
- 6.4 Software - Market size and forecast 2022-2027
- Exhibit 38: Chart on Software - Market size and forecast 2022-2027 ($ million)
- Exhibit 39: Data Table on Software - Market size and forecast 2022-2027 ($ million)
- Exhibit 40: Chart on Software - Year-over-year growth 2022-2027 (%)
- Exhibit 41: Data Table on Software - Year-over-year growth 2022-2027 (%)
- 6.5 Market opportunity by Type
- Exhibit 42: Market opportunity by Type ($ million)
7 Market Segmentation by End-user
- 7.1 Market segments
- Exhibit 43: Chart on End-user - Market share 2022-2027 (%)
- Exhibit 44: Data Table on End-user - Market share 2022-2027 (%)
- 7.2 Comparison by End-user
- Exhibit 45: Chart on Comparison by End-user
- Exhibit 46: Data Table on Comparison by End-user
- 7.3 BFSI - Market size and forecast 2022-2027
- Exhibit 47: Chart on BFSI - Market size and forecast 2022-2027 ($ million)
- Exhibit 48: Data Table on BFSI - Market size and forecast 2022-2027 ($ million)
- Exhibit 49: Chart on BFSI - Year-over-year growth 2022-2027 (%)
- Exhibit 50: Data Table on BFSI - Year-over-year growth 2022-2027 (%)
- 7.4 IT/ITES - Market size and forecast 2022-2027
- Exhibit 51: Chart on IT/ITES - Market size and forecast 2022-2027 ($ million)
- Exhibit 52: Data Table on IT/ITES - Market size and forecast 2022-2027 ($ million)
- Exhibit 53: Chart on IT/ITES - Year-over-year growth 2022-2027 (%)
- Exhibit 54: Data Table on IT/ITES - Year-over-year growth 2022-2027 (%)
- 7.5 Telecom - Market size and forecast 2022-2027
- Exhibit 55: Chart on Telecom - Market size and forecast 2022-2027 ($ million)
- Exhibit 56: Data Table on Telecom - Market size and forecast 2022-2027 ($ million)
- Exhibit 57: Chart on Telecom - Year-over-year growth 2022-2027 (%)
- Exhibit 58: Data Table on Telecom - Year-over-year growth 2022-2027 (%)
- 7.6 Logistics - Market size and forecast 2022-2027
- Exhibit 59: Chart on Logistics - Market size and forecast 2022-2027 ($ million)
- Exhibit 60: Data Table on Logistics - Market size and forecast 2022-2027 ($ million)
- Exhibit 61: Chart on Logistics - Year-over-year growth 2022-2027 (%)
- Exhibit 62: Data Table on Logistics - Year-over-year growth 2022-2027 (%)
- 7.7 Others - Market size and forecast 2022-2027
- Exhibit 63: Chart on Others - Market size and forecast 2022-2027 ($ million)
- Exhibit 64: Data Table on Others - Market size and forecast 2022-2027 ($ million)
- Exhibit 65: Chart on Others - Year-over-year growth 2022-2027 (%)
- Exhibit 66: Data Table on Others - Year-over-year growth 2022-2027 (%)
- 7.8 Market opportunity by End-user
- Exhibit 67: Market opportunity by End-user ($ million)
8 Customer Landscape
- 8.1 Customer landscape overview
- Exhibit 68: Analysis of price sensitivity, lifecycle, customer purchase basket, adoption rates, and purchase criteria
9 Geographic Landscape
- 9.1 Geographic segmentation
- Exhibit 69: Chart on Market share by geography 2022-2027 (%)
- Exhibit 70: Data Table on Market share by geography 2022-2027 (%)
- 9.2 Geographic comparison
- Exhibit 71: Chart on Geographic comparison
- Exhibit 72: Data Table on Geographic comparison
- 9.3 North America - Market size and forecast 2022-2027
- Exhibit 73: Chart on North America - Market size and forecast 2022-2027 ($ million)
- Exhibit 74: Data Table on North America - Market size and forecast 2022-2027 ($ million)
- Exhibit 75: Chart on North America - Year-over-year growth 2022-2027 (%)
- Exhibit 76: Data Table on North America - Year-over-year growth 2022-2027 (%)
- 9.4 Europe - Market size and forecast 2022-2027
- Exhibit 77: Chart on Europe - Market size and forecast 2022-2027 ($ million)
- Exhibit 78: Data Table on Europe - Market size and forecast 2022-2027 ($ million)
- Exhibit 79: Chart on Europe - Year-over-year growth 2022-2027 (%)
- Exhibit 80: Data Table on Europe - Year-over-year growth 2022-2027 (%)
- 9.5 APAC - Market size and forecast 2022-2027
- Exhibit 81: Chart on APAC - Market size and forecast 2022-2027 ($ million)
- Exhibit 82: Data Table on APAC - Market size and forecast 2022-2027 ($ million)
- Exhibit 83: Chart on APAC - Year-over-year growth 2022-2027 (%)
- Exhibit 84: Data Table on APAC - Year-over-year growth 2022-2027 (%)
- 9.6 South America - Market size and forecast 2022-2027
- Exhibit 85: Chart on South America - Market size and forecast 2022-2027 ($ million)
- Exhibit 86: Data Table on South America - Market size and forecast 2022-2027 ($ million)
- Exhibit 87: Chart on South America - Year-over-year growth 2022-2027 (%)
- Exhibit 88: Data Table on South America - Year-over-year growth 2022-2027 (%)
- 9.7 Middle East and Africa - Market size and forecast 2022-2027
- Exhibit 89: Chart on Middle East and Africa - Market size and forecast 2022-2027 ($ million)
- Exhibit 90: Data Table on Middle East and Africa - Market size and forecast 2022-2027 ($ million)
- Exhibit 91: Chart on Middle East and Africa - Year-over-year growth 2022-2027 (%)
- Exhibit 92: Data Table on Middle East and Africa - Year-over-year growth 2022-2027 (%)
- 9.8 US - Market size and forecast 2022-2027
- Exhibit 93: Chart on US - Market size and forecast 2022-2027 ($ million)
- Exhibit 94: Data Table on US - Market size and forecast 2022-2027 ($ million)
- Exhibit 95: Chart on US - Year-over-year growth 2022-2027 (%)
- Exhibit 96: Data Table on US - Year-over-year growth 2022-2027 (%)
- 9.9 UK - Market size and forecast 2022-2027
- Exhibit 97: Chart on UK - Market size and forecast 2022-2027 ($ million)
- Exhibit 98: Data Table on UK - Market size and forecast 2022-2027 ($ million)
- Exhibit 99: Chart on UK - Year-over-year growth 2022-2027 (%)
- Exhibit 100: Data Table on UK - Year-over-year growth 2022-2027 (%)
- 9.10 China - Market size and forecast 2022-2027
- Exhibit 101: Chart on China - Market size and forecast 2022-2027 ($ million)
- Exhibit 102: Data Table on China - Market size and forecast 2022-2027 ($ million)
- Exhibit 103: Chart on China - Year-over-year growth 2022-2027 (%)
- Exhibit 104: Data Table on China - Year-over-year growth 2022-2027 (%)
- 9.11 Japan - Market size and forecast 2022-2027
- Exhibit 105: Chart on Japan - Market size and forecast 2022-2027 ($ million)
- Exhibit 106: Data Table on Japan - Market size and forecast 2022-2027 ($ million)
- Exhibit 107: Chart on Japan - Year-over-year growth 2022-2027 (%)
- Exhibit 108: Data Table on Japan - Year-over-year growth 2022-2027 (%)
- 9.12 Germany - Market size and forecast 2022-2027
- Exhibit 109: Chart on Germany - Market size and forecast 2022-2027 ($ million)
- Exhibit 110: Data Table on Germany - Market size and forecast 2022-2027 ($ million)
- Exhibit 111: Chart on Germany - Year-over-year growth 2022-2027 (%)
- Exhibit 112: Data Table on Germany - Year-over-year growth 2022-2027 (%)
- 9.13 Market opportunity by geography
- Exhibit 113: Market opportunity by geography ($ million)
10 Drivers, Challenges, and Trends
- 10.1 Market drivers
- 10.2 Market challenges
- 10.3 Impact of drivers and challenges
- Exhibit 114: Impact of drivers and challenges in 2022 and 2027
- 10.4 Market trends
11 Vendor Landscape
- 11.1 Overview
- 11.2 Vendor landscape
- Exhibit 115: Overview on Criticality of inputs and Factors of differentiation
- 11.3 Landscape disruption
- Exhibit 116: Overview on factors of disruption
- 11.4 Industry risks
- Exhibit 117: Impact of key risks on business
12 Vendor Analysis
- 12.1 Vendors covered
- Exhibit 118: Vendors covered
- 12.2 Market positioning of vendors
- Exhibit 119: Matrix on vendor position and classification
- 12.3 Accenture Plc
- Exhibit 120: Accenture Plc - Overview
- Exhibit 121: Accenture Plc - Business segments
- Exhibit 122: Accenture Plc - Key news
- Exhibit 123: Accenture Plc - Key offerings
- Exhibit 124: Accenture Plc - Segment focus
- 12.4 Advanced Systems Concepts Inc.
- Exhibit 125: Advanced Systems Concepts Inc. - Overview
- Exhibit 126: Advanced Systems Concepts Inc. - Product / Service
- Exhibit 127: Advanced Systems Concepts Inc. - Key offerings
- 12.5 Amelia US LLC
- Exhibit 128: Amelia US LLC - Overview
- Exhibit 129: Amelia US LLC - Product / Service
- Exhibit 130: Amelia US LLC - Key offerings
- 12.6 Atos SE
- Exhibit 131: Atos SE - Overview
- Exhibit 132: Atos SE - Business segments
- Exhibit 133: Atos SE - Key news
- Exhibit 134: Atos SE - Key offerings
- Exhibit 135: Atos SE - Segment focus
- 12.7 Automation Anywhere Inc.
- Exhibit 136: Automation Anywhere Inc. - Overview
- Exhibit 137: Automation Anywhere Inc. - Product / Service
- Exhibit 138: Automation Anywhere Inc. - Key offerings
- 12.8 Cognizant Technology Solutions Corp.
- Exhibit 139: Cognizant Technology Solutions Corp. - Overview
- Exhibit 140: Cognizant Technology Solutions Corp. - Business segments
- Exhibit 141: Cognizant Technology Solutions Corp. - Key news
- Exhibit 142: Cognizant Technology Solutions Corp. - Key offerings
- Exhibit 143: Cognizant Technology Solutions Corp. - Segment focus
- 12.9 Deloitte Touche Tohmatsu Ltd.
- Exhibit 144: Deloitte Touche Tohmatsu Ltd. - Overview
- Exhibit 145: Deloitte Touche Tohmatsu Ltd. - Business segments
- Exhibit 146: Deloitte Touche Tohmatsu Ltd. - Key offerings
- Exhibit 147: Deloitte Touche Tohmatsu Ltd. - Segment focus
- 12.10 Genpact Ltd.
- Exhibit 148: Genpact Ltd. - Overview
- Exhibit 149: Genpact Ltd. - Business segments
- Exhibit 150: Genpact Ltd. - Key news
- Exhibit 151: Genpact Ltd. - Key offerings
- Exhibit 152: Genpact Ltd. - Segment focus
- 12.11 Infosys Ltd.
- Exhibit 153: Infosys Ltd. - Overview
- Exhibit 154: Infosys Ltd. - Business segments
- Exhibit 155: Infosys Ltd. - Key news
- Exhibit 156: Infosys Ltd. - Key offerings
- Exhibit 157: Infosys Ltd. - Segment focus
- 12.12 International Business Machines Corp.
- Exhibit 158: International Business Machines Corp. - Overview
- Exhibit 159: International Business Machines Corp. - Business segments
- Exhibit 160: International Business Machines Corp. - Key news
- Exhibit 161: International Business Machines Corp. - Key offerings
- Exhibit 162: International Business Machines Corp. - Segment focus
- 12.13 NICE Ltd.
- Exhibit 163: NICE Ltd. - Overview
- Exhibit 164: NICE Ltd. - Business segments
- Exhibit 165: NICE Ltd. - Key news
- Exhibit 166: NICE Ltd. - Key offerings
- Exhibit 167: NICE Ltd. - Segment focus
- 12.14 Nintex Global Ltd.
- Exhibit 168: Nintex Global Ltd. - Overview
- Exhibit 169: Nintex Global Ltd. - Product / Service
- Exhibit 170: Nintex Global Ltd. - Key offerings
- 12.15 Pegasystems Inc.
- Exhibit 171: Pegasystems Inc. - Overview
- Exhibit 172: Pegasystems Inc. - Product / Service
- Exhibit 173: Pegasystems Inc. - Key news
- Exhibit 174: Pegasystems Inc. - Key offerings
- 12.16 SS and C Technologies Holdings Inc.
- Exhibit 175: SS and C Technologies Holdings Inc. - Overview
- Exhibit 176: SS and C Technologies Holdings Inc. - Product / Service
- Exhibit 177: SS and C Technologies Holdings Inc. - Key news
- Exhibit 178: SS and C Technologies Holdings Inc. - Key offerings
- 12.17 UiPath Inc.
- Exhibit 179: UiPath Inc. - Overview
- Exhibit 180: UiPath Inc. - Business segments
- Exhibit 181: UiPath Inc. - Key offerings
- Exhibit 182: UiPath Inc. - Segment focus
13 Appendix
- 13.1 Scope of the report
- 13.2 Inclusions and exclusions checklist
- Exhibit 183: Inclusions checklist
- Exhibit 184: Exclusions checklist
- 13.3 Currency conversion rates for US$
- Exhibit 185: Currency conversion rates for US$
- 13.4 Research methodology
- Exhibit 186: Research methodology
- Exhibit 187: Validation techniques employed for market sizing
- Exhibit 188: Information sources
- 13.5 List of abbreviations
- Exhibit 189: List of abbreviations
Technavio is a leading global technology research and advisory company. Their research and analysis focus on emerging market trends and provide actionable insights to help businesses identify market opportunities and develop effective strategies to optimize their market positions. With over 500 specialized analysts, Technavio's report library consists of more than 17,000 reports and counting, covering 800 technologies, spanning across 50 countries. Their client base consists of enterprises of all sizes, including more than 100 Fortune 500 companies. This growing client base relies on Technavio's comprehensive coverage, extensive research, and actionable market insights to identify opportunities in existing and potential markets and assess their competitive positions within changing market scenarios.
Contact
Technavio Research
Jesse Maida
Media & Marketing Executive
US: +1 844 364 1100
UK: +44 203 893 3200
Email: media@technavio.com
Website: www.technavio.com/

View original content to download multimedia:https://www.prnewswire.com/news-releases/robotic-process-automation-market-2023-2027-a-descriptive-analysis-of-five-forces-model-market-dynamics-and-segmentation---technavio-301734475.html
SOURCE Technavio
Uncategorized
NY Fed Finds Medium, Long-Term Inflation Expectations Jump Amid Surge In Stock Market Optimism
NY Fed Finds Medium, Long-Term Inflation Expectations Jump Amid Surge In Stock Market Optimism
One month after the inflation outlook tracked…
Share this:


One month after the inflation outlook tracked by the NY Fed Consumer Survey extended their late 2023 slide, with 3Y inflation expectations in January sliding to a record low 2.4% (from 2.6% in December), even as 1 and 5Y inflation forecasts remained flat, moments ago the NY Fed reported that in February there was a sharp rebound in longer-term inflation expectations, rising to 2.7% from 2.4% at the three-year ahead horizon, and jumping to 2.9% from 2.5% at the five-year ahead horizon, while the 1Y inflation outlook was flat for the 3rd month in a row, stuck at 3.0%.
The increases in both the three-year ahead and five-year ahead measures were most pronounced for respondents with at most high school degrees (in other words, the "really smart folks" are expecting deflation soon). The survey’s measure of disagreement across respondents (the difference between the 75th and 25th percentile of inflation expectations) decreased at all horizons, while the median inflation uncertainty—or the uncertainty expressed regarding future inflation outcomes—declined at the one- and three-year ahead horizons and remained unchanged at the five-year ahead horizon.
Going down the survey, we find that the median year-ahead expected price changes increased by 0.1 percentage point to 4.3% for gas; decreased by 1.8 percentage points to 6.8% for the cost of medical care (its lowest reading since September 2020); decreased by 0.1 percentage point to 5.8% for the cost of a college education; and surprisingly decreased by 0.3 percentage point for rent to 6.1% (its lowest reading since December 2020), and remained flat for food at 4.9%.

We find the rent expectations surprising because it is happening just asking rents are rising across the country.

At the same time as consumers erroneously saw sharply lower rents, median home price growth expectations remained unchanged for the fifth consecutive month at 3.0%.
Turning to the labor market, the survey found that the average perceived likelihood of voluntary and involuntary job separations increased, while the perceived likelihood of finding a job (in the event of a job loss) declined. "The mean probability of leaving one’s job voluntarily in the next 12 months also increased, by 1.8 percentage points to 19.5%."

Mean unemployment expectations - or the mean probability that the U.S. unemployment rate will be higher one year from now - decreased by 1.1 percentage points to 36.1%, the lowest reading since February 2022. Additionally, the median one-year-ahead expected earnings growth was unchanged at 2.8%, remaining slightly below its 12-month trailing average of 2.9%.
Turning to household finance, we find the following:
- The median expected growth in household income remained unchanged at 3.1%. The series has been moving within a narrow range of 2.9% to 3.3% since January 2023, and remains above the February 2020 pre-pandemic level of 2.7%.
- Median household spending growth expectations increased by 0.2 percentage point to 5.2%. The increase was driven by respondents with a high school degree or less.
- Median year-ahead expected growth in government debt increased to 9.3% from 8.9%.
- The mean perceived probability that the average interest rate on saving accounts will be higher in 12 months increased by 0.6 percentage point to 26.1%, remaining below its 12-month trailing average of 30%.
- Perceptions about households’ current financial situations deteriorated somewhat with fewer respondents reporting being better off than a year ago. Year-ahead expectations also deteriorated marginally with a smaller share of respondents expecting to be better off and a slightly larger share of respondents expecting to be worse off a year from now.
- The mean perceived probability that U.S. stock prices will be higher 12 months from now increased by 1.4 percentage point to 38.9%.
- At the same time, perceptions and expectations about credit access turned less optimistic: "Perceptions of credit access compared to a year ago deteriorated with a larger share of respondents reporting tighter conditions and a smaller share reporting looser conditions compared to a year ago."

Also, a smaller percentage of consumers, 11.45% vs 12.14% in prior month, expect to not be able to make minimum debt payment over the next three months

Last, and perhaps most humorous, is the now traditional cognitive dissonance one observes with these polls, because at a time when long-term inflation expectations jumped, which clearly suggests that financial conditions will need to be tightened, the number of respondents expecting higher stock prices one year from today jumped to the highest since November 2021... which incidentally is just when the market topped out during the last cycle before suffering a painful bear market.

Uncategorized
Homes listed for sale in early June sell for $7,700 more
New Zillow research suggests the spring home shopping season may see a second wave this summer if mortgage rates fall
The post Homes listed for sale in…
Share this:


- A Zillow analysis of 2023 home sales finds homes listed in the first two weeks of June sold for 2.3% more.
- The best time to list a home for sale is a month later than it was in 2019, likely driven by mortgage rates.
- The best time to list can be as early as the second half of February in San Francisco, and as late as the first half of July in New York and Philadelphia.
Spring home sellers looking to maximize their sale price may want to wait it out and list their home for sale in the first half of June. A new Zillow® analysis of 2023 sales found that homes listed in the first two weeks of June sold for 2.3% more, a $7,700 boost on a typical U.S. home.
The best time to list consistently had been early May in the years leading up to the pandemic. The shift to June suggests mortgage rates are strongly influencing demand on top of the usual seasonality that brings buyers to the market in the spring. This home-shopping season is poised to follow a similar pattern as that in 2023, with the potential for a second wave if the Federal Reserve lowers interest rates midyear or later.
The 2.3% sale price premium registered last June followed the first spring in more than 15 years with mortgage rates over 6% on a 30-year fixed-rate loan. The high rates put home buyers on the back foot, and as rates continued upward through May, they were still reassessing and less likely to bid boldly. In June, however, rates pulled back a little from 6.79% to 6.67%, which likely presented an opportunity for determined buyers heading into summer. More buyers understood their market position and could afford to transact, boosting competition and sale prices.
The old logic was that sellers could earn a premium by listing in late spring, when search activity hit its peak. Now, with persistently low inventory, mortgage rate fluctuations make their own seasonality. First-time home buyers who are on the edge of qualifying for a home loan may dip in and out of the market, depending on what’s happening with rates. It is almost certain the Federal Reserve will push back any interest-rate cuts to mid-2024 at the earliest. If mortgage rates follow, that could bring another surge of buyers later this year.
Mortgage rates have been impacting affordability and sale prices since they began rising rapidly two years ago. In 2022, sellers nationwide saw the highest sale premium when they listed their home in late March, right before rates barreled past 5% and continued climbing.
Zillow’s research finds the best time to list can vary widely by metropolitan area. In 2023, it was as early as the second half of February in San Francisco, and as late as the first half of July in New York. Thirty of the top 35 largest metro areas saw for-sale listings command the highest sale prices between May and early July last year.
Zillow also found a wide range in the sale price premiums associated with homes listed during those peak periods. At the hottest time of the year in San Jose, homes sold for 5.5% more, a $88,000 boost on a typical home. Meanwhile, homes in San Antonio sold for 1.9% more during that same time period.
| Metropolitan Area | Best Time to List | Price Premium | Dollar Boost |
| United States | First half of June | 2.3% | $7,700 |
| New York, NY | First half of July | 2.4% | $15,500 |
| Los Angeles, CA | First half of May | 4.1% | $39,300 |
| Chicago, IL | First half of June | 2.8% | $8,800 |
| Dallas, TX | First half of June | 2.5% | $9,200 |
| Houston, TX | Second half of April | 2.0% | $6,200 |
| Washington, DC | Second half of June | 2.2% | $12,700 |
| Philadelphia, PA | First half of July | 2.4% | $8,200 |
| Miami, FL | First half of June | 2.3% | $12,900 |
| Atlanta, GA | Second half of June | 2.3% | $8,700 |
| Boston, MA | Second half of May | 3.5% | $23,600 |
| Phoenix, AZ | First half of June | 3.2% | $14,700 |
| San Francisco, CA | Second half of February | 4.2% | $50,300 |
| Riverside, CA | First half of May | 2.7% | $15,600 |
| Detroit, MI | First half of July | 3.3% | $7,900 |
| Seattle, WA | First half of June | 4.3% | $31,500 |
| Minneapolis, MN | Second half of May | 3.7% | $13,400 |
| San Diego, CA | Second half of April | 3.1% | $29,600 |
| Tampa, FL | Second half of June | 2.1% | $8,000 |
| Denver, CO | Second half of May | 2.9% | $16,900 |
| Baltimore, MD | First half of July | 2.2% | $8,200 |
| St. Louis, MO | First half of June | 2.9% | $7,000 |
| Orlando, FL | First half of June | 2.2% | $8,700 |
| Charlotte, NC | Second half of May | 3.0% | $11,000 |
| San Antonio, TX | First half of June | 1.9% | $5,400 |
| Portland, OR | Second half of April | 2.6% | $14,300 |
| Sacramento, CA | First half of June | 3.2% | $17,900 |
| Pittsburgh, PA | Second half of June | 2.3% | $4,700 |
| Cincinnati, OH | Second half of April | 2.7% | $7,500 |
| Austin, TX | Second half of May | 2.8% | $12,600 |
| Las Vegas, NV | First half of June | 3.4% | $14,600 |
| Kansas City, MO | Second half of May | 2.5% | $7,300 |
| Columbus, OH | Second half of June | 3.3% | $10,400 |
| Indianapolis, IN | First half of July | 3.0% | $8,100 |
| Cleveland, OH | First half of July | 3.4% | $7,400 |
| San Jose, CA | First half of June | 5.5% | $88,400 |
The post Homes listed for sale in early June sell for $7,700 more appeared first on Zillow Research.
federal reserve pandemic home sales mortgage rates interest ratesUncategorized
February Employment Situation
By Paul Gomme and Peter Rupert The establishment data from the BLS showed a 275,000 increase in payroll employment for February, outpacing the 230,000…
Share this:


By Paul Gomme and Peter Rupert
The establishment data from the BLS showed a 275,000 increase in payroll employment for February, outpacing the 230,000 average over the previous 12 months. The payroll data for January and December were revised down by a total of 167,000. The private sector added 223,000 new jobs, the largest gain since May of last year.

Temporary help services employment continues a steep decline after a sharp post-pandemic rise.


Average hours of work increased from 34.2 to 34.3. The increase, along with the 223,000 private employment increase led to a hefty increase in total hours of 5.6% at an annualized rate, also the largest increase since May of last year.

The establishment report, once again, beat “expectations;” the WSJ survey of economists was 198,000. Other than the downward revisions, mentioned above, another bit of negative news was a smallish increase in wage growth, from $34.52 to $34.57.

The household survey shows that the labor force increased 150,000, a drop in employment of 184,000 and an increase in the number of unemployed persons of 334,000. The labor force participation rate held steady at 62.5, the employment to population ratio decreased from 60.2 to 60.1 and the unemployment rate increased from 3.66 to 3.86. Remember that the unemployment rate is the number of unemployed relative to the labor force (the number employed plus the number unemployed). Consequently, the unemployment rate can go up if the number of unemployed rises holding fixed the labor force, or if the labor force shrinks holding the number unemployed unchanged. An increase in the unemployment rate is not necessarily a bad thing: it may reflect a strong labor market drawing “marginally attached” individuals from outside the labor force. Indeed, there was a 96,000 decline in those workers.


Earlier in the week, the BLS announced JOLTS (Job Openings and Labor Turnover Survey) data for January. There isn’t much to report here as the job openings changed little at 8.9 million, the number of hires and total separations were little changed at 5.7 million and 5.3 million, respectively.

As has been the case for the last couple of years, the number of job openings remains higher than the number of unemployed persons.

Also earlier in the week the BLS announced that productivity increased 3.2% in the 4th quarter with output rising 3.5% and hours of work rising 0.3%.

The bottom line is that the labor market continues its surprisingly (to some) strong performance, once again proving stronger than many had expected. This strength makes it difficult to justify any interest rate cuts soon, particularly given the recent inflation spike.
unemployment pandemic unemployment


-

 Uncategorized3 weeks ago
All Of The Elements Are In Place For An Economic Crisis Of Staggering Proportions
-

 Uncategorized1 month ago
Cathie Wood sells a major tech stock (again)
-

 Uncategorized3 weeks ago
California Counties Could Be Forced To Pay $300 Million To Cover COVID-Era Program
-

 Uncategorized2 weeks ago
Apparel Retailer Express Moving Toward Bankruptcy
-

 Uncategorized4 weeks ago
Industrial Production Decreased 0.1% in January
-

 International3 days ago
EyePoint poaches medical chief from Apellis; Sandoz CFO, longtime BioNTech exec to retire
-

 International3 days ago
Walmart launches clever answer to Target’s new membership program
-

 Uncategorized3 weeks ago
RFK Jr: The Wuhan Cover-Up & The Rise Of The Biowarfare-Industrial Complex