Uncategorized
January Jobs Preview: Market Wants A Miss As It Raises Rate Cut Odds
January Jobs Preview: Market Wants A Miss As It Raises Rate Cut Odds
With the QRA, Fed and all megatech earnings now in the rearview mirror,…
Share this:


With the QRA, Fed and all megatech earnings now in the rearview mirror, the busiest week of the quarter comes to a merciful end tomorrow, but first we have to survive the January payrolls report. Here is what economists believe the report will show:
- Nonfarm payrolls are expected to grow by 185k, a drop from December's 216k,
- The unemployment rate is forecast to tick up to 3.8% from 3.7%.
- Average hourly earnings are seen rising 0.3% M/M in January, easing from the 0.4% pace in December; the Y/Y increase is expected to remain unchanged at 4.1%.
According to Newsquawk, labor market proxies have been leaning soft with a miss in ADP and a rise in Challenger layoffs (since ADP is always the polar opposite of the BLS print, expect the jobs number to be a multiple-sigma beat).
Elsewhere, the initial jobless claims data for the week that coincides with the usual BLS survey window saw a notable decline, although it was likely weather-related with more recent initial claims figures rising, whereas the continued claims data rose. However, the December JOLTS data rose above expectations while the quits rate was unchanged (this data, however, lags by a month). Analysts highlight the unchanged quits rate signals slower wage gains, which was also evident in the softer US Employment Cost Index report for Q4. Note, the BLS will also be releasing annual revisions to the establishment survey, but it will not provide revisions to the household survey despite adopting a new methodology for the January figures, thus, the January household survey data will not be directly comparable with data for December 2023 or earlier periods.
Regarding Fed implications, Fed Chair Powell stated the base case is not for a March rate cut but he did add that if the labour market saw an unexpected weakening, the Fed would be prepared to cut sooner. A dire report which takes the Fed off their base case would likely help put a March rate cut in play, providing the disinflation process continues, but there is still plenty of data due between now and March, including another NFP and PCE report, as well as two CPI reports.
Some more details on each of these:
EXPECTATIONS:
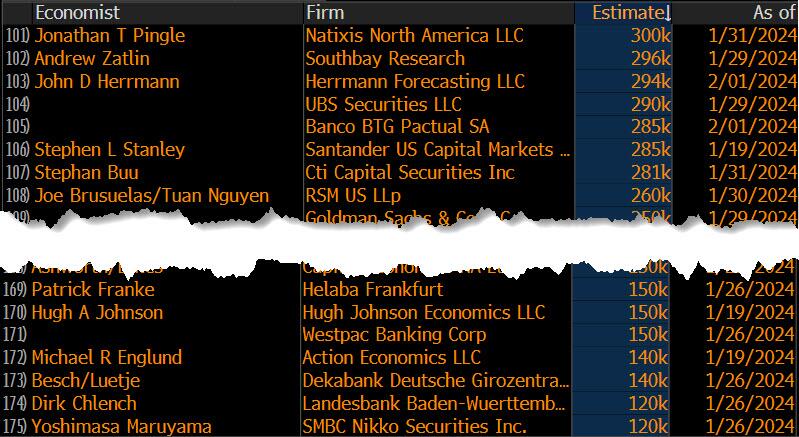
- Headline jobs added are expected to grow by 185k in January, down from the 216k gain in December although analyst forecasts are wide, ranging between 120-300k.
- Private payrolls are expected to rise by 170k, up from the 164k added in the prior month.
- Manufacturing payrolls are expected to add 5k jobs vs 6k in December.
- Private payrolls are expected to rise by 170k, up from the 164k added in the prior month.
- The unemployment rate is expected to tick up to 3.8% from 3.7%, with analysts forecasting between 3.7-3.9%.
- Note, in December the labour force participation saw a notable decline to 62.5% from 62.8%.
- On wages, average hourly earnings are seen rising 0.3%, easing from the prior 0.4%.
- The Y/Y earnings are expected to rise by 4.1%, maintaining the pace in January, although forecasts range between 4.0 and 4.2%.
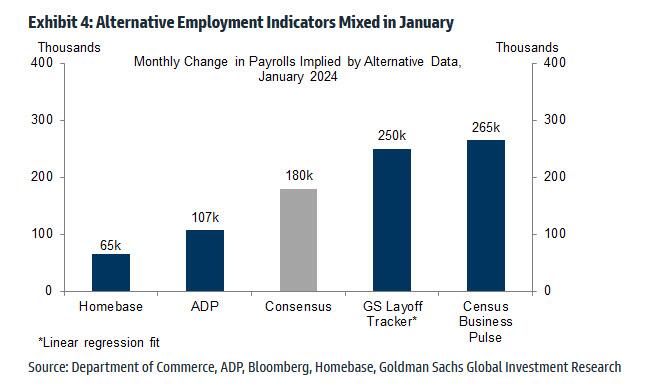
One of the notable upside outliers, is Goldman which in its preview writes that it expects "a strong report, with a large underlying gain in employment partially offset by weather effects... We estimate nonfarm payrolls rose by 250k in January (mom sa)—above consensus of +185k—reflecting below-normal end-of-year layoff rates that more than offset a roughly 50k drag from cold, snowy weather during the survey week. We see a wide range of outcomes for the weather drag and expect this headwind will be visible in the construction and leisure and hospitality categories. Big Data employment indicators were mixed in the month but are also broadly consistent with low layoff rates and a potentially large weather drag."
LABOR MARKET PROXIES:
- The January ADP report, although not the best gauge for NFP, saw 107k jobs added in January, beneath the 145k forecast and prior 158k. However, Pantheon Macroeconomics highlight that the ADP measure has been close to the official estimate in the past three months. Meanwhile, within the ADP report, the wage metrics for job stayers eased to 5.2% from 5.4%, while for job changers it eased to 7.2% from 8.0%.
- The January Challenger Layoffs report saw a notable increase to 82k from 35k in December.
- The Initial Claims data for the week that coincides with the usual NFP survey window saw a notable decline to 189k from 203k, albeit the drop was likely related to the freezing weather in the US. The 4wk initial claims average over January rose to 208k from 203k in the prior week, but it does incorporate the steep weather-related drop, leaving it unchanged from the end of December 4wk average. The Continued Claims data for the NFP survey week, however, rose to 1.828mln from 1.806mln.
- The JOLTS data, albeit for December, was hotter than expected, rising to 9.026mln from 8.925mln (revised up from 8.79mln) although the quits rate was unchanged at 2.2%. Pantheon Macroeconomics writes the rebound in JOLTS does not matter as the data is volatile and subject to large revisions, however, the quits rate is more important as it signals slower wage gains.
- The Q4 Employment Costs Index eased to 0.9% from 1.1%, beneath the 1.0% forecast, also indicative of slowing wages. Employment wages within the report eased to 0.9% from 1.2%, while employment benefits eased to 0.7% from 0.9%.
ANNUAL REVISIONS: The report will see the incorporation of the 2023 revisions. Within the establishment survey, the BLS tells us that "nonfarm payroll employment, hours, and earnings data from the establishment survey will be revised to reflect the annual benchmark process and updated seasonal adjustment factors. Not seasonally adjusted data beginning with April 2022 and seasonally adjusted data beginning with January 2019 are subject to revision". Meanwhile, for the household survey, new population controls will be used in the estimation process which reflect the annual update of population estimates by the US Census Bureau. However, the BLS highlights, "In accordance with usual practice, historical data will not be revised to incorporate the new controls. Consequently, household survey data for January 2024 will not be directly comparable with data for December 2023 or earlier periods". Note, the US unemployment rate is derived from the household survey.
ARGUING FOR A STRONGER THAN EXPECTED REPORT:
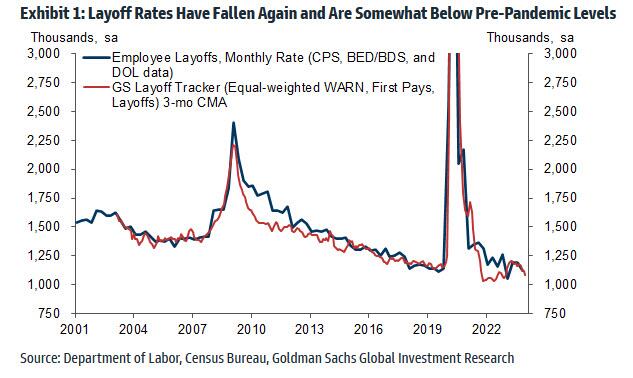
- Layoffs. Expect a boost from below-normal end-of-year layoffs on the order of 100k in tomorrow’s report. As shown in Exhibit 1, the Goldman layoff tracker indicates 1.1 million layoffs in January, a low level and a roughly 10% decline since mid-2023. The January payroll seasonals have started to evolve to reflect and offset the this post-pandemic trend, with a month-over-month hurdle for private payrolls of -2,584k in January 2023 compared to -2,773k in January 2019 (which was also a 4-week payroll month). However, even with this unfavorable evolution, nonfarm payrolls still rose by 436k month-over-month in January 2023—a 140k pickup relative to the 3-month average. Goldman's layoff tracker is 50k higher than it was last January, which would argue for a boost from low layoffs of around 90k this January, other things equal.
- Jobless claims. Initial jobless claims decreased to an average of 204k in the January payroll month, down from 212k in December and 225k on average in 2023. The JOLTS layoff rate was unchanged at low levels (1.0%) in December. Announced layoffs reported by Challenger, Gray & Christmas increased by 16k in January to 57k (SA by GS), compared to 54k on average in the second half of 2023.
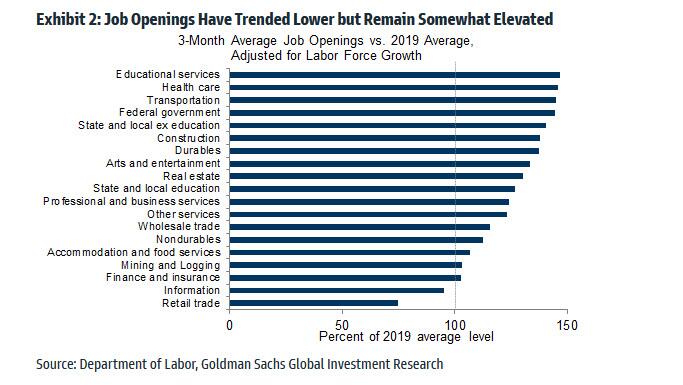
- Job availability. JOLTS job openings increased by 101k month-over-month to 9.0mn in December, well above consensus expectations, and online measures have declined slightly in recent months. While labor demand has fallen meaningfully on net, it remains elevated by 1-2 million relative to 2019 and represents a positive factor for job growth, in our view. Indeed, job openings remain above their 2019 levels in nearly every industry. Additionally, the Conference Board labor differential—the difference between the percent of respondents saying jobs are plentiful and those saying jobs are hard to get—increased by 8.4pt to +35.7 in January.
ARGUING FOR A WEAKER-THAN-EXPECTED REPORT
- Weather. Goldman assumes a 50k drag from cold, snowy weather during the survey week in the Midwest and Northeast. As shown below, the January increase in population-weighted snowfall (mom sa) argues for a drag in weather-sensitive industries such as construction, leisure, and retail—especially because good weather likely flattered the December employment report. While there are a wide range of outcomes for the weather drag, expect low layoff rates to offset or partially offset this headwind in the retail and leisure categories.

- Employer surveys. The employment components of business surveys were net weaker in January. The employment component of the GS manufacturing survey tracker declined 1.3pt to 47.5 while the employment component of the services survey tracker increased 0.2pt to 49.8. Both trackers remain below their 2018-2019 average levels of 55.3 and 56.6, respectively.
NEUTRAL/MIXED FACTORS:
- Big Data. Big Data employment indicators were mixed in January, with an average pace of +179k across the four indicators tracked by Goldman economists. This compares to the +150k median of these measures in December.
- Worker strikes. The return of 3k striking workers will boost payroll growth by that amount in tomorrow’s report. This compares to the 8k boost in last month’s report and a 38k boost in November.
FED IMPLICATIONS: The FOMC on Wednesday saw rates left unchanged and removed its tightening bias in the statement as expected, it also played down the prospects of near-term rate cuts with Powell explicitly saying a March cut is not likely. Money markets have pared back their implied probability of a rate cut for the March meeting to c. 35% from the 50%+ pricing pre-FOMC. The NFP report will help shape those expectations, where a surprise downside report for the labour market would support the case for a March cut but it is seen as increasingly unlikely. Barclays and Goldman Sachs have both pushed back their March rate cut calls since the FOMC to May, while BofA pushed back their rate cut call to June from March. Nonetheless, Fed Chair Powell said many times in his post-FOMC Presser/Q&A that the labor market remains strong, but he did warn of earlier rate cuts than expected if that were to change, "If we saw an unexpected weakening [in the labour market] that would certainly weigh on cutting sooner", how sooner remains to be seen, but March would still appear a possibility, providing the data supported it. When questioned on a March cut, Powell said, "I don’t think that’s...what we would call the base case", but he also didn't rule out the possibility. Powell pointed to the December SEPs - which saw three rate cuts in 2024 - "as good evidence of where people are", whilst saying that the "base case" assumes that "we have a strong labor market, we have inflation coming down, that’s what people are writing their SEP around". So, if the base case assumes continued disinflation progress and a strong labor market leading to three rate cuts this year - with March being too early for the first cut in that scenario - a weak labour market report that takes the Fed off that base case could be the key to putting March back in play for the Fed and a deeper cutting cycle than the Dec SEPs median forecast of three 25bp cuts, assuming disinflation continues as expected.
DATES AHEAD: The next FOMC is on March 19-20th. The January & February CPI reports are due on February 13th and March 12th, respectively, as well as the February jobs report due March 8th and the January PCE due February 29th. All will be key in determining the timing of the Fed's first rate cut and extrapolating the depth of cuts over the year, with the market still priced for nearly six 25bps cuts across the year.
MARKET REACTION: According to Goldman, while the S&P is less than 1% below ATHs, markets should still like a miss since it raises the chance of a cut (Reminder March Cut probability stands at 40%). The reaction should prove out to be more so asymmetric for equities as Powell was pretty unconcerned about upside growth, but acknowledged they will be quick to cut in a downside surprise scenario. Given that the market isn't really concerned about a bad growth outcome anymore, bad news tomorrow should be good for the market.
- 250k+ S&P sells off at least 50-75bps
- 200k – 250k S&P + / - 40bps
- 150k – 200 S&P +75bps-100bps
- 50 – 150k S&P -25bps / +50bps
The question, however, is what does Biden want: does he still believe that if he manipulates the data long and strong enough, the average American will finally give him credit for "Bidenomics." Alternatively, has Biden given up on the economy, and is he more focused on levitating stocks as a shortcut to gaining votes. The answer to those two questions will determine what number we get tomorrow.
More in the full payrolls preview folder available to pro subscribers.
Uncategorized
Economic Earthquake Ahead? The Cracks Are Spreading Fast
Economic Earthquake Ahead? The Cracks Are Spreading Fast
Authored by Brandon Smith via Alt-Market.us,
One of my favorite false narratives…
Share this:


Authored by Brandon Smith via Alt-Market.us,
One of my favorite false narratives floating around corporate media platforms has been the argument that the American people “just don’t seem to understand how good the economy really is right now.” If only they would look at the stats, they would realize that we are in the middle of a financial renaissance, right? It must be that people have been brainwashed by negative press from conservative sources…
I have to laugh at this notion because it’s a very common one throughout history – it’s an assertion made by almost every single political regime right before a major collapse. These people always say the same things, and when you study economics as long as I have you can’t help but throw up your hands and marvel at their dedication to the propaganda.
One example that comes to mind immediately is the delusional optimism of the “roaring” 1920s and the lead up to the Great Depression. At the time around 60% of the U.S. population was living in poverty conditions (according to the metrics of the decade) earning less than $2000 a year. However, in the years after WWI ravaged Europe, America’s economic power was considered unrivaled.
The 1920s was an era of mass production and rampant consumerism but it was all fueled by easy access to debt, a condition which had not really existed before in America. It was this illusion of prosperity created by the unchecked application of credit that eventually led to the massive stock market bubble and the crash of 1929. This implosion, along with the Federal Reserve’s policy of raising interest rates into economic weakness, created a black hole in the U.S. financial system for over a decade.
There are two primary tools that various failing regimes will often use to distort the true conditions of the economy: Debt and inflation. In the case of America today, we are experiencing BOTH problems simultaneously and this has made certain economic indicators appear healthy when they are, in fact, highly unstable. The average American knows this is the case because they see the effects everyday. They see the damage to their wallets, to their buying power, in the jobs market and in their quality of life. This is why public faith in the economy has been stuck in the dregs since 2021.
The establishment can flash out-of-context stats in people’s faces, but they can’t force the populace to see a recovery that simply does not exist. Let’s go through a short list of the most faulty indicators and the real reasons why the fiscal picture is not a rosy as the media would like us to believe…
The “miracle” labor market recovery
In the case of the U.S. labor market, we have a clear example of distortion through inflation. The $8 trillion+ dropped on the economy in the first 18 months of the pandemic response sent the system over the edge into stagflation land. Helicopter money has a habit of doing two things very well: Blowing up a bubble in stock markets and blowing up a bubble in retail. Hence, the massive rush by Americans to go out and buy, followed by the sudden labor shortage and the race to hire (mostly for low wage part-time jobs).
The problem with this “miracle” is that inflation leads to price explosions, which we have already experienced. The average American is spending around 30% more for goods, services and housing compared to what they were spending in 2020. This is what happens when you have too much money chasing too few goods and limited production.
The jobs market looks great on paper, but the majority of jobs generated in the past few years are jobs that returned after the covid lockdowns ended. The rest are jobs created through monetary stimulus and the artificial retail rush. Part time low wage service sector jobs are not going to keep the country rolling for very long in a stagflation environment. The question is, what happens now that the stimulus punch bowl has been removed?
Just as we witnessed in the 1920s, Americans have turned to debt to make up for higher prices and stagnant wages by maxing out their credit cards. With the central bank keeping interest rates high, the credit safety net will soon falter. This condition also goes for businesses; the same businesses that will jump headlong into mass layoffs when they realize the party is over. It happened during the Great Depression and it will happen again today.
Cracks in the foundation
We saw cracks in the narrative of the financial structure in 2023 with the banking crisis, and without the Federal Reserve backstop policy many more small and medium banks would have dropped dead. The weakness of U.S. banks is offset by the relative strength of the U.S. dollar, which lures in foreign investors hoping to protect their wealth using dollar denominated assets.
But something is amiss. Gold and bitcoin have rocketed higher along with economically sensitive assets and the dollar. This is the opposite of what’s supposed to happen. Gold and BTC are supposed to be hedges against a weak dollar and a weak economy, right? If global faith in the dollar and in the U.S. economy is so high, why are investors diving into protective assets like gold?
Again, as noted above, inflation distorts everything.
Tens of trillions of extra dollars printed by the Fed are floating around and it’s no surprise that much of that cash is flooding into the economy which simply pushes higher right along with prices on the shelf. But, gold and bitcoin are telling us a more honest story about what’s really happening.
Right now, the U.S. government is adding around $600 billion per month to the national debt as the Fed holds rates higher to fight inflation. This debt is going to crush America’s financial standing for global investors who will eventually ask HOW the U.S. is going to handle that growing millstone? As I predicted years ago, the Fed has created a perfect Catch-22 scenario in which the U.S. must either return to rampant inflation, or, face a debt crisis. In either case, U.S. dollar-denominated assets will lose their appeal and their prices will plummet.
“Healthy” GDP is a complete farce
GDP is the most common out-of-context stat used by governments to convince the citizenry that all is well. It is yet another stat that is entirely manipulated by inflation. It is also manipulated by the way in which modern governments define “economic activity.”
GDP is primarily driven by spending. Meaning, the higher inflation goes, the higher prices go, and the higher GDP climbs (to a point). Eventually prices go too high, credit cards tap out and spending ceases. But, for a short time inflation makes GDP (as well as retail sales) look good.
Another factor that creates a bubble is the fact that government spending is actually included in the calculation of GDP. That’s right, every dollar of your tax money that the government wastes helps the establishment by propping up GDP numbers. This is why government spending increases will never stop – It’s too valuable for them to spend as a way to make the economy appear healthier than it is.
The REAL economy is eclipsing the fake economy
The bottom line is that Americans used to be able to ignore the warning signs because their bank accounts were not being directly affected. This is over. Now, every person in the country is dealing with a massive decline in buying power and higher prices across the board on everything – from food and fuel to housing and financial assets alike. Even the wealthy are seeing a compression to their profit and many are struggling to keep their businesses in the black.
The unfortunate truth is that the elections of 2024 will probably be the turning point at which the whole edifice comes tumbling down. Even if the public votes for change, the system is already broken and cannot be repaired without a complete overhaul.
We have consistently avoided taking our medicine and our disease has gotten worse and worse.
People have lost faith in the economy because they have not faced this kind of uncertainty since the 1930s. Even the stagflation crisis of the 1970s will likely pale in comparison to what is about to happen. On the bright side, at least a large number of Americans are aware of the threat, as opposed to the 1920s when the vast majority of people were utterly conned by the government, the banks and the media into thinking all was well. Knowing is the first step to preparing.
The second step is securing your own financial future – that’s where physical precious metals can play a role. Diversifying your savings with inflation-resistant, uninflatable assets whose intrinsic value doesn’t rely on a counterparty’s promise to pay adds resilience to your savings. That’s the main reason physical gold and silver have been the safe haven store-of-value assets of choice for centuries (among both the elite and the everyday citizen).
* * *
As the world moves away from dollars and toward Central Bank Digital Currencies (CBDCs), is your 401(k) or IRA really safe? A smart and conservative move is to diversify into a physical gold IRA. That way your savings will be in something solid and enduring. Get your FREE info kit on Gold IRAs from Birch Gold Group. No strings attached, just peace of mind. Click here to secure your future today.
Uncategorized
Wendy’s teases new $3 offer for upcoming holiday
The Daylight Savings Time promotion slashes prices on breakfast.
Share this:


Daylight Savings Time, or the practice of advancing clocks an hour in the spring to maximize natural daylight, is a controversial practice because of the way it leaves many feeling off-sync and tired on the second Sunday in March when the change is made and one has one less hour to sleep in.
Despite annual "Abolish Daylight Savings Time" think pieces and online arguments that crop up with unwavering regularity, Daylight Savings in North America begins on March 10 this year.
Related: Coca-Cola has a new soda for Diet Coke fans
Tapping into some people's very vocal dislike of Daylight Savings Time, fast-food chain Wendy's (WEN) is launching a daylight savings promotion that is jokingly designed to make losing an hour of sleep less painful and encourage fans to order breakfast anyway.
Image source: Wendy's.
Promotion wants you to compensate for lost sleep with cheaper breakfast
As it is also meant to drive traffic to the Wendy's app, the promotion allows anyone who makes a purchase of $3 or more through the platform to get a free hot coffee, cold coffee or Frosty Cream Cold Brew.
More Food + Dining:
- Taco Bell menu tries new take on an American classic
- McDonald's menu goes big, brings back fan favorites (with a catch)
- The 10 best food stocks to buy now
Available during the Wendy's breakfast hours of 6 a.m. and 10:30 a.m. (which, naturally, will feel even earlier due to Daylight Savings), the deal also allows customers to buy any of its breakfast sandwiches for $3. Items like the Sausage, Egg and Cheese Biscuit, Breakfast Baconator and Maple Bacon Chicken Croissant normally range in price between $4.50 and $7.
The choice of the latter is quite wide since, in the years following the pandemic, Wendy's has made a concerted effort to expand its breakfast menu with a range of new sandwiches with egg in them and sweet items such as the French Toast Sticks. The goal was both to stand out from competitors with a wider breakfast menu and increase traffic to its stores during early-morning hours.
Wendy's deal comes after controversy over 'dynamic pricing'
But last month, the chain known for the square shape of its burger patties ignited controversy after saying that it wanted to introduce "dynamic pricing" in which the cost of many of the items on its menu will vary depending on the time of day. In an earnings call, chief executive Kirk Tanner said that electronic billboards would allow restaurants to display various deals and promotions during slower times in the early morning and late at night.
Outcry was swift and Wendy's ended up walking back its plans with words that they were "misconstrued" as an intent to surge prices during its most popular periods.
While the company issued a statement saying that any changes were meant as "discounts and value offers" during quiet periods rather than raised prices during busy ones, the reputational damage was already done since many saw the clarification as another way to obfuscate its pricing model.
"We said these menuboards would give us more flexibility to change the display of featured items," Wendy's said in its statement. "This was misconstrued in some media reports as an intent to raise prices when demand is highest at our restaurants."
The Daylight Savings Time promotion, in turn, is also a way to demonstrate the kinds of deals Wendy's wants to promote in its stores without putting up full-sized advertising or posters for what is only relevant for a few days.
Related: Veteran fund manager picks favorite stocks for 2024
stocks pandemicUncategorized
Inside The Most Ridiculous Jobs Report In Recent History: Record 1.2 Million Immigrant Jobs Added In One Month
Inside The Most Ridiculous Jobs Report In Recent History: Record 1.2 Million Immigrant Jobs Added In One Month
Last month we though that the…
Share this:


Last month we though that the January jobs report was the "most ridiculous in recent history" but, boy, were we wrong because this morning the Biden department of goalseeked propaganda (aka BLS) published the February jobs report, and holy crap was that something else. Even Goebbels would blush.
What happened? Let's take a closer look.
On the surface, it was (almost) another blockbuster jobs report, certainly one which nobody expected, or rather just one bank out of 76 expected. Starting at the top, the BLS reported that in February the US unexpectedly added 275K jobs, with just one research analyst (from Dai-Ichi Research) expecting a higher number.
Some context: after last month's record 4-sigma beat, today's print was "only" 3 sigma higher than estimates. Needless to say, two multiple sigma beats in a row used to only happen in the USSR... and now in the US, apparently.

Before we go any further, a quick note on what last month we said was "the most ridiculous jobs report in recent history": it appears the BLS read our comments and decided to stop beclowing itself. It did that by slashing last month's ridiculous print by over a third, and revising what was originally reported as a massive 353K beat to just 229K, a 124K revision, which was the biggest one-month negative revision in two years!

Of course, that does not mean that this month's jobs print won't be revised lower: it will be, and not just that month but every other month until the November election because that's the only tool left in the Biden admin's box: pretend the economic and jobs are strong, then revise them sharply lower the next month, something we pointed out first last summer and which has not failed to disappoint once.
In the past month the Biden department of goalseeking stuff higher before revising it lower, has revised the following data sharply lower:
— zerohedge (@zerohedge) August 30, 2023
- Jobs
- JOLTS
- New Home sales
- Housing Starts and Permits
- Industrial Production
- PCE and core PCE
To be fair, not every aspect of the jobs report was stellar (after all, the BLS had to give it some vague credibility). Take the unemployment rate, after flatlining between 3.4% and 3.8% for two years - and thus denying expectations from Sahm's Rule that a recession may have already started - in February the unemployment rate unexpectedly jumped to 3.9%, the highest since February 2022 (with Black unemployment spiking by 0.3% to 5.6%, an indicator which the Biden admin will quickly slam as widespread economic racism or something).

And then there were average hourly earnings, which after surging 0.6% MoM in January (since revised to 0.5%) and spooking markets that wage growth is so hot, the Fed will have no choice but to delay cuts, in February the number tumbled to just 0.1%, the lowest in two years...

... for one simple reason: last month's average wage surge had nothing to do with actual wages, and everything to do with the BLS estimate of hours worked (which is the denominator in the average wage calculation) which last month tumbled to just 34.1 (we were led to believe) the lowest since the covid pandemic...

... but has since been revised higher while the February print rose even more, to 34.3, hence why the latest average wage data was once again a product not of wages going up, but of how long Americans worked in any weekly period, in this case higher from 34.1 to 34.3, an increase which has a major impact on the average calculation.

While the above data points were examples of some latent weakness in the latest report, perhaps meant to give it a sheen of veracity, it was everything else in the report that was a problem starting with the BLS's latest choice of seasonal adjustments (after last month's wholesale revision), which have gone from merely laughable to full clownshow, as the following comparison between the monthly change in BLS and ADP payrolls shows. The trend is clear: the Biden admin numbers are now clearly rising even as the impartial ADP (which directly logs employment numbers at the company level and is far more accurate), shows an accelerating slowdown.

But it's more than just the Biden admin hanging its "success" on seasonal adjustments: when one digs deeper inside the jobs report, all sorts of ugly things emerge... such as the growing unprecedented divergence between the Establishment (payrolls) survey and much more accurate Household (actual employment) survey. To wit, while in January the BLS claims 275K payrolls were added, the Household survey found that the number of actually employed workers dropped for the third straight month (and 4 in the past 5), this time by 184K (from 161.152K to 160.968K).

This means that while the Payrolls series hits new all time highs every month since December 2020 (when according to the BLS the US had its last month of payrolls losses), the level of Employment has not budged in the past year. Worse, as shown in the chart below, such a gaping divergence has opened between the two series in the past 4 years, that the number of Employed workers would need to soar by 9 million (!) to catch up to what Payrolls claims is the employment situation.

There's more: shifting from a quantitative to a qualitative assessment, reveals just how ugly the composition of "new jobs" has been. Consider this: the BLS reports that in February 2024, the US had 132.9 million full-time jobs and 27.9 million part-time jobs. Well, that's great... until you look back one year and find that in February 2023 the US had 133.2 million full-time jobs, or more than it does one year later! And yes, all the job growth since then has been in part-time jobs, which have increased by 921K since February 2023 (from 27.020 million to 27.941 million).

Here is a summary of the labor composition in the past year: all the new jobs have been part-time jobs!

But wait there's even more, because now that the primary season is over and we enter the heart of election season and political talking points will be thrown around left and right, especially in the context of the immigration crisis created intentionally by the Biden administration which is hoping to import millions of new Democratic voters (maybe the US can hold the presidential election in Honduras or Guatemala, after all it is their citizens that will be illegally casting the key votes in November), what we find is that in February, the number of native-born workers tumbled again, sliding by a massive 560K to just 129.807 million. Add to this the December data, and we get a near-record 2.4 million plunge in native-born workers in just the past 3 months (only the covid crash was worse)!

The offset? A record 1.2 million foreign-born (read immigrants, both legal and illegal but mostly illegal) workers added in February!

Said otherwise, not only has all job creation in the past 6 years has been exclusively for foreign-born workers...

... but there has been zero job-creation for native born workers since June 2018!

This is a huge issue - especially at a time of an illegal alien flood at the southwest border...

... and is about to become a huge political scandal, because once the inevitable recession finally hits, there will be millions of furious unemployed Americans demanding a more accurate explanation for what happened - i.e., the illegal immigration floodgates that were opened by the Biden admin.
Which is also why Biden's handlers will do everything in their power to insure there is no official recession before November... and why after the election is over, all economic hell will finally break loose. Until then, however, expect the jobs numbers to get even more ridiculous.


Wendy’s has a new deal for daylight savings time haters


Watch Live: President Biden Reminds Americans Just How Good They’ve Got It Thanks To Him


Watch: President Biden Delivers The “Darkest, Most Un-American Speech Given By A President”


These Are The 5 Charts The FDIC Does Not Want You Paying Attention To


Interest rates, the best it gets. It’s time to deploy cash


Is the biotech market rally real? Data suggest comeback in private, public markets


People Who Received Ivermectin Were Better Off, Study Finds


Stock Market’s Top Will Outlast Your Disbelief


COVID-19 May Lead To Persistent Cognitive Impairment, Brain Fog, And Lower IQ Scores


Normalise the underlying conditions when “rating” a company’s share price
-

 Uncategorized2 weeks ago
All Of The Elements Are In Place For An Economic Crisis Of Staggering Proportions
-

 Uncategorized1 month ago
Cathie Wood sells a major tech stock (again)
-

 Uncategorized3 weeks ago
California Counties Could Be Forced To Pay $300 Million To Cover COVID-Era Program
-

 Uncategorized2 weeks ago
Apparel Retailer Express Moving Toward Bankruptcy
-

 Uncategorized3 weeks ago
Industrial Production Decreased 0.1% in January
-

 International6 hours ago
Walmart launches clever answer to Target’s new membership program
-

 International1 month ago
War Delirium
-

 Uncategorized3 weeks ago
RFK Jr: The Wuhan Cover-Up & The Rise Of The Biowarfare-Industrial Complex