Government
Is the Phillips Curve Back?
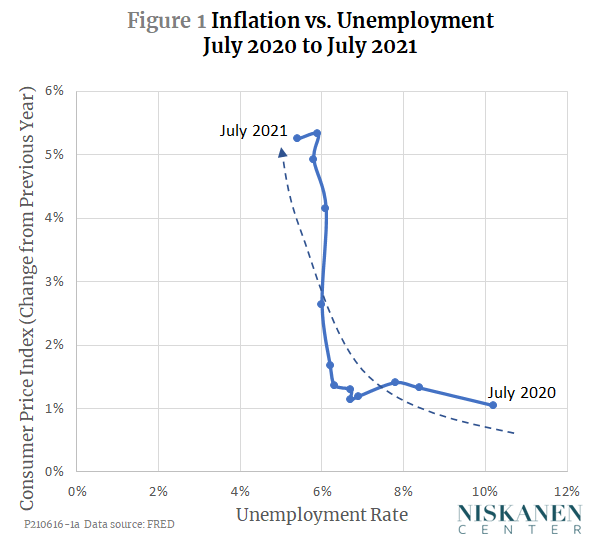
Anyone who has been following the U.S. monthly economic data lately has noticed that the rate of inflation has been rising over the past year as the unemployment rate has fallen. Figure 1 shows the numbers: To those old enough to remember, this chart…
Share this:

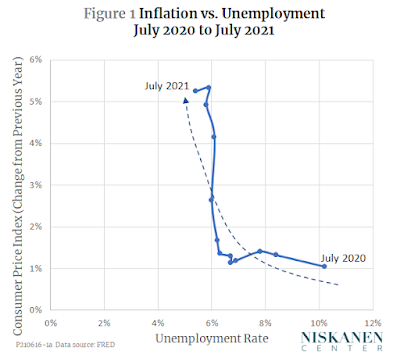
Anyone who has been following the U.S. monthly economic data lately has noticed that the rate of inflation has been rising over the past year as the unemployment rate has fallen. Figure 1 shows the numbers:
To those old enough to remember, this chart looks ominously like the first inflationary surge of the Kennedy-Johnson years:

Or even more ominously, Figure 1 looks a bit like this chart from a 1958 article by A. W. Phillips, which later became famous as the “Phillips curve.”

So, are we in for runaway inflation unless we slam on the brakes and send unemployment soaring again? You might think so from the headlines inspired by recent CPI reports, but the answer is “no,” or at least, “no time soon.”
To see why, we need to understand just what the dreaded Phillips curve is, why falling unemployment brought soaring inflation in the 1960s and 1970s, and why it is far less likely to do so now. That will require a detour into a bit of economic theory, then a review of the history of inflation and unemployment over the past six decades, and then an analysis of the psychological underpinnings of economic behavior. Here we go.
The dynamics of the Phillips curve
When the Phillips curve first came to widespread attention in the late 1950s and early 1960s, it was interpreted by many as a static policy menu. You could get unemployment down to a very low level if you were willing to tolerate a bit of inflation, or you could stop inflation in its tracks if you were willing to tolerate a bit more unemployment. By the late 1960s, however, the idea of a fixed Phillips menu was called into question by Milton Friedman and Edmund Phelps. In their view, the inverse relationship between inflation and unemployment was only a short-run phenomenon. In the long run, the Phillips curve could shift up or down under the influence of changing inflation expectations. The next two figures contrast the simple, static Phillips curve with its dynamic version.
Figure 4 shows the simple, static version of the Phillips curve. The vertical black line in the figure represents the so-called natural rate of unemployment,that is, the rate that prevails when the economy is neither in an unsustainable boom nor in a slump, and when there is neither upward nor downward pressure on the rate of inflation.

Suppose that initially, the economy is at Point A and has been there long enough that everyone has come to expect that situation as normal. Next, suppose there is a temporary surge in the aggregate demand for all goods and services, caused by expansionary monetary or fiscal policy. Employers will respond to the surge in demand either by increasing their output or increasing their prices, or (most likely) some combination of the two. To increase their output, firms will need more workers. As more jobs open up, unemployed workers, whether new entrants or those who are between jobs, will be able to find work more quickly than usual. Shorter average spells of unemployment reduce the unemployment rate, which is the ratio of unemployed workers to the size of the labor force, both employed and unemployed. As firms increase their output and prices, and as previously unemployed workers find jobs more quickly, the economy will move up and to the left along the Phillips curve toward Point B.
So far, we have assumed that the increase in demand is only temporary. If so, as soon as the surge in demand has run its course, the whole process will reverse and the economy will move back down along the Phillips curve to Point A. But the key insight of Friedman and Phelps was that the dynamics of prices and employment change when movements in aggregate demand are no longer temporary and unexpected. Figure 5 shows how that works.

This time, suppose that after the economy moves from A to B, aggregate demand continues to increase rather than falling back to its original level. As time goes by, both firms and workers find that the conditions that brought them to point B, where inflation is 4 percent and unemployment is 2 percent, are not sustainable. Workers will see that the previous year’s inflation has eroded their cost of living. Employers will find that prices of nonlabor inputs (which, after all, are just the outputs of other firms) have gone up, eroding their profits. Encouraged by the ongoing growth of demand, however, firms find they can maintain a high rate of output and raise their prices by enough to make up both for the higher wages that workers ask for and the higher costs of inputs. As a result, the economy moves from B to C.
In effect, once firms and workers come to expect the 4 percent inflation experienced at Point B, the whole short-run Phillips curve shifts up from SRP1 to SRP2. But once the economy reaches Point C, inflation expectations rise still more, pushing the short-run Phillips curve further upward to a position like SRP3. As long as policymakers keep boosting the rate of growth of aggregate demand with expansionary monetary and fiscal policy, unemployment can be kept low, but only at the expense of ever-faster inflation.
Suppose, though, that at the moment the economy reaches Point C, the Fed, deciding that inflation is too high to tolerate, raises interest rates enough to stop the upward drift of the Phillips curve. That will take away the incentive for firms to maintain output and employment at such a high level. The economy will begin to move down and to the right along the short-run Phillips curve SRP3. If demand remains constrained, the economy will move past the natural-rate-of-unemployment, represented by point D, to a point like E.
Once unemployment is above the natural rate, the dynamics of the system will reverse. With demand weaker, firms will slow the rate at which they raise prices and wages. Workers, seeing that jobs are hard to find, will not demand such generous wage increases. The short-run Phillips curve will begin to move down again, and the economy will move toward a point like F, with high unemployment but a falling rate of inflation. From there, if policymakers get the timing right, they can give just the nudge to aggregate demand that is needed to move the economy back to a soft landing at Point A, where we started.
In short, in the dynamic version of the model, the long-run Phillips curve is a vertical line at the natural level of unemployment. In the long run, unemployment cannot be held far above or far below its natural level at any constant rate of inflation. But as the rate of aggregate demand rises and falls over time, the economy does not move smoothly up and down along the long-run Phillips curve. Instead, it makes a series of clockwise loops, with periods of low unemployment and accelerating inflation balanced by periods of higher unemployment and slowing inflation.
The stop-go era
Simple though it is, the shifting Phillips curve model corresponds remarkably well to the actual behavior of the U.S. economy from the 1960s through the early 1990s. As shown in Figure 6, over that period, the economy traced a series of clockwise loops that look much like the stylized version shown in Figure 5.

This behavior of the economy has been described as a “stop-go” cycle because it reflects alternating episodes of expansionary and contractionary monetary and fiscal policy. The first two loops show that in the 1960s and 1970s, there was an upward bias to the cycle. Policymakers were slow to apply the brakes as the cycles approached their peaks, and quick to accelerate again well before inflation had fallen back to the rate it started from. Because the average rate of inflation and average rate of unemployment both increased from cycle to cycle, this pattern was sometimes called “stagflation” – a term I have never liked, since “stagnation” seems to imply that the economy was standing still, when instead it was looping crazily out of control.
Not until the appointment of Paul Volcker as Federal Reserve Chair by President Carter in 1979, and the subsequent election of Ronald Reagan, were the deceleration phases of the cycles carried through strongly enough to bring inflation below the rates of 1972 and 1976, years when the process of disinflation was abandoned before it was complete.
From Stop-Go to the Great Moderation and the Great Recession
Just as it seemed that the stop-go cycle and the shifting Phillips curve model might become permanent features of the U.S. economy, the picture changed dramatically. As Figure 7 shows, from the early 1990s to late 2007, the U.S. economy entered a phase that became known as the Great Moderation. During that period, inflation moved within a remarkably narrow range, never more than 3.4 percent or less than 1.5 percent. The unemployment rate was similarly constrained, ranging from slightly under 4 to barely over 6 percent. The economy had never before (or since) come so close to the goal of simultaneous full employment and price stability.

The Great Recession, which officially began in late 2007 and deepened dramatically during the financial crisis of 2008, brought the Great Moderation to an end. Unemployment reached a monthly peak of 10 percent in October 2009. Inflation, however, remained within a narrow range even in 2018 and 2019, when the unemployment rate fell below 4 percent for the first time since the mid-1960s.
The role of expectations
The patterns of inflation and unemployment in Figure 7 differ from those in Figure 6 not only in their limited range, but also in their dynamics. Whereas the stop-go era was characterized by a series of clockwise loops, that pattern disappeared after the early 1990s. To the extent there is any regularity at all to the squiggles in Figure 7, they look like a pair of blue and red bow ties. Note especially that the right-hand sides of each bow tie trace out counterclockwise loops – a pattern that is fundamentally inconsistent with both the observations shown in Figure 6 and with the theory of the shifting Phillips curve that was represented in Figure 5. What happened?
The answer is that there was a change in the way that firms and workers formed their expectations of inflation. The Friedman-Phelps shifting Phillips curve model is based on what economists call adaptive expectations. That means that market participants form their expectations of future inflation on the basis of what they have observed in the recent past. Figure 5 assumes a very simple form of adaptive expectations in which each year’s short-run Phillips curve intersects the long-run Phillips curve at that year’s expected rate of inflation, and each year’s expected rate of inflation is equal to the previous year’s observed rate of inflation.
In contrast, the behavior of the economy since the early 1990s reflects anchored expectations. In this period, the Fed avoided abrupt, unexpected policy changes, and was very explicit about doing so. The resulting “anchor,” then, was the Fed’s clearly communicated intention to hold inflation at or close to a target rate of 2 percent, come what may.
With the expected rate of inflation anchored at 2 percent, the Phillips curve stopped shifting. Subject to small random shocks, and with some lags, the economy moved within a narrow range of inflation and unemployment. In that regard, the outcome was more like what would be expected with a fixed Phillips curve like the one in Figure 4. In fact, it could be said that expectations were anchored strongly enough that the short-run Phillips curve itself became flatter, so that even large variations in unemployment, such as those observed during the Great Recession, did not cause comparably large variations in inflation.
Former Federal Reserve Chair Ben Bernanke summed the point up nicely in a 2007 speech to a workshop at the National Bureau of Economic Research:
The extent to which [inflation expectations] are anchored can change, depending on economic developments and (most important) the current and past conduct of monetary policy. In this context, I use the term “anchored” to mean relatively insensitive to incoming data. So, for example, if the public experiences a spell of inflation higher than their long-run expectation, but their long-run expectation of inflation changes little as a result, then inflation expectations are well anchored. If, on the other hand, the public reacts to a short period of higher-than-expected inflation by marking up their long-run expectation considerably, then expectations are poorly anchored.
What lies ahead and what to watch
Bernanke’s remarks tell us what we need to know to answer the questions we began with: Is the Phillips curve back? And when should we start to worry about inflation?
The answer is that the shifting Phillips curve is not back, nor do we need to worry about inflation, so long as inflation expectations remain anchored. As long as they do, we may well see some increases in the price level as the economy recovers from the pandemic, but those are likely to remain transitory. And expectations will remain anchored, as long as employers, workers, and financial markets remain confident that policymakers are serious about holding the average inflation over an appropriate time horizon to a target level within a percentage point or so of the 2 percent that we have become accustomed to over the last three decades.
“Anchored” does not mean that the Fed has to be ready to stomp on the brakes at the first sign that monthly CPI figures go above 2 percent. The Fed has made it clear that it will allow some catch-up relative to the very low inflation rates of 2020. We can also expect it to disregard transitory blips in the CPI caused by things like the recent jump in used-car prices. In fact, the Fed pays little attention at all to the headline-making CPI, preferring to look at other indicators that better reflect underlying inflation trends.
So, can we go to bed at night, sure that all is well? Not quite. Even if the Fed is determined to do the right thing, it is going to be technically hard for it to provide just the right degree of stimulus or constraint over the coming months. The United States has not experienced an economic shock like the pandemic for many decades. Among other things, that means that the Fed’s models and forecasts may not be accurately calibrated for what is happening right now.
Furthermore, in an ideal world, the Fed would not have to do the whole job of managing inflation and unemployment by itself. Economic textbooks tell us that policymakers are best able to guide the evolution of aggregate demand when they have two levers to pull: monetary policy and fiscal policy. Unfortunately, U.S. fiscal policy is politicized and paralyzed. Congress is as likely to do the wrong thing – too much fiscal stimulus, or too much austerity, or first the one and then the other – as it is to behave prudently. That will make the Fed’s job harder.
But even the kind of bungled fiscal policy that complicated the recovery from the Great Recession is unlikely to lead to anything resembling the kind of stop-go instability that we saw in the 1960s and 1970s. Not, at least, if expectations remain anchored.
Previously posted by Niskanen Center. Figure 1 has been updated for this repost.
recession economic shock unemployment pandemic stimulus monetary policy fed federal reserve congress recession recovery interest rates unemployment stimulusGovernment
Are Voters Recoiling Against Disorder?
Are Voters Recoiling Against Disorder?
Authored by Michael Barone via The Epoch Times (emphasis ours),
The headlines coming out of the Super…
Share this:


Authored by Michael Barone via The Epoch Times (emphasis ours),
The headlines coming out of the Super Tuesday primaries have got it right. Barring cataclysmic changes, Donald Trump and Joe Biden will be the Republican and Democratic nominees for president in 2024.
With Nikki Haley’s withdrawal, there will be no more significantly contested primaries or caucuses—the earliest both parties’ races have been over since something like the current primary-dominated system was put in place in 1972.
The primary results have spotlighted some of both nominees’ weaknesses.
Donald Trump lost high-income, high-educated constituencies, including the entire metro area—aka the Swamp. Many but by no means all Haley votes there were cast by Biden Democrats. Mr. Trump can’t afford to lose too many of the others in target states like Pennsylvania and Michigan.
Majorities and large minorities of voters in overwhelmingly Latino counties in Texas’s Rio Grande Valley and some in Houston voted against Joe Biden, and even more against Senate nominee Rep. Colin Allred (D-Texas).
Returns from Hispanic precincts in New Hampshire and Massachusetts show the same thing. Mr. Biden can’t afford to lose too many Latino votes in target states like Arizona and Georgia.
When Mr. Trump rode down that escalator in 2015, commentators assumed he’d repel Latinos. Instead, Latino voters nationally, and especially the closest eyewitnesses of Biden’s open-border policy, have been trending heavily Republican.
High-income liberal Democrats may sport lawn signs proclaiming, “In this house, we believe ... no human is illegal.” The logical consequence of that belief is an open border. But modest-income folks in border counties know that flows of illegal immigrants result in disorder, disease, and crime.
There is plenty of impatience with increased disorder in election returns below the presidential level. Consider Los Angeles County, America’s largest county, with nearly 10 million people, more people than 40 of the 50 states. It voted 71 percent for Mr. Biden in 2020.
Current returns show county District Attorney George Gascon winning only 21 percent of the vote in the nonpartisan primary. He’ll apparently face Republican Nathan Hochman, a critic of his liberal policies, in November.
Gascon, elected after the May 2020 death of counterfeit-passing suspect George Floyd in Minneapolis, is one of many county prosecutors supported by billionaire George Soros. His policies include not charging juveniles as adults, not seeking higher penalties for gang membership or use of firearms, and bringing fewer misdemeanor cases.
The predictable result has been increased car thefts, burglaries, and personal robberies. Some 120 assistant district attorneys have left the office, and there’s a backlog of 10,000 unprosecuted cases.
More than a dozen other Soros-backed and similarly liberal prosecutors have faced strong opposition or have left office.
St. Louis prosecutor Kim Gardner resigned last May amid lawsuits seeking her removal, Milwaukee’s John Chisholm retired in January, and Baltimore’s Marilyn Mosby was defeated in July 2022 and convicted of perjury in September 2023. Last November, Loudoun County, Virginia, voters (62 percent Biden) ousted liberal Buta Biberaj, who declined to prosecute a transgender student for assault, and in June 2022 voters in San Francisco (85 percent Biden) recalled famed radical Chesa Boudin.
Similarly, this Tuesday, voters in San Francisco passed ballot measures strengthening police powers and requiring treatment of drug-addicted welfare recipients.
In retrospect, it appears the Floyd video, appearing after three months of COVID-19 confinement, sparked a frenzied, even crazed reaction, especially among the highly educated and articulate. One fatal incident was seen as proof that America’s “systemic racism” was worse than ever and that police forces should be defunded and perhaps abolished.
2020 was “the year America went crazy,” I wrote in January 2021, a year in which police funding was actually cut by Democrats in New York, Los Angeles, San Francisco, Seattle, and Denver. A year in which young New York Times (NYT) staffers claimed they were endangered by the publication of Sen. Tom Cotton’s (R-Ark.) opinion article advocating calling in military forces if necessary to stop rioting, as had been done in Detroit in 1967 and Los Angeles in 1992. A craven NYT publisher even fired the editorial page editor for running the article.
Evidence of visible and tangible discontent with increasing violence and its consequences—barren and locked shelves in Manhattan chain drugstores, skyrocketing carjackings in Washington, D.C.—is as unmistakable in polls and election results as it is in daily life in large metropolitan areas. Maybe 2024 will turn out to be the year even liberal America stopped acting crazy.
Chaos and disorder work against incumbents, as they did in 1968 when Democrats saw their party’s popular vote fall from 61 percent to 43 percent.
Views expressed in this article are opinions of the author and do not necessarily reflect the views of The Epoch Times or ZeroHedge.
Government
Veterans Affairs Kept COVID-19 Vaccine Mandate In Place Without Evidence
Veterans Affairs Kept COVID-19 Vaccine Mandate In Place Without Evidence
Authored by Zachary Stieber via The Epoch Times (emphasis ours),
The…
Share this:

Authored by Zachary Stieber via The Epoch Times (emphasis ours),
The U.S. Department of Veterans Affairs (VA) reviewed no data when deciding in 2023 to keep its COVID-19 vaccine mandate in place.
VA Secretary Denis McDonough said on May 1, 2023, that the end of many other federal mandates “will not impact current policies at the Department of Veterans Affairs.”
He said the mandate was remaining for VA health care personnel “to ensure the safety of veterans and our colleagues.”
Mr. McDonough did not cite any studies or other data. A VA spokesperson declined to provide any data that was reviewed when deciding not to rescind the mandate. The Epoch Times submitted a Freedom of Information Act for “all documents outlining which data was relied upon when establishing the mandate when deciding to keep the mandate in place.”
The agency searched for such data and did not find any.
“The VA does not even attempt to justify its policies with science, because it can’t,” Leslie Manookian, president and founder of the Health Freedom Defense Fund, told The Epoch Times.
“The VA just trusts that the process and cost of challenging its unfounded policies is so onerous, most people are dissuaded from even trying,” she added.
The VA’s mandate remains in place to this day.
The VA’s website claims that vaccines “help protect you from getting severe illness” and “offer good protection against most COVID-19 variants,” pointing in part to observational data from the U.S. Centers for Disease Control and Prevention (CDC) that estimate the vaccines provide poor protection against symptomatic infection and transient shielding against hospitalization.
There have also been increasing concerns among outside scientists about confirmed side effects like heart inflammation—the VA hid a safety signal it detected for the inflammation—and possible side effects such as tinnitus, which shift the benefit-risk calculus.
President Joe Biden imposed a slate of COVID-19 vaccine mandates in 2021. The VA was the first federal agency to implement a mandate.
President Biden rescinded the mandates in May 2023, citing a drop in COVID-19 cases and hospitalizations. His administration maintains the choice to require vaccines was the right one and saved lives.
“Our administration’s vaccination requirements helped ensure the safety of workers in critical workforces including those in the healthcare and education sectors, protecting themselves and the populations they serve, and strengthening their ability to provide services without disruptions to operations,” the White House said.
Some experts said requiring vaccination meant many younger people were forced to get a vaccine despite the risks potentially outweighing the benefits, leaving fewer doses for older adults.
“By mandating the vaccines to younger people and those with natural immunity from having had COVID, older people in the U.S. and other countries did not have access to them, and many people might have died because of that,” Martin Kulldorff, a professor of medicine on leave from Harvard Medical School, told The Epoch Times previously.
The VA was one of just a handful of agencies to keep its mandate in place following the removal of many federal mandates.
“At this time, the vaccine requirement will remain in effect for VA health care personnel, including VA psychologists, pharmacists, social workers, nursing assistants, physical therapists, respiratory therapists, peer specialists, medical support assistants, engineers, housekeepers, and other clinical, administrative, and infrastructure support employees,” Mr. McDonough wrote to VA employees at the time.
“This also includes VA volunteers and contractors. Effectively, this means that any Veterans Health Administration (VHA) employee, volunteer, or contractor who works in VHA facilities, visits VHA facilities, or provides direct care to those we serve will still be subject to the vaccine requirement at this time,” he said. “We continue to monitor and discuss this requirement, and we will provide more information about the vaccination requirements for VA health care employees soon. As always, we will process requests for vaccination exceptions in accordance with applicable laws, regulations, and policies.”
The version of the shots cleared in the fall of 2022, and available through the fall of 2023, did not have any clinical trial data supporting them.
A new version was approved in the fall of 2023 because there were indications that the shots not only offered temporary protection but also that the level of protection was lower than what was observed during earlier stages of the pandemic.
Ms. Manookian, whose group has challenged several of the federal mandates, said that the mandate “illustrates the dangers of the administrative state and how these federal agencies have become a law unto themselves.”
Government
Low Iron Levels In Blood Could Trigger Long COVID: Study
Low Iron Levels In Blood Could Trigger Long COVID: Study
Authored by Amie Dahnke via The Epoch Times (emphasis ours),
People with inadequate…
Share this:


Authored by Amie Dahnke via The Epoch Times (emphasis ours),
People with inadequate iron levels in their blood due to a COVID-19 infection could be at greater risk of long COVID.
A new study indicates that problems with iron levels in the bloodstream likely trigger chronic inflammation and other conditions associated with the post-COVID phenomenon. The findings, published on March 1 in Nature Immunology, could offer new ways to treat or prevent the condition.
Long COVID Patients Have Low Iron Levels
Researchers at the University of Cambridge pinpointed low iron as a potential link to long-COVID symptoms thanks to a study they initiated shortly after the start of the pandemic. They recruited people who tested positive for the virus to provide blood samples for analysis over a year, which allowed the researchers to look for post-infection changes in the blood. The researchers looked at 214 samples and found that 45 percent of patients reported symptoms of long COVID that lasted between three and 10 months.
In analyzing the blood samples, the research team noticed that people experiencing long COVID had low iron levels, contributing to anemia and low red blood cell production, just two weeks after they were diagnosed with COVID-19. This was true for patients regardless of age, sex, or the initial severity of their infection.
According to one of the study co-authors, the removal of iron from the bloodstream is a natural process and defense mechanism of the body.
But it can jeopardize a person’s recovery.
“When the body has an infection, it responds by removing iron from the bloodstream. This protects us from potentially lethal bacteria that capture the iron in the bloodstream and grow rapidly. It’s an evolutionary response that redistributes iron in the body, and the blood plasma becomes an iron desert,” University of Oxford professor Hal Drakesmith said in a press release. “However, if this goes on for a long time, there is less iron for red blood cells, so oxygen is transported less efficiently affecting metabolism and energy production, and for white blood cells, which need iron to work properly. The protective mechanism ends up becoming a problem.”
The research team believes that consistently low iron levels could explain why individuals with long COVID continue to experience fatigue and difficulty exercising. As such, the researchers suggested iron supplementation to help regulate and prevent the often debilitating symptoms associated with long COVID.
“It isn’t necessarily the case that individuals don’t have enough iron in their body, it’s just that it’s trapped in the wrong place,” Aimee Hanson, a postdoctoral researcher at the University of Cambridge who worked on the study, said in the press release. “What we need is a way to remobilize the iron and pull it back into the bloodstream, where it becomes more useful to the red blood cells.”
The research team pointed out that iron supplementation isn’t always straightforward. Achieving the right level of iron varies from person to person. Too much iron can cause stomach issues, ranging from constipation, nausea, and abdominal pain to gastritis and gastric lesions.
1 in 5 Still Affected by Long COVID
COVID-19 has affected nearly 40 percent of Americans, with one in five of those still suffering from symptoms of long COVID, according to the U.S. Centers for Disease Control and Prevention (CDC). Long COVID is marked by health issues that continue at least four weeks after an individual was initially diagnosed with COVID-19. Symptoms can last for days, weeks, months, or years and may include fatigue, cough or chest pain, headache, brain fog, depression or anxiety, digestive issues, and joint or muscle pain.


Veterans Affairs Kept COVID-19 Vaccine Mandate In Place Without Evidence


When Military Rule Supplants Democracy


The Digest #187


Redefining Poverty: Towards a Transpartisan Approach


Students lose out as cities and states give billions in property tax breaks to businesses − draining school budgets and especially hurting the poorest students


Is the United States overestimating China’s power?


Biden to call for first-time homebuyer tax credit, construction of 2 million homes


GBPINR: Analysis and Projections for 2024


Low Iron Levels In Blood Could Trigger Long COVID: Study


Biden defends immigration policy during State of the Union, blaming Republicans in Congress for refusing to act
-

 Uncategorized2 weeks ago
All Of The Elements Are In Place For An Economic Crisis Of Staggering Proportions
-

 Uncategorized1 month ago
Cathie Wood sells a major tech stock (again)
-

 Uncategorized3 weeks ago
California Counties Could Be Forced To Pay $300 Million To Cover COVID-Era Program
-

 Uncategorized2 weeks ago
Apparel Retailer Express Moving Toward Bankruptcy
-

 Uncategorized3 weeks ago
Industrial Production Decreased 0.1% in January
-

 International2 days ago
Walmart launches clever answer to Target’s new membership program
-

 Uncategorized3 weeks ago
RFK Jr: The Wuhan Cover-Up & The Rise Of The Biowarfare-Industrial Complex
-

 International2 days ago
EyePoint poaches medical chief from Apellis; Sandoz CFO, longtime BioNTech exec to retire