Spread & Containment
How Has Treasury Market Liquidity Evolved in 2023?
In a 2022 post, we showed how liquidity conditions in the U.S. Treasury securities market had worsened as supply disruptions, high inflation, and geopolitical…
Share this:

In a 2022 post, we showed how liquidity conditions in the U.S. Treasury securities market had worsened as supply disruptions, high inflation, and geopolitical conflict increased uncertainty about the expected path of interest rates. In this post, we revisit some commonly used metrics to assess how market liquidity has evolved since. We find that liquidity worsened abruptly In March 2023 after the failures of Silicon Valley Bank and Signature Bank, but then quickly improved to levels close to those of the preceding year. As in 2022, liquidity in 2023 continues to closely track the level that would be expected by the path of interest rate volatility.
Importance of Treasury Market Liquidity
The U.S. Treasury securities market is the largest and most liquid government securities market in the world, with more than $25 trillion in marketable debt outstanding (as of August 31, 2023). The securities are used by the Treasury Department to finance the U.S. government, by countless financial institutions to manage interest rate risk and price other financial instruments, and by the Federal Reserve in implementing monetary policy. Having a liquid market is important for all of these purposes and thus of concern to market participants and policymakers alike.
Measuring Liquidity
Liquidity often refers to the cost of quickly converting an asset into cash (or vice versa) and is measured in various ways. We look at three commonly used measures, estimated using high-frequency data from the interdealer market: the bid-ask spread, order book depth, and price impact. The measures are estimated for the most recently auctioned (on-the-run) two-, five-, and ten-year notes (the three most actively traded Treasury securities, as shown in this Liberty Street Economics post), and are calculated for New York trading hours (defined as 7 a.m. to 5 p.m.).
Market Liquidity Worsened in March 2023
The bid-ask spread—the difference between the lowest ask price and the highest bid price for a security—is one of the most popular liquidity measures. As shown in the chart below, bid-ask spreads widened abruptly after the failures of Silicon Valley Bank (March 10) and Signature Bank (March 13), suggesting reduced liquidity. For the two-year note, spreads exceeded those observed during the COVID-related disruptions of March 2020 (examined in this Liberty Street Economics post). Spreads then narrowed over the subsequent month or so to levels close to those of the preceding year but remained somewhat elevated for the two-year note.
Bid-Ask Spreads Widened in March 2023

Source: Author’s calculations, based on data from BrokerTec.
Notes: The chart plots five-day moving averages of average daily bid-ask spreads for the on-the-run two-, five-, and ten-year notes in the interdealer market from September 1, 2019 to September 30, 2023. Spreads are measured in 32nds of a point, where a point equals one percent of par.
The next chart plots order book depth, measured as the average quantity of securities available for sale or purchase at the best bid and offer prices. This metric again points to relatively poor liquidity in March 2023, as the available depth declined precipitously. Depth in the five-year note was at levels commensurate with those of March 2020, whereas depth in the two-year note was appreciably lower—and depth in the ten-year note appreciably higher—than the levels of March 2020. Within about a month, depth for all three notes was back to levels similar to those of the preceding year.
Order Book Depth Plunged in March 2023

Source: Author’s calculations, based on data from BrokerTec.
Notes: This chart plots five-day moving averages of average daily depth for the on-the-run two-, five-, and ten-year notes in the interdealer market from September 1, 2019 to September 30, 2023. Data are for order book depth at the inside tier, averaged across the bid and offer sides. Depth is measured in millions of U.S. dollars par and plotted on a logarithmic scale.
Measures of the price impact of trades also suggest a notable deterioration of liquidity. The next chart plots the estimated price impact per $100 million in net order flow (defined as buyer-initiated trading volume less seller-initiated trading volume). A higher price impact suggests reduced liquidity. Price impact for the two-year note rose sharply in March 2023 to a level about twice as high as at its March 2020 peak, and then within a month or so returned to levels comparable to those of the preceding year. Price impact for the five-and ten-year notes rose more modestly in March.
Price Impact Rose in March 2023

Source: Author’s calculations, based on data from BrokerTec.
Notes: The chart plots five-day moving averages of slope coefficients from daily regressions of one-minute price changes on one-minute net order flow (buyer-initiated trading volume less seller-initiated trading volume) for the on-the-run two-, five-, and ten-year notes in the interdealer market from September 1, 2019 to September 30, 2023. Price impact is measured in 32nds of a point per $100 million, where a point equals one percent of par.
Volatility Spiked in March 2023
The failures of Silicon Valley Bank and Signature Bank increased uncertainty about the economic outlook and expected path of interest rates. Interest rate volatility increased sharply as a result, as shown in the next chart, with two-year note volatility in particular reaching levels more than twice as high as in March 2020. Volatility causes market makers to widen their bid-ask spreads and post less depth at any given price to manage the increased risk of taking on positions, producing a negative relationship between volatility and liquidity. The sharp rise in volatility and its subsequent decline hence help explain the observed patterns in the liquidity measures.
Price Volatility Spiked in March 2023

Source: Author’s calculations, based on data from BrokerTec.
Notes: The chart plots five-day moving averages of price volatility for the on-the-run two-, five-, and ten-year notes in the interdealer market from September 1, 2019 to September 30, 2023. Price volatility is calculated for each day by summing squared one-minute returns (log changes in midpoint prices) from 7 a.m. to 5 p.m., annualizing by multiplying by 252, and then taking the square root. It is reported in percent.
Liquidity Continues to Track Volatility
As in “How Liquid Has the Treasury Market Been in 2022?,” we assess whether liquidity has been unusual given the level of volatility by examining scatter plots of price impact against volatility. The chart below provides such a plot for the five-year note, showing that the 2023 observations (in gray) fall in line with the historical relationship. That is, the association between liquidity and volatility in 2023 has been consistent with the past association between these two variables. This is true for the ten-year note as well, whereas for the two-year note the evidence points to somewhat higher-than-expected price impact given the volatility (as also occurred in fall 2008, March 2020, and 2022).
Liquidity in Line with Historical Relationship with Volatility

Notes: This chart plots price impact against price volatility by week for the on-the-run five-year note from January 1, 2005, to September 30, 2023. The weekly measures for both series are averages of the daily measures plotted in the preceding two charts. Fall 2008 points are for September 21, 2008–January 3, 2009, March 2020 points are for March 1, 2020–March 28, 2020, 2022 points are for January 1, 2022–December 31, 2022, and 2023 points are for January 1, 2023–September 30, 2023.
The preceding analysis is based on realized price volatility—that is, on how much prices are actually changing. We repeated the analysis with implied (or expected) interest rate volatility, as measured by the ICE BofAML MOVE Index, and found similar results for 2023. That is, liquidity for the five- and ten-year notes is in line with the historical relationship between liquidity and expected volatility, whereas liquidity is somewhat worse for the two-year note.
Continued Vigilance
While Treasury market liquidity has not been unusually poor given the level of interest rate volatility, continued vigilance by policymakers and market participants is appropriate. The market’s capacity to smoothly handle large trading flows has been of concern since March 2020, as discussed in this Brookings paper. Moreover, new empirical work shows how constraints on intermediation capacity can exacerbate illiquidity. Careful monitoring of Treasury market liquidity, and continued efforts to enhance the market’s resilience, are warranted.

Michael J. Fleming is the head of Capital Markets Studies in the Federal Reserve Bank of New York’s Research and Statistics Group.
How to cite this post:
Michael Fleming, “How Has Treasury Market Liquidity Evolved in 2023?,” Federal Reserve Bank of New York Liberty Street Economics, October 17, 2023, https://libertystreeteconomics.newyorkfed.org/2023/10/how-has-treasury-market-liquidity-evolved-in-2023/.


Disclaimer
The views expressed in this post are those of the author(s) and do not necessarily reflect the position of the Federal Reserve Bank of New York or the Federal Reserve System. Any errors or omissions are the responsibility of the author(s).
Spread & Containment
The Coming Of The Police State In America
The Coming Of The Police State In America
Authored by Jeffrey Tucker via The Epoch Times,
The National Guard and the State Police are now…
Share this:


Authored by Jeffrey Tucker via The Epoch Times,
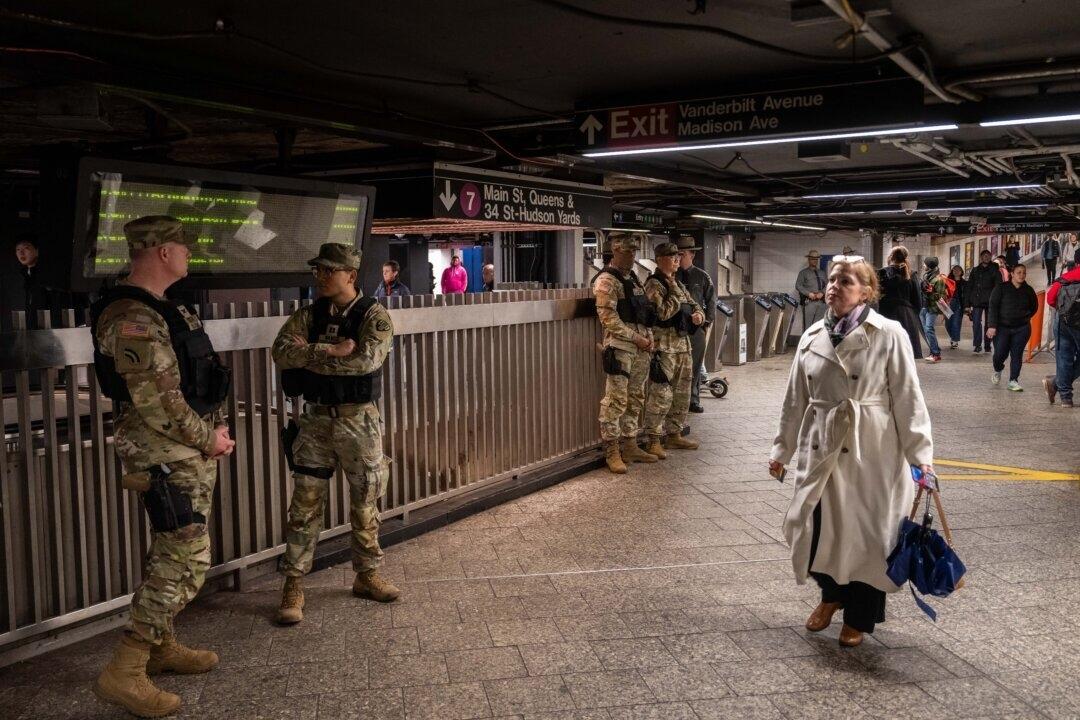
The National Guard and the State Police are now patrolling the New York City subway system in an attempt to do something about the explosion of crime. As part of this, there are bag checks and new surveillance of all passengers. No legislation, no debate, just an edict from the mayor.
Many citizens who rely on this system for transportation might welcome this. It’s a city of strict gun control, and no one knows for sure if they have the right to defend themselves. Merchants have been harassed and even arrested for trying to stop looting and pillaging in their own shops.
The message has been sent: Only the police can do this job. Whether they do it or not is another matter.
Things on the subway system have gotten crazy. If you know it well, you can manage to travel safely, but visitors to the city who take the wrong train at the wrong time are taking grave risks.
In actual fact, it’s guaranteed that this will only end in confiscating knives and other things that people carry in order to protect themselves while leaving the actual criminals even more free to prey on citizens.
The law-abiding will suffer and the criminals will grow more numerous. It will not end well.
When you step back from the details, what we have is the dawning of a genuine police state in the United States. It only starts in New York City. Where is the Guard going to be deployed next? Anywhere is possible.
If the crime is bad enough, citizens will welcome it. It must have been this way in most times and places that when the police state arrives, the people cheer.
We will all have our own stories of how this came to be. Some might begin with the passage of the Patriot Act and the establishment of the Department of Homeland Security in 2001. Some will focus on gun control and the taking away of citizens’ rights to defend themselves.
My own version of events is closer in time. It began four years ago this month with lockdowns. That’s what shattered the capacity of civil society to function in the United States. Everything that has happened since follows like one domino tumbling after another.
It goes like this:
1) lockdown,
2) loss of moral compass and spreading of loneliness and nihilism,
3) rioting resulting from citizen frustration, 4) police absent because of ideological hectoring,
5) a rise in uncontrolled immigration/refugees,
6) an epidemic of ill health from substance abuse and otherwise,
7) businesses flee the city
8) cities fall into decay, and that results in
9) more surveillance and police state.
The 10th stage is the sacking of liberty and civilization itself.
It doesn’t fall out this way at every point in history, but this seems like a solid outline of what happened in this case. Four years is a very short period of time to see all of this unfold. But it is a fact that New York City was more-or-less civilized only four years ago. No one could have predicted that it would come to this so quickly.
But once the lockdowns happened, all bets were off. Here we had a policy that most directly trampled on all freedoms that we had taken for granted. Schools, businesses, and churches were slammed shut, with various levels of enforcement. The entire workforce was divided between essential and nonessential, and there was widespread confusion about who precisely was in charge of designating and enforcing this.
It felt like martial law at the time, as if all normal civilian law had been displaced by something else. That something had to do with public health, but there was clearly more going on, because suddenly our social media posts were censored and we were being asked to do things that made no sense, such as mask up for a virus that evaded mask protection and walk in only one direction in grocery aisles.
Vast amounts of the white-collar workforce stayed home—and their kids, too—until it became too much to bear. The city became a ghost town. Most U.S. cities were the same.
As the months of disaster rolled on, the captives were let out of their houses for the summer in order to protest racism but no other reason. As a way of excusing this, the same public health authorities said that racism was a virus as bad as COVID-19, so therefore it was permitted.
The protests had turned to riots in many cities, and the police were being defunded and discouraged to do anything about the problem. Citizens watched in horror as downtowns burned and drug-crazed freaks took over whole sections of cities. It was like every standard of decency had been zapped out of an entire swath of the population.
Meanwhile, large checks were arriving in people’s bank accounts, defying every normal economic expectation. How could people not be working and get their bank accounts more flush with cash than ever? There was a new law that didn’t even require that people pay rent. How weird was that? Even student loans didn’t need to be paid.
By the fall, recess from lockdown was over and everyone was told to go home again. But this time they had a job to do: They were supposed to vote. Not at the polling places, because going there would only spread germs, or so the media said. When the voting results finally came in, it was the absentee ballots that swung the election in favor of the opposition party that actually wanted more lockdowns and eventually pushed vaccine mandates on the whole population.
The new party in control took note of the large population movements out of cities and states that they controlled. This would have a large effect on voting patterns in the future. But they had a plan. They would open the borders to millions of people in the guise of caring for refugees. These new warm bodies would become voters in time and certainly count on the census when it came time to reapportion political power.
Meanwhile, the native population had begun to swim in ill health from substance abuse, widespread depression, and demoralization, plus vaccine injury. This increased dependency on the very institutions that had caused the problem in the first place: the medical/scientific establishment.
The rise of crime drove the small businesses out of the city. They had barely survived the lockdowns, but they certainly could not survive the crime epidemic. This undermined the tax base of the city and allowed the criminals to take further control.
The same cities became sanctuaries for the waves of migrants sacking the country, and partisan mayors actually used tax dollars to house these invaders in high-end hotels in the name of having compassion for the stranger. Citizens were pushed out to make way for rampaging migrant hordes, as incredible as this seems.
But with that, of course, crime rose ever further, inciting citizen anger and providing a pretext to bring in the police state in the form of the National Guard, now tasked with cracking down on crime in the transportation system.
What’s the next step? It’s probably already here: mass surveillance and censorship, plus ever-expanding police power. This will be accompanied by further population movements, as those with the means to do so flee the city and even the country and leave it for everyone else to suffer.
As I tell the story, all of this seems inevitable. It is not. It could have been stopped at any point. A wise and prudent political leadership could have admitted the error from the beginning and called on the country to rediscover freedom, decency, and the difference between right and wrong. But ego and pride stopped that from happening, and we are left with the consequences.
The government grows ever bigger and civil society ever less capable of managing itself in large urban centers. Disaster is unfolding in real time, mitigated only by a rising stock market and a financial system that has yet to fall apart completely.
Are we at the middle stages of total collapse, or at the point where the population and people in leadership positions wise up and decide to put an end to the downward slide? It’s hard to know. But this much we do know: There is a growing pocket of resistance out there that is fed up and refuses to sit by and watch this great country be sacked and taken over by everything it was set up to prevent.
Spread & Containment
Another beloved brewery files Chapter 11 bankruptcy
The beer industry has been devastated by covid, changing tastes, and maybe fallout from the Bud Light scandal.
Share this:


Before the covid pandemic, craft beer was having a moment. Most cities had multiple breweries and taprooms with some having so many that people put together the brewery version of a pub crawl.
It was a period where beer snobbery ruled the day and it was not uncommon to hear bar patrons discuss the makeup of the beer the beer they were drinking. This boom period always seemed destined for failure, or at least a retraction as many markets seemed to have more craft breweries than they could support.
Related: Fast-food chain closes more stores after Chapter 11 bankruptcy
The pandemic, however, hastened that downfall. Many of these local and regional craft breweries counted on in-person sales to drive their business.
And while many had local and regional distribution, selling through a third party comes with much lower margins. Direct sales drove their business and the pandemic forced many breweries to shut down their taprooms during the period where social distancing rules were in effect.
During those months the breweries still had rent and employees to pay while little money was coming in. That led to a number of popular beermakers including San Francisco's nationally-known Anchor Brewing as well as many regional favorites including Chicago’s Metropolitan Brewing, New Jersey’s Flying Fish, Denver’s Joyride Brewing, Tampa’s Zydeco Brew Werks, and Cleveland’s Terrestrial Brewing filing bankruptcy.
Some of these brands hope to survive, but others, including Anchor Brewing, fell into Chapter 7 liquidation. Now, another domino has fallen as a popular regional brewery has filed for Chapter 11 bankruptcy protection.
Image source: Shutterstock
Covid is not the only reason for brewery bankruptcies
While covid deserves some of the blame for brewery failures, it's not the only reason why so many have filed for bankruptcy protection. Overall beer sales have fallen driven by younger people embracing non-alcoholic cocktails, and the rise in popularity of non-beer alcoholic offerings,
Beer sales have fallen to their lowest levels since 1999 and some industry analysts
"Sales declined by more than 5% in the first nine months of the year, dragged down not only by the backlash and boycotts against Anheuser-Busch-owned Bud Light but the changing habits of younger drinkers," according to data from Beer Marketer’s Insights published by the New York Post.
Bud Light parent Anheuser Busch InBev (BUD) faced massive boycotts after it partnered with transgender social media influencer Dylan Mulvaney. It was a very small partnership but it led to a right-wing backlash spurred on by Kid Rock, who posted a video on social media where he chastised the company before shooting up cases of Bud Light with an automatic weapon.
Another brewery files Chapter 11 bankruptcy
Gizmo Brew Works, which does business under the name Roth Brewing Company LLC, filed for Chapter 11 bankruptcy protection on March 8. In its filing, the company checked the box that indicates that its debts are less than $7.5 million and it chooses to proceed under Subchapter V of Chapter 11.
"Both small business and subchapter V cases are treated differently than a traditional chapter 11 case primarily due to accelerated deadlines and the speed with which the plan is confirmed," USCourts.gov explained.
Roth Brewing/Gizmo Brew Works shared that it has 50-99 creditors and assets $100,000 and $500,000. The filing noted that the company does expect to have funds available for unsecured creditors.
The popular brewery operates three taprooms and sells its beer to go at those locations.
"Join us at Gizmo Brew Works Craft Brewery and Taprooms located in Raleigh, Durham, and Chapel Hill, North Carolina. Find us for entertainment, live music, food trucks, beer specials, and most importantly, great-tasting craft beer by Gizmo Brew Works," the company shared on its website.
The company estimates that it has between $1 and $10 million in liabilities (a broad range as the bankruptcy form does not provide a space to be more specific).
Gizmo Brew Works/Roth Brewing did not share a reorganization or funding plan in its bankruptcy filing. An email request for comment sent through the company's contact page was not immediately returned.
bankruptcy pandemic social distancing
Spread & Containment
Revving up tourism: Formula One and other big events look set to drive growth in the hospitality industry
With big events drawing a growing share of of tourism dollars, F1 offers a potential glimpse of the travel industry’s future.
Share this:


In late 2023, I embarked on my first Formula One race experience, attending the first-ever Las Vegas Grand Prix. I had never been to an F1 race; my interest was sparked during the pandemic, largely through the Netflix series “Formula 1: Drive to Survive.”
But I wasn’t just attending as a fan. As the inaugural chair of the University of Florida’s department of tourism, hospitality and event management, I saw this as an opportunity. Big events and festivals represent a growing share of the tourism market – as an educator, I want to prepare future leaders to manage them.
And what better place to learn how to do that than in the stands of the Las Vegas Grand Prix?

The future of tourism is in events and experiences
Tourism is fun, but it’s also big business: In the U.S. alone, it’s a US$2.6 trillion industry employing 15 million people. And with travelers increasingly planning their trips around events rather than places, both industry leaders and academics are paying attention.
Event tourism is also key to many cities’ economic development strategies – think Chicago and its annual Lollapalooza music festival, which has been hosted in Grant Park since 2005. In 2023, Lollapalooza generated an estimated $422 million for the local economy and drew record-breaking crowds to the city’s hotels.
That’s why when Formula One announced it would be making a 10-year commitment to host races in Las Vegas, the region’s tourism agency was eager to spread the news. The 2023 grand prix eventually generated $100 million in tax revenue, the head of that agency later announced.
Why Formula One?
Formula One offers a prime example of the economic importance of event tourism. In 2022, Formula One generated about $2.6 billion in total revenues, according to the latest full-year data from its parent company. That’s up 20% from 2021 and 27% from 2019, the last pre-COVID year. A record 5.7 million fans attended Formula One races in 2022, up 36% from 2019.
This surge in interest can be attributed to expanded broadcasting rights, sponsorship deals and a growing global fan base. And, of course, the in-person events make a lot of money – the cheapest tickets to the Las Vegas Grand Prix were $500.

That’s why I think of Formula One as more than just a pastime: It’s emblematic of a major shift in the tourism industry that offers substantial job opportunities. And it takes more than drivers and pit crews to make Formula One run – it takes a diverse range of professionals in fields such as event management, marketing, engineering and beyond.
This rapid industry growth indicates an opportune moment for universities to adapt their hospitality and business curricula and prepare students for careers in this profitable field.
How hospitality and business programs should prepare students
To align with the evolving landscape of mega-events like Formula One races, hospitality schools should, I believe, integrate specialized training in event management, luxury hospitality and international business. Courses focusing on large-scale event planning, VIP client management and cross-cultural communication are essential.
Another area for curriculum enhancement is sustainability and innovation in hospitality. Formula One, like many other companies, has increased its emphasis on environmental responsibility in recent years. While some critics have been skeptical of this push, I think it makes sense. After all, the event tourism industry both contributes to climate change and is threatened by it. So, programs may consider incorporating courses in sustainable event management, eco-friendly hospitality practices and innovations in sustainable event and tourism.
Additionally, business programs may consider emphasizing strategic marketing, brand management and digital media strategies for F1 and for the larger event-tourism space. As both continue to evolve, understanding how to leverage digital platforms, engage global audiences and create compelling brand narratives becomes increasingly important.
Beyond hospitality and business, other disciplines such as material sciences, engineering and data analytics can also integrate F1 into their curricula. Given the younger generation’s growing interest in motor sports, embedding F1 case studies and projects in these programs can enhance student engagement and provide practical applications of theoretical concepts.
Racing into the future: Formula One today and tomorrow
F1 has boosted its outreach to younger audiences in recent years and has also acted to strengthen its presence in the U.S., a market with major potential for the sport. The 2023 Las Vegas race was a strategic move in this direction. These decisions, along with the continued growth of the sport’s fan base and sponsorship deals, underscore F1’s economic significance and future potential.
Looking ahead in 2024, Formula One seems ripe for further expansion. New races, continued advancements in broadcasting technology and evolving sponsorship models are expected to drive revenue growth. And Season 6 of “Drive to Survive” will be released on Feb. 23, 2024. We already know that was effective marketing – after all, it inspired me to check out the Las Vegas Grand Prix.
I’m more sure than ever that big events like this will play a major role in the future of tourism – a message I’ll be imparting to my students. And in my free time, I’m planning to enhance my quality of life in 2024 by synchronizing my vacations with the F1 calendar. After all, nothing says “relaxing getaway” quite like the roar of engines and excitement of the racetrack.
Rachel J.C. Fu does not work for, consult, own shares in or receive funding from any company or organization that would benefit from this article, and has disclosed no relevant affiliations beyond their academic appointment.
spread pandemic

The Coming Of The Police State In America


Catastrophic Risk: Investing and Business Implications


Dropping Like a Stone: ON RRP Take‑up in the Second Half of 2023


Where Is R‑Star and the End of the Refi Boom: The Top 5 Posts of 2023


Redefining Poverty: Towards a Transpartisan Approach


Students lose out as cities and states give billions in property tax breaks to businesses − draining school budgets and especially hurting the poorest students


Revving up tourism: Formula One and other big events look set to drive growth in the hospitality industry


Another beloved brewery files Chapter 11 bankruptcy
-

 Uncategorized2 weeks ago
All Of The Elements Are In Place For An Economic Crisis Of Staggering Proportions
-

 Uncategorized1 month ago
Cathie Wood sells a major tech stock (again)
-

 Uncategorized3 weeks ago
California Counties Could Be Forced To Pay $300 Million To Cover COVID-Era Program
-

 Uncategorized2 weeks ago
Apparel Retailer Express Moving Toward Bankruptcy
-

 Uncategorized3 weeks ago
Industrial Production Decreased 0.1% in January
-

 International2 days ago
Walmart launches clever answer to Target’s new membership program
-

 Uncategorized3 weeks ago
RFK Jr: The Wuhan Cover-Up & The Rise Of The Biowarfare-Industrial Complex
-

 International2 days ago
EyePoint poaches medical chief from Apellis; Sandoz CFO, longtime BioNTech exec to retire