Uncategorized
Global Beverage Packaging Market to Reach $204.4 Billion by 2030
Global Beverage Packaging Market to Reach $204.4 Billion by 2030
PR Newswire
NEW YORK, Feb. 10, 2023
NEW YORK, Feb. 10, 2023 /PRNewswire/ — The global economy is at a critical crossroads with a number of interlocking challenges and crises running …
Share this:

Global Beverage Packaging Market to Reach $204.4 Billion by 2030
PR Newswire
NEW YORK, Feb. 10, 2023
NEW YORK, Feb. 10, 2023 /PRNewswire/ -- The global economy is at a critical crossroads with a number of interlocking challenges and crises running in parallel. The uncertainty around how Russia`s war on Ukraine will play out this year and the war`s role in creating global instability means that the trouble on the inflation front is not over yet. Food and fuel inflation will remain a persistent economic problem. Higher retail inflation will impact consumer confidence and spending. As governments combat inflation by raising interest rates, new job creation will slowdown and impact economic activity and growth. Lower capital expenditure is in the offing as companies go slow on investments, held back by inflation worries and weaker demand. With slower growth and high inflation, developed markets seem primed to enter into a recession. Fears of new COVID outbreaks and China's already uncertain post-pandemic path poses a real risk of the world experiencing more acute supply chain pain and manufacturing disruptions this year. Volatile financial markets, growing trade tensions, stricter regulatory environment and pressure to mainstream climate change into economic decisions will compound the complexity of challenges faced. Year 2023 is expected to be tough year for most markets, investors and consumers. Nevertheless, there is always opportunity for businesses and their leaders who can chart a path forward with resilience and adaptability.
Read the full report: https://www.reportlinker.com/p0552757/?utm_source=PRN
Global Beverage Packaging Market to Reach $204.4 Billion by 2030
In the changed post COVID-19 business landscape, the global market for Beverage Packaging estimated at US$143.7 Billion in the year 2022, is projected to reach a revised size of US$204.4 Billion by 2030, growing at a CAGR of 4.5% over the analysis period 2022-2030. Plastic, one of the segments analyzed in the report, is projected to record a 5.4% CAGR and reach US$77.4 Billion by the end of the analysis period. Taking into account the ongoing post pandemic recovery, growth in the Glass segment is readjusted to a revised 3.5% CAGR for the next 8-year period.
The U.S. Market is Estimated at $39.1 Billion, While China is Forecast to Grow at 7.7% CAGR
The Beverage Packaging market in the U.S. is estimated at US$39.1 Billion in the year 2022. China, the world`s second largest economy, is forecast to reach a projected market size of US$43.7 Billion by the year 2030 trailing a CAGR of 7.7% over the analysis period 2022 to 2030. Among the other noteworthy geographic markets are Japan and Canada, each forecast to grow at 2.3% and 3.7% respectively over the 2022-2030 period. Within Europe, Germany is forecast to grow at approximately 3% CAGR. Led by countries such as Australia, India, and South Korea, the market in Asia-Pacific is forecast to reach US$27.4 Billion by the year 2030.
Select Competitors (Total 78 Featured)
- Amcor Ltd.
- American Packaging Corporation
- Anchor Glass Container Corporation
- Anheuser-Busch Companies, LLC
- Ardagh Group S.A.
- Ball Corporation
- Can-Pack S. A.
- Constantia Flexibles GmbH
- Coveris Holdings S.A.
- CPMC Holdings Limited
- Crown Holdings, Inc.
- Daiwa Can Company
- Gerresheimer AG
- Graham Packaging Company Inc.
- HUBER Packaging Group GmbH
- Kingcan Holdings Limited
- Metal Container Corp.
- Mondi plc
- Orora Limited
- SIG Combibloc Group AG
- Silgan Holdings Inc.
- Tecnocap S.p.A
- Verallia SA
- Vetropack Holding AG
- Wiegand-Glas GmbH
Read the full report: https://www.reportlinker.com/p0552757/?utm_source=PRN
I. METHODOLOGY
II. EXECUTIVE SUMMARY
1. MARKET OVERVIEW
Influencer Market Insights
World Market Trajectories
Beverage Packaging: Preserving Quality & Taste; Combining
Convenience & Value, and Providing Portability & Safety
Recent Market Activity
Packaging as a Critical Requirement for Success in the Fiercely
Competitive Beverage Market: The Fundamental Growth Driver
Packaging Innovation and Route to Market
Major Trends in Beverage Packaging Summarized
Major Beverage Industry Trends that are Influencing Packaging
Options
Recent Design Trends in Beverage Packaging Summarized
Global Market Outlook
Emerging Markets Offer Lucrative Growth Opportunities for
Beverage Packaging
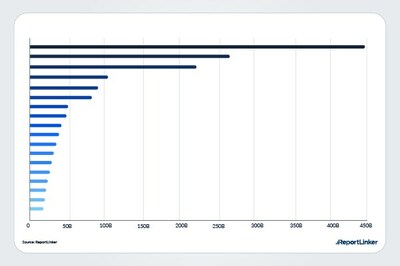
Beverage Packaging - Global Key Competitors Percentage Market
Share in 2022 (E)
Beverage Packaging Competitor Market Share Scenario Worldwide
(in %): 2020 & 2025
Competitive Market Presence - Strong/Active/Niche/Trivial for
Players Worldwide in 2022 (E)
Beverage Packaging Competitor Market Share Scenario Worldwide
(in %): 2020 & 2029
Impact of Covid-19 and a Looming Global Recession
2. FOCUS ON SELECT PLAYERS
Amcor Ltd. (Australia)
Bemis Company, Inc. (USA)
American Packaging Corporation (USA)
Anchor Glass Container Corporation (USA)
Anheuser-Busch Companies, LLC (USA)
Metal Container Corp. (USA)
ArcelorMittal S.A. (Luxembourg)
Ardagh Group S.A. (Luxembourg)
Ball Corporation (USA)
Rocky Mountain Metal Container, LLC (USA)
Berry Global, Inc. (USA)
Can-Pack S. A. (Poland)
CCL Industries, Inc. (Canada)
Clondalkin Group Holdings B.V. (The Netherlands)
Consol Speciality Glass (Pty) Ltd. (South Africa)
Constantia Flexibles GmbH (Austria)
Coveris Holdings S.A. (Luxembourg)
CPMC Holdings Limited (China)
Crown Holdings, Inc. (USA)
Daiwa Can Company (Japan)
Ecolean AB (Sweden)
EXAL Corporation (USA)
Fabri-Kal Corporation (USA)
Gerresheimer AG (Germany)
Graham Packaging Company Inc. (USA)
HUBER Packaging Group GmbH (Germany)
Kian Joo Can Factory Berhad (Malaysia)
Kingcan Holdings Limited (China)
Mondi plc (UK)
Orora Limited (Australia)
Owens-Illinois, Inc. (USA)
Pirlo GmbH & Co KG (Austria)
Printpack Inc. (USA)
ProAmpac LLC (USA)
RPC Group Plc (UK)
RPC Astrapak Ltd. (South Africa)
SIG Combibloc Group AG (Switzerland)
Silgan Holdings Inc. (USA)
Sonoco Products Company (USA)
Tecnocap S.p.A (Italy)
TUBETTIFICIO EUROPEO Spa (Italy)
Tetra Laval International S.A. (Switzerland)
The Envases Universales Group (Mexico)
Toyo Seikan Group Holdings, Ltd. (Japan)
Türkiye Sise Ve Cam Fabrikalari A.S. (Turkey)
Anadolu Cam Sanayii A.S. (Turkey)
Verallia SA (France)
Vetropack Holding AG (Switzerland)
Vidrala S.A. (Spain)
WestRock Company (USA)
Wiegand-Glas GmbH (Germany)
ZIGNAGO VETRO S.p.A. (Italy)
3. MARKET TRENDS & DRIVERS
Growing Prominence of Smart and Active Beverage Packaging Drive
Healthy Market Growth
SmarterSeal: A Smart Can Topper
CrownSmart?
OpenSense
Smart Wine Bottle
Smart Milk
Packaging Solutions with Image Recognition and Color Changing
Features
Smart Packaging for Beer
Augment Reality (AR), NFC, QR Codes in Beverage Packaging
Provide a Highly Interactive and Superior Digital Experience
Increasing Consumption of Various Beverages Worldwide:
Foundation for Market Growth
Healthy Beverages and Packaged Water Witness Spiraling Consumption
Driven by the Surging Popularity of PET, Plastic Packaging
Dominates Beverage Packaging Cannibalizing Glass and Metal
Packaging
Enhancing Sustainability of PET Bottles through Re-Use
Sustainable, Green, and Purity Attributes Sustain Demand for
Glass Beverage Packaging
BPA Risks Benefit Market Prospects for Glass in Beverage Packaging
Environmental Concerns Contribute to Glass Packaging Popularity
How Glass Packaging Fares Compared with Alternative Packaging
Materials?
Growing Demand for Beverage Cans Drive Healthy Market Growth
for Metal Beverage Packaging
Metal Packaging?s Superiority over Other Packaging Materials
Complete Recyclability Provides the Critical Advantage
Robust Demand for Safe and Convenient Beverages Spurs Demand
for Beverage Cans
Proliferation of Aluminum Cans in Beverage Market Benefits Can
Filling, Seaming Solution Providers
Rising Sales of Alcoholic Beverages Provides the Perfect
Platform for Market Growth
Effective Packaging Trends and Strategies in the Wine Industry
Increasing Alcohol Consumption Worldwide: An Important
Opportunity Indicator
Glass: The Dominant Beverage Packaging Material for Beer
Glass: The Preferred Packaging Material for Retail Wine
Packaging Too
Super Premium Spirits Brings Back Glass Packaging into Focus
Increasing Beer Production Spells Opportunities for Metal Cans
Aluminum Cans: Replacing Glass in Beer and Soft Drink Segments
Need to Accentuate Display and Branding Drive Significant
Interest in Secondary Packaging for Beverages
?Light Weighting?: Enabling Lower Raw Material Consumption and
Reduced CO2 Emissions
Lightweight Glass: Popular Choice for Sustainable Wine Packaging
The ?Lightweighting? Trend Spurs Efforts to Improve Packaging
Efficiencies
Sustainability Revolution Drives Adoption of Eco-Friendly
Beverage Packaging
Eco-Friendly and Cost-Efficient Beverage Packaging Systems
Renewable Packaging
Green Packaging
Bio-Plastics
Stick Packs and Plastic Canister
Sustainable Aseptic Pouches
Plain and Biodegradable Beverage Packaging
Key Challenges with Marking and Coding of New, Sustainable
Packaging Material for Beverages
Flexible Packaging Continue to Displace Rigid Packaging in
Beverages
Flexible Packaging Options for Food & Beverage Packaging on the
Rise
Demand for Stand-Up Pouches to Benefit from On-the-Go Consumer
Lifestyles
Changing Trends in Tea Packaging Augurs Well for the Market
Paperboard Beverage Cartons: The Cost-Effective Attribute Drive
Demand
Need for Brand Protection Drives Demand for Anti-counterfeit
Packaging
Surging Demand for Healthy Functional Beverages Offer Lucrative
Opportunities for Packaging Solutions
Emerging Culture of Daily Dose Functional Drinks Bodes Well for
Functional Beverage Packaging
Booming Demand for Energy Drinks Expands Addressable Market
Favorable Demographic and Economic Trends Strengthen Market
Prospects
Growing Consumption of Wine among Young Adults
Shrinking Family Size
Emergence of Women as a Major Consumer Cluster
Rapid Urbanization
Burgeoning Middle Class Population
Key Growth Restraining Factors
Changes in Legislation & Regulations
Volatility in Raw Materials Prices
Supply of Contaminated or Faulty Products
Concerns over Safety of Content
Self-Powering Smart Packaging Devices
Edible Water Bottle of the Future
Innovative and Attractive Packaging for Sparkling Waters
New and Innovative Packaging for ?Tea of a Kind?
Novel uShape Technology for Aluminum Beverage Bottles
Compressible Cartons for Beverage Packaging
eSolarMark: New Coding Technology for Beverage Packaging
Innovative Clasper Bottle Technology for Alcoholic Beverage
Packaging
Meypack VP 600: New Machine for Case Packing
Innovative Multi-Packing Canning Solution
TWINCAP Infusion Cap System
Advanced Packaging Solution using Datalase Inline Digital
Printing (IDP) System
Promotional Labels with In-Built NFC Tags
KarmaCap for Shelf-STable Probiotic Beverages
Innovative Packaging Solution for Tom?s Teas
MyPour Container for Precise Pouring of Beer
Unique Bottle Design for Kolibri Drinks
New Lightweight Sustainable Bottle
Select Novel Packaging Formats for Beverages
Bottle in Bottle, U-Boot
Innovative Plastic Packaging with Preservative Properties
Bag-in-a-Box Innovations Elevate Opportunities for Paperboard
Innovative Glass Closure for Whiskey Bottles
Liquid Food Packaging Sector: Innovations despite Adversities
Other Noteworthy Beverage Packaging Innovations and Advancements
The Flip-Bottle
Ultra-thin Packaging Steel
Metal Embossing
DrinkStack
The Vini
4. GLOBAL MARKET PERSPECTIVE
Table 1: World Recent Past, Current & Future Analysis for
Beverage Packaging by Geographic Region - USA, Canada, Japan,
China, Europe, Asia-Pacific, Latin America, Middle East and
Africa Markets - Independent Analysis of Annual Sales in US$
Million for Years 2022 through 2030 and % CAGR
Table 2: World Historic Review for Beverage Packaging by
Geographic Region - USA, Canada, Japan, China, Europe,
Asia-Pacific, Latin America, Middle East and Africa Markets -
Independent Analysis of Annual Sales in US$ Million for Years
2012 through 2021 and % CAGR
Table 3: World 18-Year Perspective for Beverage Packaging by
Geographic Region - Percentage Breakdown of Value Sales for
USA, Canada, Japan, China, Europe, Asia-Pacific, Latin America,
Middle East and Africa Markets for Years 2012, 2023 & 2030
Table 4: World Recent Past, Current & Future Analysis for
Plastic by Geographic Region - USA, Canada, Japan, China,
Europe, Asia-Pacific, Latin America, Middle East and Africa
Markets - Independent Analysis of Annual Sales in US$ Million
for Years 2022 through 2030 and % CAGR
Table 5: World Historic Review for Plastic by Geographic Region -
USA, Canada, Japan, China, Europe, Asia-Pacific, Latin
America, Middle East and Africa Markets - Independent Analysis
of Annual Sales in US$ Million for Years 2012 through 2021 and
% CAGR
Table 6: World 18-Year Perspective for Plastic by Geographic
Region - Percentage Breakdown of Value Sales for USA, Canada,
Japan, China, Europe, Asia-Pacific, Latin America, Middle East
and Africa for Years 2012, 2023 & 2030
Table 7: World Recent Past, Current & Future Analysis for Glass
by Geographic Region - USA, Canada, Japan, China, Europe,
Asia-Pacific, Latin America, Middle East and Africa Markets -
Independent Analysis of Annual Sales in US$ Million for Years
2022 through 2030 and % CAGR
Table 8: World Historic Review for Glass by Geographic Region -
USA, Canada, Japan, China, Europe, Asia-Pacific, Latin America,
Middle East and Africa Markets - Independent Analysis of Annual
Sales in US$ Million for Years 2012 through 2021 and % CAGR
Table 9: World 18-Year Perspective for Glass by Geographic
Region - Percentage Breakdown of Value Sales for USA, Canada,
Japan, China, Europe, Asia-Pacific, Latin America, Middle East
and Africa for Years 2012, 2023 & 2030
Table 10: World Recent Past, Current & Future Analysis for
Metal by Geographic Region - USA, Canada, Japan, China, Europe,
Asia-Pacific, Latin America, Middle East and Africa Markets -
Independent Analysis of Annual Sales in US$ Million for Years
2022 through 2030 and % CAGR
Table 11: World Historic Review for Metal by Geographic Region -
USA, Canada, Japan, China, Europe, Asia-Pacific, Latin
America, Middle East and Africa Markets - Independent Analysis
of Annual Sales in US$ Million for Years 2012 through 2021 and
% CAGR
Table 12: World 18-Year Perspective for Metal by Geographic
Region - Percentage Breakdown of Value Sales for USA, Canada,
Japan, China, Europe, Asia-Pacific, Latin America, Middle East
and Africa for Years 2012, 2023 & 2030
Table 13: World Recent Past, Current & Future Analysis for
Other Segments by Geographic Region - USA, Canada, Japan,
China, Europe, Asia-Pacific, Latin America, Middle East and
Africa Markets - Independent Analysis of Annual Sales in US$
Million for Years 2022 through 2030 and % CAGR
Table 14: World Historic Review for Other Segments by
Geographic Region - USA, Canada, Japan, China, Europe,
Asia-Pacific, Latin America, Middle East and Africa Markets -
Independent Analysis of Annual Sales in US$ Million for Years
2012 through 2021 and % CAGR
Table 15: World 18-Year Perspective for Other Segments by
Geographic Region - Percentage Breakdown of Value Sales for
USA, Canada, Japan, China, Europe, Asia-Pacific, Latin America,
Middle East and Africa for Years 2012, 2023 & 2030
Table 16: World Recent Past, Current & Future Analysis for
Alcoholic by Geographic Region - USA, Canada, Japan, China,
Europe, Asia-Pacific, Latin America, Middle East and Africa
Markets - Independent Analysis of Annual Sales in US$ Million
for Years 2022 through 2030 and % CAGR
Table 17: World Historic Review for Alcoholic by Geographic
Region - USA, Canada, Japan, China, Europe, Asia-Pacific, Latin
America, Middle East and Africa Markets - Independent Analysis
of Annual Sales in US$ Million for Years 2012 through 2021 and
% CAGR
Table 18: World 18-Year Perspective for Alcoholic by Geographic
Region - Percentage Breakdown of Value Sales for USA, Canada,
Japan, China, Europe, Asia-Pacific, Latin America, Middle East
and Africa for Years 2012, 2023 & 2030
Table 19: World Recent Past, Current & Future Analysis for
Non-Alcoholic by Geographic Region - USA, Canada, Japan, China,
Europe, Asia-Pacific, Latin America, Middle East and Africa
Markets - Independent Analysis of Annual Sales in US$ Million
for Years 2022 through 2030 and % CAGR
Table 20: World Historic Review for Non-Alcoholic by Geographic
Region - USA, Canada, Japan, China, Europe, Asia-Pacific, Latin
America, Middle East and Africa Markets - Independent Analysis
of Annual Sales in US$ Million for Years 2012 through 2021 and
% CAGR
Table 21: World 18-Year Perspective for Non-Alcoholic by
Geographic Region - Percentage Breakdown of Value Sales for
USA, Canada, Japan, China, Europe, Asia-Pacific, Latin America,
Middle East and Africa for Years 2012, 2023 & 2030
Table 22: World Beverage Packaging Market Analysis of Annual
Sales in US$ Million for Years 2012 through 2030
III. MARKET ANALYSIS
UNITED STATES
Beverage Packaging Market Presence - Strong/Active/Niche/
Trivial - Key Competitors in the United States for 2023 (E)
Table 23: USA Recent Past, Current & Future Analysis for
Beverage Packaging by Material - Plastic, Glass, Metal and
Other Segments - Independent Analysis of Annual Sales in US$
Million for the Years 2022 through 2030 and % CAGR
Table 24: USA Historic Review for Beverage Packaging by
Material - Plastic, Glass, Metal and Other Segments Markets -
Independent Analysis of Annual Sales in US$ Million for Years
2012 through 2021 and % CAGR
Table 25: USA 18-Year Perspective for Beverage Packaging by
Material - Percentage Breakdown of Value Sales for Plastic,
Glass, Metal and Other Segments for the Years 2012, 2023 & 2030
Table 26: USA Recent Past, Current & Future Analysis for
Beverage Packaging by Beverage Type - Alcoholic and
Non-Alcoholic - Independent Analysis of Annual Sales in US$
Million for the Years 2022 through 2030 and % CAGR
Table 27: USA Historic Review for Beverage Packaging by
Beverage Type - Alcoholic and Non-Alcoholic Markets -
Independent Analysis of Annual Sales in US$ Million for Years
2012 through 2021 and % CAGR
Table 28: USA 18-Year Perspective for Beverage Packaging by
Beverage Type - Percentage Breakdown of Value Sales for
Alcoholic and Non-Alcoholic for the Years 2012, 2023 & 2030
CANADA
Table 29: Canada Recent Past, Current & Future Analysis for
Beverage Packaging by Material - Plastic, Glass, Metal and
Other Segments - Independent Analysis of Annual Sales in US$
Million for the Years 2022 through 2030 and % CAGR
Table 30: Canada Historic Review for Beverage Packaging by
Material - Plastic, Glass, Metal and Other Segments Markets -
Independent Analysis of Annual Sales in US$ Million for Years
2012 through 2021 and % CAGR
Table 31: Canada 18-Year Perspective for Beverage Packaging by
Material - Percentage Breakdown of Value Sales for Plastic,
Glass, Metal and Other Segments for the Years 2012, 2023 & 2030
Table 32: Canada Recent Past, Current & Future Analysis for
Beverage Packaging by Beverage Type - Alcoholic and
Non-Alcoholic - Independent Analysis of Annual Sales in US$
Million for the Years 2022 through 2030 and % CAGR
Table 33: Canada Historic Review for Beverage Packaging by
Beverage Type - Alcoholic and Non-Alcoholic Markets -
Independent Analysis of Annual Sales in US$ Million for Years
2012 through 2021 and % CAGR
Table 34: Canada 18-Year Perspective for Beverage Packaging by
Beverage Type - Percentage Breakdown of Value Sales for
Alcoholic and Non-Alcoholic for the Years 2012, 2023 & 2030
JAPAN
Beverage Packaging Market Presence - Strong/Active/Niche/
Trivial - Key Competitors in Japan for 2023 (E)
Table 35: Japan Recent Past, Current & Future Analysis for
Beverage Packaging by Material - Plastic, Glass, Metal and
Other Segments - Independent Analysis of Annual Sales in US$
Million for the Years 2022 through 2030 and % CAGR
Table 36: Japan Historic Review for Beverage Packaging by
Material - Plastic, Glass, Metal and Other Segments Markets -
Independent Analysis of Annual Sales in US$ Million for Years
2012 through 2021 and % CAGR
Table 37: Japan 18-Year Perspective for Beverage Packaging by
Material - Percentage Breakdown of Value Sales for Plastic,
Glass, Metal and Other Segments for the Years 2012, 2023 & 2030
Table 38: Japan Recent Past, Current & Future Analysis for
Beverage Packaging by Beverage Type - Alcoholic and
Non-Alcoholic - Independent Analysis of Annual Sales in US$
Million for the Years 2022 through 2030 and % CAGR
Table 39: Japan Historic Review for Beverage Packaging by
Beverage Type - Alcoholic and Non-Alcoholic Markets -
Independent Analysis of Annual Sales in US$ Million for Years
2012 through 2021 and % CAGR
Table 40: Japan 18-Year Perspective for Beverage Packaging by
Beverage Type - Percentage Breakdown of Value Sales for
Alcoholic and Non-Alcoholic for the Years 2012, 2023 & 2030
CHINA
Beverage Packaging Market Presence - Strong/Active/Niche/
Trivial - Key Competitors in China for 2023 (E)
Table 41: China Recent Past, Current & Future Analysis for
Beverage Packaging by Material - Plastic, Glass, Metal and
Other Segments - Independent Analysis of Annual Sales in US$
Million for the Years 2022 through 2030 and % CAGR
Table 42: China Historic Review for Beverage Packaging by
Material - Plastic, Glass, Metal and Other Segments Markets -
Independent Analysis of Annual Sales in US$ Million for Years
2012 through 2021 and % CAGR
Table 43: China 18-Year Perspective for Beverage Packaging by
Material - Percentage Breakdown of Value Sales for Plastic,
Glass, Metal and Other Segments for the Years 2012, 2023 & 2030
Table 44: China Recent Past, Current & Future Analysis for
Beverage Packaging by Beverage Type - Alcoholic and
Non-Alcoholic - Independent Analysis of Annual Sales in US$
Million for the Years 2022 through 2030 and % CAGR
Table 45: China Historic Review for Beverage Packaging by
Beverage Type - Alcoholic and Non-Alcoholic Markets -
Independent Analysis of Annual Sales in US$ Million for Years
2012 through 2021 and % CAGR
Table 46: China 18-Year Perspective for Beverage Packaging by
Beverage Type - Percentage Breakdown of Value Sales for
Alcoholic and Non-Alcoholic for the Years 2012, 2023 & 2030
EUROPE
Beverage Packaging Market Presence - Strong/Active/Niche/
Trivial - Key Competitors in Europe for 2023 (E)
Table 47: Europe Recent Past, Current & Future Analysis for
Beverage Packaging by Geographic Region - France, Germany,
Italy, UK, Spain, Russia and Rest of Europe Markets -
Independent Analysis of Annual Sales in US$ Million for Years
2022 through 2030 and % CAGR
Table 48: Europe Historic Review for Beverage Packaging by
Geographic Region - France, Germany, Italy, UK, Spain, Russia
and Rest of Europe Markets - Independent Analysis of Annual
Sales in US$ Million for Years 2012 through 2021 and % CAGR
Table 49: Europe 18-Year Perspective for Beverage Packaging by
Geographic Region - Percentage Breakdown of Value Sales for
France, Germany, Italy, UK, Spain, Russia and Rest of Europe
Markets for Years 2012, 2023 & 2030
Table 50: Europe Recent Past, Current & Future Analysis for
Beverage Packaging by Material - Plastic, Glass, Metal and
Other Segments - Independent Analysis of Annual Sales in US$
Million for the Years 2022 through 2030 and % CAGR
Table 51: Europe Historic Review for Beverage Packaging by
Material - Plastic, Glass, Metal and Other Segments Markets -
Independent Analysis of Annual Sales in US$ Million for Years
2012 through 2021 and % CAGR
Table 52: Europe 18-Year Perspective for Beverage Packaging by
Material - Percentage Breakdown of Value Sales for Plastic,
Glass, Metal and Other Segments for the Years 2012, 2023 & 2030
Table 53: Europe Recent Past, Current & Future Analysis for
Beverage Packaging by Beverage Type - Alcoholic and
Non-Alcoholic - Independent Analysis of Annual Sales in US$
Million for the Years 2022 through 2030 and % CAGR
Table 54: Europe Historic Review for Beverage Packaging by
Beverage Type - Alcoholic and Non-Alcoholic Markets -
Independent Analysis of Annual Sales in US$ Million for Years
2012 through 2021 and % CAGR
Table 55: Europe 18-Year Perspective for Beverage Packaging by
Beverage Type - Percentage Breakdown of Value Sales for
Alcoholic and Non-Alcoholic for the Years 2012, 2023 & 2030
FRANCE
Beverage Packaging Market Presence - Strong/Active/Niche/
Trivial - Key Competitors in France for 2023 (E)
Table 56: France Recent Past, Current & Future Analysis for
Beverage Packaging by Material - Plastic, Glass, Metal and
Other Segments - Independent Analysis of Annual Sales in US$
Million for the Years 2022 through 2030 and % CAGR
Table 57: France Historic Review for Beverage Packaging by
Material - Plastic, Glass, Metal and Other Segments Markets -
Independent Analysis of Annual Sales in US$ Million for Years
2012 through 2021 and % CAGR
Table 58: France 18-Year Perspective for Beverage Packaging by
Material - Percentage Breakdown of Value Sales for Plastic,
Glass, Metal and Other Segments for the Years 2012, 2023 & 2030
Table 59: France Recent Past, Current & Future Analysis for
Beverage Packaging by Beverage Type - Alcoholic and
Non-Alcoholic - Independent Analysis of Annual Sales in US$
Million for the Years 2022 through 2030 and % CAGR
Table 60: France Historic Review for Beverage Packaging by
Beverage Type - Alcoholic and Non-Alcoholic Markets -
Independent Analysis of Annual Sales in US$ Million for Years
2012 through 2021 and % CAGR
Table 61: France 18-Year Perspective for Beverage Packaging by
Beverage Type - Percentage Breakdown of Value Sales for
Alcoholic and Non-Alcoholic for the Years 2012, 2023 & 2030
GERMANY
Beverage Packaging Market Presence - Strong/Active/Niche/
Trivial - Key Competitors in Germany for 2023 (E)
Table 62: Germany Recent Past, Current & Future Analysis for
Beverage Packaging by Material - Plastic, Glass, Metal and
Other Segments - Independent Analysis of Annual Sales in US$
Million for the Years 2022 through 2030 and % CAGR
Table 63: Germany Historic Review for Beverage Packaging by
Material - Plastic, Glass, Metal and Other Segments Markets -
Independent Analysis of Annual Sales in US$ Million for Years
2012 through 2021 and % CAGR
Table 64: Germany 18-Year Perspective for Beverage Packaging by
Material - Percentage Breakdown of Value Sales for Plastic,
Glass, Metal and Other Segments for the Years 2012, 2023 & 2030
Table 65: Germany Recent Past, Current & Future Analysis for
Beverage Packaging by Beverage Type - Alcoholic and
Non-Alcoholic - Independent Analysis of Annual Sales in US$
Million for the Years 2022 through 2030 and % CAGR
Table 66: Germany Historic Review for Beverage Packaging by
Beverage Type - Alcoholic and Non-Alcoholic Markets -
Independent Analysis of Annual Sales in US$ Million for Years
2012 through 2021 and % CAGR
Table 67: Germany 18-Year Perspective for Beverage Packaging by
Beverage Type - Percentage Breakdown of Value Sales for
Alcoholic and Non-Alcoholic for the Years 2012, 2023 & 2030
ITALY
Table 68: Italy Recent Past, Current & Future Analysis for
Beverage Packaging by Material - Plastic, Glass, Metal and
Other Segments - Independent Analysis of Annual Sales in US$
Million for the Years 2022 through 2030 and % CAGR
Table 69: Italy Historic Review for Beverage Packaging by
Material - Plastic, Glass, Metal and Other Segments Markets -
Independent Analysis of Annual Sales in US$ Million for Years
2012 through 2021 and % CAGR
Table 70: Italy 18-Year Perspective for Beverage Packaging by
Material - Percentage Breakdown of Value Sales for Plastic,
Glass, Metal and Other Segments for the Years 2012, 2023 & 2030
Table 71: Italy Recent Past, Current & Future Analysis for
Beverage Packaging by Beverage Type - Alcoholic and
Non-Alcoholic - Independent Analysis of Annual Sales in US$
Million for the Years 2022 through 2030 and % CAGR
Table 72: Italy Historic Review for Beverage Packaging by
Beverage Type - Alcoholic and Non-Alcoholic Markets -
Independent Analysis of Annual Sales in US$ Million for Years
2012 through 2021 and % CAGR
Table 73: Italy 18-Year Perspective for Beverage Packaging by
Beverage Type - Percentage Breakdown of Value Sales for
Alcoholic and Non-Alcoholic for the Years 2012, 2023 & 2030
UNITED KINGDOM
Beverage Packaging Market Presence - Strong/Active/Niche/
Trivial - Key Competitors in the United Kingdom for 2023 (E)
Table 74: UK Recent Past, Current & Future Analysis for
Beverage Packaging by Material - Plastic, Glass, Metal and
Other Segments - Independent Analysis of Annual Sales in US$
Million for the Years 2022 through 2030 and % CAGR
Table 75: UK Historic Review for Beverage Packaging by Material -
Plastic, Glass, Metal and Other Segments Markets -
Independent Analysis of Annual Sales in US$ Million for Years
2012 through 2021 and % CAGR
Table 76: UK 18-Year Perspective for Beverage Packaging by
Material - Percentage Breakdown of Value Sales for Plastic,
Glass, Metal and Other Segments for the Years 2012, 2023 & 2030
Table 77: UK Recent Past, Current & Future Analysis for
Beverage Packaging by Beverage Type - Alcoholic and
Non-Alcoholic - Independent Analysis of Annual Sales in US$
Million for the Years 2022 through 2030 and % CAGR
Table 78: UK Historic Review for Beverage Packaging by Beverage
Type - Alcoholic and Non-Alcoholic Markets - Independent
Analysis of Annual Sales in US$ Million for Years 2012 through
2021 and % CAGR
Table 79: UK 18-Year Perspective for Beverage Packaging by
Beverage Type - Percentage Breakdown of Value Sales for
Alcoholic and Non-Alcoholic for the Years 2012, 2023 & 2030
SPAIN
Table 80: Spain Recent Past, Current & Future Analysis for
Beverage Packaging by Material - Plastic, Glass, Metal and
Other Segments - Independent Analysis of Annual Sales in US$
Million for the Years 2022 through 2030 and % CAGR
Table 81: Spain Historic Review for Beverage Packaging by
Material - Plastic, Glass, Metal and Other Segments Markets -
Independent Analysis of Annual Sales in US$ Million for Years
2012 through 2021 and % CAGR
Table 82: Spain 18-Year Perspective for Beverage Packaging by
Material - Percentage Breakdown of Value Sales for Plastic,
Glass, Metal and Other Segments for the Years 2012, 2023 & 2030
Table 83: Spain Recent Past, Current & Future Analysis for
Beverage Packaging by Beverage Type - Alcoholic and
Non-Alcoholic - Independent Analysis of Annual Sales in US$
Million for the Years 2022 through 2030 and % CAGR
Table 84: Spain Historic Review for Beverage Packaging by
Beverage Type - Alcoholic and Non-Alcoholic Markets -
Independent Analysis of Annual Sales in US$ Million for Years
2012 through 2021 and % CAGR
Table 85: Spain 18-Year Perspective for Beverage Packaging by
Beverage Type - Percentage Breakdown of Value Sales for
Alcoholic and Non-Alcoholic for the Years 2012, 2023 & 2030
RUSSIA
Table 86: Russia Recent Past, Current & Future Analysis for
Beverage Packaging by Material - Plastic, Glass, Metal and
Other Segments - Independent Analysis of Annual Sales in US$
Million for the Years 2022 through 2030 and % CAGR
Table 87: Russia Historic Review for Beverage Packaging by
Material - Plastic, Glass, Metal and Other Segments Markets -
Independent Analysis of Annual Sales in US$ Million for Years
2012 through 2021 and % CAGR
Table 88: Russia 18-Year Perspective for Beverage Packaging by
Material - Percentage Breakdown of Value Sales for Plastic,
Glass, Metal and Other Segments for the Years 2012, 2023 & 2030
Table 89: Russia Recent Past, Current & Future Analysis for
Beverage Packaging by Beverage Type - Alcoholic and
Non-Alcoholic - Independent Analysis of Annual Sales in US$
Million for the Years 2022 through 2030 and % CAGR
Table 90: Russia Historic Review for Beverage Packaging by
Beverage Type - Alcoholic and Non-Alcoholic Markets -
Independent Analysis of Annual Sales in US$ Million for Years
2012 through 2021 and % CAGR
Table 91: Russia 18-Year Perspective for Beverage Packaging by
Beverage Type - Percentage Breakdown of Value Sales for
Alcoholic and Non-Alcoholic for the Years 2012, 2023 & 2030
REST OF EUROPE
Table 92: Rest of Europe Recent Past, Current & Future Analysis
for Beverage Packaging by Material - Plastic, Glass, Metal and
Other Segments - Independent Analysis of Annual Sales in US$
Million for the Years 2022 through 2030 and % CAGR
Table 93: Rest of Europe Historic Review for Beverage Packaging
by Material - Plastic, Glass, Metal and Other Segments Markets -
Independent Analysis of Annual Sales in US$ Million for Years
2012 through 2021 and % CAGR
Table 94: Rest of Europe 18-Year Perspective for Beverage
Packaging by Material - Percentage Breakdown of Value Sales for
Plastic, Glass, Metal and Other Segments for the Years 2012,
2023 & 2030
Table 95: Rest of Europe Recent Past, Current & Future Analysis
for Beverage Packaging by Beverage Type - Alcoholic and
Non-Alcoholic - Independent Analysis of Annual Sales in US$
Million for the Years 2022 through 2030 and % CAGR
Table 96: Rest of Europe Historic Review for Beverage Packaging
by Beverage Type - Alcoholic and Non-Alcoholic Markets -
Independent Analysis of Annual Sales in US$ Million for Years
2012 through 2021 and % CAGR
Table 97: Rest of Europe 18-Year Perspective for Beverage
Packaging by Beverage Type - Percentage Breakdown of Value
Sales for Alcoholic and Non-Alcoholic for the Years 2012, 2023 &
2030
ASIA-PACIFIC
Beverage Packaging Market Presence - Strong/Active/Niche/
Trivial - Key Competitors in Asia-Pacific for 2023 (E)
Table 98: Asia-Pacific Recent Past, Current & Future Analysis
for Beverage Packaging by Geographic Region - Australia, India,
South Korea and Rest of Asia-Pacific Markets - Independent
Analysis of Annual Sales in US$ Million for Years 2022 through
2030 and % CAGR
Table 99: Asia-Pacific Historic Review for Beverage Packaging
by Geographic Region - Australia, India, South Korea and Rest
of Asia-Pacific Markets - Independent Analysis of Annual Sales
in US$ Million for Years 2012 through 2021 and % CAGR
Table 100: Asia-Pacific 18-Year Perspective for Beverage
Packaging by Geographic Region - Percentage Breakdown of Value
Sales for Australia, India, South Korea and Rest of
Asia-Pacific Markets for Years 2012, 2023 & 2030
Table 101: Asia-Pacific Recent Past, Current & Future Analysis
for Beverage Packaging by Material - Plastic, Glass, Metal and
Other Segments - Independent Analysis of Annual Sales in US$
Million for the Years 2022 through 2030 and % CAGR
Table 102: Asia-Pacific Historic Review for Beverage Packaging
by Material - Plastic, Glass, Metal and Other Segments Markets -
Independent Analysis of Annual Sales in US$ Million for Years
2012 through 2021 and % CAGR
Table 103: Asia-Pacific 18-Year Perspective for Beverage
Packaging by Material - Percentage Breakdown of Value Sales for
Plastic, Glass, Metal and Other Segments for the Years 2012,
2023 & 2030
Table 104: Asia-Pacific Recent Past, Current & Future Analysis
for Beverage Packaging by Beverage Type - Alcoholic and
Non-Alcoholic - Independent Analysis of Annual Sales in US$
Million for the Years 2022 through 2030 and % CAGR
Table 105: Asia-Pacific Historic Review for Beverage Packaging
Please contact our Customer Support Center to get the complete Table of Contents
Read the full report: https://www.reportlinker.com/p0552757/?utm_source=PRN
About Reportlinker
ReportLinker is an award-winning market research solution. Reportlinker finds and organizes the latest industry data so you get all the market research you need - instantly, in one place.
Contact Clare: clare@reportlinker.com
US: (339)-368-6001
Intl: +1 339-368-6001
View original content to download multimedia:https://www.prnewswire.com/news-releases/global-beverage-packaging-market-to-reach-204-4-billion-by-2030--301743318.html
SOURCE Reportlinker
Uncategorized
February Employment Situation
By Paul Gomme and Peter Rupert The establishment data from the BLS showed a 275,000 increase in payroll employment for February, outpacing the 230,000…
Share this:


By Paul Gomme and Peter Rupert
The establishment data from the BLS showed a 275,000 increase in payroll employment for February, outpacing the 230,000 average over the previous 12 months. The payroll data for January and December were revised down by a total of 167,000. The private sector added 223,000 new jobs, the largest gain since May of last year.

Temporary help services employment continues a steep decline after a sharp post-pandemic rise.


Average hours of work increased from 34.2 to 34.3. The increase, along with the 223,000 private employment increase led to a hefty increase in total hours of 5.6% at an annualized rate, also the largest increase since May of last year.

The establishment report, once again, beat “expectations;” the WSJ survey of economists was 198,000. Other than the downward revisions, mentioned above, another bit of negative news was a smallish increase in wage growth, from $34.52 to $34.57.

The household survey shows that the labor force increased 150,000, a drop in employment of 184,000 and an increase in the number of unemployed persons of 334,000. The labor force participation rate held steady at 62.5, the employment to population ratio decreased from 60.2 to 60.1 and the unemployment rate increased from 3.66 to 3.86. Remember that the unemployment rate is the number of unemployed relative to the labor force (the number employed plus the number unemployed). Consequently, the unemployment rate can go up if the number of unemployed rises holding fixed the labor force, or if the labor force shrinks holding the number unemployed unchanged. An increase in the unemployment rate is not necessarily a bad thing: it may reflect a strong labor market drawing “marginally attached” individuals from outside the labor force. Indeed, there was a 96,000 decline in those workers.


Earlier in the week, the BLS announced JOLTS (Job Openings and Labor Turnover Survey) data for January. There isn’t much to report here as the job openings changed little at 8.9 million, the number of hires and total separations were little changed at 5.7 million and 5.3 million, respectively.

As has been the case for the last couple of years, the number of job openings remains higher than the number of unemployed persons.

Also earlier in the week the BLS announced that productivity increased 3.2% in the 4th quarter with output rising 3.5% and hours of work rising 0.3%.

The bottom line is that the labor market continues its surprisingly (to some) strong performance, once again proving stronger than many had expected. This strength makes it difficult to justify any interest rate cuts soon, particularly given the recent inflation spike.
unemployment pandemic unemploymentUncategorized
Mortgage rates fall as labor market normalizes
Jobless claims show an expanding economy. We will only be in a recession once jobless claims exceed 323,000 on a four-week moving average.
Share this:


Everyone was waiting to see if this week’s jobs report would send mortgage rates higher, which is what happened last month. Instead, the 10-year yield had a muted response after the headline number beat estimates, but we have negative job revisions from previous months. The Federal Reserve’s fear of wage growth spiraling out of control hasn’t materialized for over two years now and the unemployment rate ticked up to 3.9%. For now, we can say the labor market isn’t tight anymore, but it’s also not breaking.
The key labor data line in this expansion is the weekly jobless claims report. Jobless claims show an expanding economy that has not lost jobs yet. We will only be in a recession once jobless claims exceed 323,000 on a four-week moving average.
From the Fed: In the week ended March 2, initial claims for unemployment insurance benefits were flat, at 217,000. The four-week moving average declined slightly by 750, to 212,250
Below is an explanation of how we got here with the labor market, which all started during COVID-19.
1. I wrote the COVID-19 recovery model on April 7, 2020, and retired it on Dec. 9, 2020. By that time, the upfront recovery phase was done, and I needed to model out when we would get the jobs lost back.
2. Early in the labor market recovery, when we saw weaker job reports, I doubled and tripled down on my assertion that job openings would get to 10 million in this recovery. Job openings rose as high as to 12 million and are currently over 9 million. Even with the massive miss on a job report in May 2021, I didn’t waver.
Currently, the jobs openings, quit percentage and hires data are below pre-COVID-19 levels, which means the labor market isn’t as tight as it once was, and this is why the employment cost index has been slowing data to move along the quits percentage.

3. I wrote that we should get back all the jobs lost to COVID-19 by September of 2022. At the time this would be a speedy labor market recovery, and it happened on schedule, too
Total employment data
4. This is the key one for right now: If COVID-19 hadn’t happened, we would have between 157 million and 159 million jobs today, which would have been in line with the job growth rate in February 2020. Today, we are at 157,808,000. This is important because job growth should be cooling down now. We are more in line with where the labor market should be when averaging 140K-165K monthly. So for now, the fact that we aren’t trending between 140K-165K means we still have a bit more recovery kick left before we get down to those levels.

From BLS: Total nonfarm payroll employment rose by 275,000 in February, and the unemployment rate increased to 3.9 percent, the U.S. Bureau of Labor Statistics reported today. Job gains occurred in health care, in government, in food services and drinking places, in social assistance, and in transportation and warehousing.
Here are the jobs that were created and lost in the previous month:

In this jobs report, the unemployment rate for education levels looks like this:
- Less than a high school diploma: 6.1%
- High school graduate and no college: 4.2%
- Some college or associate degree: 3.1%
- Bachelor’s degree or higher: 2.2%

Today’s report has continued the trend of the labor data beating my expectations, only because I am looking for the jobs data to slow down to a level of 140K-165K, which hasn’t happened yet. I wouldn’t categorize the labor market as being tight anymore because of the quits ratio and the hires data in the job openings report. This also shows itself in the employment cost index as well. These are key data lines for the Fed and the reason we are going to see three rate cuts this year.
recession unemployment covid-19 fed federal reserve mortgage rates recession recovery unemploymentUncategorized
Inside The Most Ridiculous Jobs Report In History: Record 1.2 Million Immigrant Jobs Added In One Month
Inside The Most Ridiculous Jobs Report In History: Record 1.2 Million Immigrant Jobs Added In One Month
Last month we though that the January…
Share this:


Last month we though that the January jobs report was the "most ridiculous in recent history" but, boy, were we wrong because this morning the Biden department of goalseeked propaganda (aka BLS) published the February jobs report, and holy crap was that something else. Even Goebbels would blush.
What happened? Let's take a closer look.
On the surface, it was (almost) another blockbuster jobs report, certainly one which nobody expected, or rather just one bank out of 76 expected. Starting at the top, the BLS reported that in February the US unexpectedly added 275K jobs, with just one research analyst (from Dai-Ichi Research) expecting a higher number.
Some context: after last month's record 4-sigma beat, today's print was "only" 3 sigma higher than estimates. Needless to say, two multiple sigma beats in a row used to only happen in the USSR... and now in the US, apparently.

Before we go any further, a quick note on what last month we said was "the most ridiculous jobs report in recent history": it appears the BLS read our comments and decided to stop beclowing itself. It did that by slashing last month's ridiculous print by over a third, and revising what was originally reported as a massive 353K beat to just 229K, a 124K revision, which was the biggest one-month negative revision in two years!

Of course, that does not mean that this month's jobs print won't be revised lower: it will be, and not just that month but every other month until the November election because that's the only tool left in the Biden admin's box: pretend the economic and jobs are strong, then revise them sharply lower the next month, something we pointed out first last summer and which has not failed to disappoint once.
In the past month the Biden department of goalseeking stuff higher before revising it lower, has revised the following data sharply lower:
— zerohedge (@zerohedge) August 30, 2023
- Jobs
- JOLTS
- New Home sales
- Housing Starts and Permits
- Industrial Production
- PCE and core PCE
To be fair, not every aspect of the jobs report was stellar (after all, the BLS had to give it some vague credibility). Take the unemployment rate, after flatlining between 3.4% and 3.8% for two years - and thus denying expectations from Sahm's Rule that a recession may have already started - in February the unemployment rate unexpectedly jumped to 3.9%, the highest since February 2022 (with Black unemployment spiking by 0.3% to 5.6%, an indicator which the Biden admin will quickly slam as widespread economic racism or something).

And then there were average hourly earnings, which after surging 0.6% MoM in January (since revised to 0.5%) and spooking markets that wage growth is so hot, the Fed will have no choice but to delay cuts, in February the number tumbled to just 0.1%, the lowest in two years...

... for one simple reason: last month's average wage surge had nothing to do with actual wages, and everything to do with the BLS estimate of hours worked (which is the denominator in the average wage calculation) which last month tumbled to just 34.1 (we were led to believe) the lowest since the covid pandemic...

... but has since been revised higher while the February print rose even more, to 34.3, hence why the latest average wage data was once again a product not of wages going up, but of how long Americans worked in any weekly period, in this case higher from 34.1 to 34.3, an increase which has a major impact on the average calculation.

While the above data points were examples of some latent weakness in the latest report, perhaps meant to give it a sheen of veracity, it was everything else in the report that was a problem starting with the BLS's latest choice of seasonal adjustments (after last month's wholesale revision), which have gone from merely laughable to full clownshow, as the following comparison between the monthly change in BLS and ADP payrolls shows. The trend is clear: the Biden admin numbers are now clearly rising even as the impartial ADP (which directly logs employment numbers at the company level and is far more accurate), shows an accelerating slowdown.

But it's more than just the Biden admin hanging its "success" on seasonal adjustments: when one digs deeper inside the jobs report, all sorts of ugly things emerge... such as the growing unprecedented divergence between the Establishment (payrolls) survey and much more accurate Household (actual employment) survey. To wit, while in January the BLS claims 275K payrolls were added, the Household survey found that the number of actually employed workers dropped for the third straight month (and 4 in the past 5), this time by 184K (from 161.152K to 160.968K).

This means that while the Payrolls series hits new all time highs every month since December 2020 (when according to the BLS the US had its last month of payrolls losses), the level of Employment has not budged in the past year. Worse, as shown in the chart below, such a gaping divergence has opened between the two series in the past 4 years, that the number of Employed workers would need to soar by 9 million (!) to catch up to what Payrolls claims is the employment situation.

There's more: shifting from a quantitative to a qualitative assessment, reveals just how ugly the composition of "new jobs" has been. Consider this: the BLS reports that in February 2024, the US had 132.9 million full-time jobs and 27.9 million part-time jobs. Well, that's great... until you look back one year and find that in February 2023 the US had 133.2 million full-time jobs, or more than it does one year later! And yes, all the job growth since then has been in part-time jobs, which have increased by 921K since February 2023 (from 27.020 million to 27.941 million).

Here is a summary of the labor composition in the past year: all the new jobs have been part-time jobs!

But wait there's even more, because now that the primary season is over and we enter the heart of election season and political talking points will be thrown around left and right, especially in the context of the immigration crisis created intentionally by the Biden administration which is hoping to import millions of new Democratic voters (maybe the US can hold the presidential election in Honduras or Guatemala, after all it is their citizens that will be illegally casting the key votes in November), what we find is that in February, the number of native-born workers tumbled again, sliding by a massive 560K to just 129.807 million. Add to this the December data, and we get a near-record 2.4 million plunge in native-born workers in just the past 3 months (only the covid crash was worse)!

The offset? A record 1.2 million foreign-born (read immigrants, both legal and illegal but mostly illegal) workers added in February!

Said otherwise, not only has all job creation in the past 6 years has been exclusively for foreign-born workers...

... but there has been zero job-creation for native born workers since June 2018!

This is a huge issue - especially at a time of an illegal alien flood at the southwest border...

... and is about to become a huge political scandal, because once the inevitable recession finally hits, there will be millions of furious unemployed Americans demanding a more accurate explanation for what happened - i.e., the illegal immigration floodgates that were opened by the Biden admin.
Which is also why Biden's handlers will do everything in their power to insure there is no official recession before November... and why after the election is over, all economic hell will finally break loose. Until then, however, expect the jobs numbers to get even more ridiculous.


Wendy’s has a new deal for daylight savings time haters


Mortgage rates fall as labor market normalizes


Racial and Ethnic Wealth Inequality in the Post‑Pandemic Era


Wealth Inequality by Age in the Post‑Pandemic Era


Interest rates, the best it gets. It’s time to deploy cash


Is the biotech market rally real? Data suggest comeback in private, public markets


February Employment Situation


Shipping company files surprise Chapter 7 bankruptcy, liquidation
Wendy’s teases new $3 offer for upcoming holiday


Economic Earthquake Ahead? The Cracks Are Spreading Fast
-

 Uncategorized2 weeks ago
All Of The Elements Are In Place For An Economic Crisis Of Staggering Proportions
-

 Uncategorized1 month ago
Cathie Wood sells a major tech stock (again)
-

 Uncategorized3 weeks ago
California Counties Could Be Forced To Pay $300 Million To Cover COVID-Era Program
-

 Uncategorized2 weeks ago
Apparel Retailer Express Moving Toward Bankruptcy
-

 Uncategorized3 weeks ago
Industrial Production Decreased 0.1% in January
-

 International2 days ago
Walmart launches clever answer to Target’s new membership program
-

 International2 days ago
EyePoint poaches medical chief from Apellis; Sandoz CFO, longtime BioNTech exec to retire
-

 Uncategorized3 weeks ago
RFK Jr: The Wuhan Cover-Up & The Rise Of The Biowarfare-Industrial Complex