Uncategorized
Surveillance and security equipment market 2023-2027: A descriptive analysis of five forces model, market dynamics, and segmentation – Technavio
Surveillance and security equipment market 2023-2027: A descriptive analysis of five forces model, market dynamics, and segmentation – Technavio
PR Newswire
NEW YORK, Feb. 10, 2023
NEW YORK, Feb. 10, 2023 /PRNewswire/ –According to Technavio, the …
Share this:

Surveillance and security equipment market 2023-2027: A descriptive analysis of five forces model, market dynamics, and segmentation - Technavio
PR Newswire
NEW YORK, Feb. 10, 2023
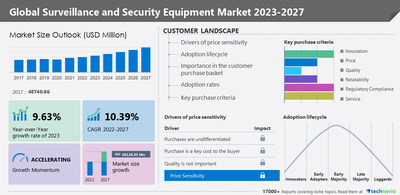
NEW YORK, Feb. 10, 2023 /PRNewswire/ --According to Technavio, the global surveillance and security equipment market size is estimated to grow by USD 38,128.85 million from 2022 to 2027. The market is expected to grow at a CAGR of 10.39%. Moreover, the growth momentum will accelerate. APAC will account for 48% of the growth of the global market during the forecast period. The report includes historic market data from 2017 to 2021. In 2017, the surveillance and security equipment market was valued at USD 48,740.86 million.
For more insights on market, request a sample report
Surveillance and security equipment market - Five forces
The global surveillance and security equipment market is fragmented, and the five forces analysis covers–
- Bargaining Power of Buyers
- The threat of New Entrants
- Threat of Rivalry
- Bargaining Power of Suppliers
- Threat of Substitutes
- For an interpretation of Porter's five forces model – buy the report!
Surveillance and security equipment market – Customer landscape
The report includes the market's adoption lifecycle, from the innovator's stage to the laggard's stage. It focuses on adoption rates in different regions based on penetration. Furthermore, the report also includes key purchase criteria and drivers of price sensitivity to help companies evaluate and develop their growth strategies.
Surveillance and security equipment market - Segmentation assessment
Segment overview
Technavio has segmented the market based on service (commercial and residential) and product (video camera, alarms, and access control).
- The commercial segment will grow at a significant rate during the forecast period. The commercial segment includes establishments such as hotels, restaurants, retail stores, malls, private hospitals, and office complexes. The growing number of commercial establishments and rising awareness about effective asset and access point management to mitigate untoward security incidents increase the use of surveillance and security equipment for commercial purposes.
Geography overview
By geography, the global surveillance and security equipment market is segmented into APAC, North America, Europe, Middle East and Africa, and South America. The report provides actionable insights and estimates the contribution of all regions to the growth of the global surveillance and security equipment market.
- APAC is estimated to account for 48% of the growth of the global market during the forecast period. The growth of the market in APAC is driven by rapid urbanization and industrialization in countries such as China and India. Beijing, China. Many developed countries in the region have adopted surveillance and security equipment due to the technological maturity of industries and the need to safeguard their citizens. These developed countries have a mature end-user base for surveillance and security equipment due to the standardization of industries and the presence of a framework for public safety. The focus on infrastructural development by emerging economies is also driving the growth of the market in the region.
Surveillance and security equipment market – Market dynamics
Key factor driving market growth
- The need to mitigate criminal activities and terrorist attacks is notably driving market growth.
- The increasing number of terrorist attacks, especially in countries such as the US and the UK, has necessitated the deployment of surveillance and security equipment.
- The governments of several countries have imposed stringent regulations that require the installation of surveillance and security equipment in public locations such as hypermarkets, hospitals, airports, ports, and railway stations to curb criminal and terrorist activities.
- Therefore, the deployment of such equipment will drive the growth of the global market during the forecast period.
Leading trends influencing the market
- Predictive crime monitoring is an emerging trend in the market.
- Some surveillance and security equipment employ AI for predictive crime monitoring.
- AI is expected to analyze facial recognition, micro-expressions, and behavioral anomalies to predict the probability of crimes before they are committed.
- Moreover, the advent of predictive crime monitoring will increase the number of strategic partnerships and result in the development of innovative products.
- Hence, advanced AI in conjunction with facial recognition and gait analysis to predict the probability of people committing crimes will drive the growth of the market during the forecast period.
Major challenges hindering the market growth
- The issues related to privacy are major challenges impeding the market growth.
- Public surveillance systems may cover private areas such as apartments and offices without the consent of owners, which would result in a privacy breach.
- In addition, surveillance in stores and streets can also be misused for voyeurism, wherein women may be spied on and sexually exploited.
- Therefore, the line between legitimate monitoring and intrusion is blurred which will hinder the growth of the global market during the forecast period.
What are the key data covered in this surveillance and security equipment market report?
- CAGR of the market during the forecast period
- Detailed information on factors that will drive the growth of the surveillance and security equipment market between 2023 and 2027
- Precise estimation of the surveillance and security equipment market size and its contribution to the market in focus on the parent market
- Accurate predictions about upcoming trends and changes in consumer behavior
- Growth of the surveillance and security equipment industry across APAC, North America, Europe, Middle East and Africa, and South America
- A thorough analysis of the market's competitive landscape and detailed information about vendors
- Comprehensive analysis of factors that will challenge the growth of surveillance and security equipment market vendors
Gain instant access to 17,000+ market research reports.
Technavio's SUBSCRIPTION platform
Related Reports:
The homeland security surveillance camera market share is expected to increase by USD 4.35 billion from 2021 to 2026, and the market's growth momentum will accelerate at a CAGR of 8.66%. The growing focus on public place protection is notably driving the homeland security surveillance camera market growth, although factors such as issues related to privacy may impede the market growth.
The video surveillance market is estimated to grow at a CAGR of 9.33% between 2022 and 2027. The size of the market is forecast to increase by USD 28,796.25 million. The need to mitigate criminal activities and terrorist attacks is notably driving the market growth, although factors such as issues related to privacy may impede the market growth.
Surveillance And Security Equipment Market Scope | |
Report Coverage | Details |
Page number | 171 |
Base year | 2022 |
Historic period | 2017-2021 |
Forecast period | 2023-2027 |
Growth momentum & CAGR | Accelerate at a CAGR of 10.39% |
Market growth 2023-2027 | USD 38,128.85 million |
Market structure | Fragmented |
YoY growth 2022-2023 (%) | 9.63 |
Regional analysis | APAC, North America, Europe, Middle East and Africa, and South America |
Performing market contribution | APAC at 48% |
Key countries | US, China, Japan, Germany, and UK |
Competitive landscape | Leading Vendors, Market Positioning of Vendors, Competitive Strategies, and Industry Risks |
Key companies profiled | Aiphone Corp., Allegion Public Ltd. Co., Canon Inc., Cisco Systems Inc., Costar Video Systems, CP PLUS International, Hangzhou Hikvision Digital Technology Co. Ltd., Hanwha Techwin America, Honeywell International Inc., Johnson Controls International Plc., Motorola Solutions Inc., Panasonic Holdings Corp., Robert Bosch GmbH, Samsung Electronics Co. Ltd., Schneider Electric SE, Sony Group Corp., Teledyne FLIR LLC, Tiandy Technologies Co. Ltd., Zhejiang Dahua Technology Co. Ltd., and Zicom SaaS Pvt. Ltd. |
Market dynamics | Parent market analysis, Market growth inducers and obstacles, Fast-growing and slow-growing segment analysis, COVID-19 impact and recovery analysis and future consumer dynamics, and Market condition analysis for the forecast period. |
Customization purview | If our report has not included the data that you are looking for, you can reach out to our analysts and get segments customized. |
Table of Contents:
1 Executive Summary
- 1.1 Market Overview
- Exhibit 01: Executive Summary – Chart on Market Overview
- Exhibit 02: Executive Summary – Data Table on Market Overview
- Exhibit 03: Executive Summary – Chart on Global Market Characteristics
- Exhibit 04: Executive Summary – Chart on Market by Geography
- Exhibit 05: Executive Summary – Chart on Market Segmentation by Service
- Exhibit 06: Executive Summary – Chart on Market Segmentation by Product
- Exhibit 07: Executive Summary – Chart on Incremental Growth
- Exhibit 08: Executive Summary – Data Table on Incremental Growth
- Exhibit 09: Executive Summary – Chart on Vendor Market Positioning
2 Market Landscape
- 2.1 Market ecosystem
- Exhibit 10: Parent market
- Exhibit 11: Market Characteristics
3 Market Sizing
- 3.1 Market definition
- Exhibit 12: Offerings of vendors included in the market definition
- 3.2 Market segment analysis
- Exhibit 13: Market segments
- 3.3 Market size 2022
- 3.4 Market outlook: Forecast for 2022-2027
- Exhibit 14: Chart on Global - Market size and forecast 2022-2027 ($ million)
- Exhibit 15: Data Table on Global - Market size and forecast 2022-2027 ($ million)
- Exhibit 16: Chart on Global Market: Year-over-year growth 2022-2027 (%)
- Exhibit 17: Data Table on Global Market: Year-over-year growth 2022-2027 (%)
4 Historic Market Size
- 4.1 Global surveillance and security equipment market 2017 - 2021
- Exhibit 18: Historic Market Size – Data Table on Global surveillance and security equipment market 2017 - 2021 ($ million)
- 4.2 Service Segment Analysis 2017 - 2021
- Exhibit 19: Historic Market Size – Service Segment 2017 - 2021 ($ million)
- 4.3 Products Segment Analysis 2017 - 2021
- Exhibit 20: Historic Market Size – Products Segment 2017 - 2021 ($ million)
- 4.4 Geography Segment Analysis 2017 - 2021
- Exhibit 21: Historic Market Size – Geography Segment 2017 - 2021 ($ million)
- 4.5 Country Segment Analysis 2017 - 2021
- Exhibit 22: Historic Market Size – Country Segment 2017 - 2021 ($ million)
5 Five Forces Analysis
- 5.1 Five forces summary
- Exhibit 23: Five forces analysis - Comparison between 2022 and 2027
- 5.2 Bargaining power of buyers
- Exhibit 24: Chart on Bargaining power of buyers – Impact of key factors 2022 and 2027
- 5.3 Bargaining power of suppliers
- Exhibit 25: Bargaining power of suppliers – Impact of key factors in 2022 and 2027
- 5.4 Threat of new entrants
- Exhibit 26: Threat of new entrants – Impact of key factors in 2022 and 2027
- 5.5 Threat of substitutes
- Exhibit 27: Threat of substitutes – Impact of key factors in 2022 and 2027
- 5.6 Threat of rivalry
- Exhibit 28: Threat of rivalry – Impact of key factors in 2022 and 2027
- 5.7 Market condition
- Exhibit 29: Chart on Market condition - Five forces 2022 and 2027
6 Market Segmentation by Service
- 6.1 Market segments
- Exhibit 30: Chart on Service - Market share 2022-2027 (%)
- Exhibit 31: Data Table on Service - Market share 2022-2027 (%)
- 6.2 Comparison by Service
- Exhibit 32: Chart on Comparison by Service
- Exhibit 33: Data Table on Comparison by Service
- 6.3 Commercial - Market size and forecast 2022-2027
- Exhibit 34: Chart on Commercial - Market size and forecast 2022-2027 ($ million)
- Exhibit 35: Data Table on Commercial - Market size and forecast 2022-2027 ($ million)
- Exhibit 36: Chart on Commercial - Year-over-year growth 2022-2027 (%)
- Exhibit 37: Data Table on Commercial - Year-over-year growth 2022-2027 (%)
- 6.4 Residential - Market size and forecast 2022-2027
- Exhibit 38: Chart on Residential - Market size and forecast 2022-2027 ($ million)
- Exhibit 39: Data Table on Residential - Market size and forecast 2022-2027 ($ million)
- Exhibit 40: Chart on Residential - Year-over-year growth 2022-2027 (%)
- Exhibit 41: Data Table on Residential - Year-over-year growth 2022-2027 (%)
- 6.5 Market opportunity by Service
- Exhibit 42: Market opportunity by Service ($ million)
7 Market Segmentation by Product
- 7.1 Market segments
- Exhibit 43: Chart on Product - Market share 2022-2027 (%)
- Exhibit 44: Data Table on Product - Market share 2022-2027 (%)
- 7.2 Comparison by Product
- Exhibit 45: Chart on Comparison by Product
- Exhibit 46: Data Table on Comparison by Product
- 7.3 Video camera - Market size and forecast 2022-2027
- Exhibit 47: Chart on Video camera - Market size and forecast 2022-2027 ($ million)
- Exhibit 48: Data Table on Video camera - Market size and forecast 2022-2027 ($ million)
- Exhibit 49: Chart on Video camera - Year-over-year growth 2022-2027 (%)
- Exhibit 50: Data Table on Video camera - Year-over-year growth 2022-2027 (%)
- 7.4 Alarms - Market size and forecast 2022-2027
- Exhibit 51: Chart on Alarms - Market size and forecast 2022-2027 ($ million)
- Exhibit 52: Data Table on Alarms - Market size and forecast 2022-2027 ($ million)
- Exhibit 53: Chart on Alarms - Year-over-year growth 2022-2027 (%)
- Exhibit 54: Data Table on Alarms - Year-over-year growth 2022-2027 (%)
- 7.5 Access control - Market size and forecast 2022-2027
- Exhibit 55: Chart on Access control - Market size and forecast 2022-2027 ($ million)
- Exhibit 56: Data Table on Access control - Market size and forecast 2022-2027 ($ million)
- Exhibit 57: Chart on Access control - Year-over-year growth 2022-2027 (%)
- Exhibit 58: Data Table on Access control - Year-over-year growth 2022-2027 (%)
- 7.6 Market opportunity by Product
- Exhibit 59: Market opportunity by Product ($ million)
8 Customer Landscape
- 8.1 Customer landscape overview
- Exhibit 60: Analysis of price sensitivity, lifecycle, customer purchase basket, adoption rates, and purchase criteria
9 Geographic Landscape
- 9.1 Geographic segmentation
- Exhibit 61: Chart on Market share by geography 2022-2027 (%)
- Exhibit 62: Data Table on Market share by geography 2022-2027 (%)
- 9.2 Geographic comparison
- Exhibit 63: Chart on Geographic comparison
- Exhibit 64: Data Table on Geographic comparison
- 9.3 APAC - Market size and forecast 2022-2027
- Exhibit 65: Chart on APAC - Market size and forecast 2022-2027 ($ million)
- Exhibit 66: Data Table on APAC - Market size and forecast 2022-2027 ($ million)
- Exhibit 67: Chart on APAC - Year-over-year growth 2022-2027 (%)
- Exhibit 68: Data Table on APAC - Year-over-year growth 2022-2027 (%)
- 9.4 North America - Market size and forecast 2022-2027
- Exhibit 69: Chart on North America - Market size and forecast 2022-2027 ($ million)
- Exhibit 70: Data Table on North America - Market size and forecast 2022-2027 ($ million)
- Exhibit 71: Chart on North America - Year-over-year growth 2022-2027 (%)
- Exhibit 72: Data Table on North America - Year-over-year growth 2022-2027 (%)
- 9.5 Europe - Market size and forecast 2022-2027
- Exhibit 73: Chart on Europe - Market size and forecast 2022-2027 ($ million)
- Exhibit 74: Data Table on Europe - Market size and forecast 2022-2027 ($ million)
- Exhibit 75: Chart on Europe - Year-over-year growth 2022-2027 (%)
- Exhibit 76: Data Table on Europe - Year-over-year growth 2022-2027 (%)
- 9.6 Middle East and Africa - Market size and forecast 2022-2027
- Exhibit 77: Chart on Middle East and Africa - Market size and forecast 2022-2027 ($ million)
- Exhibit 78: Data Table on Middle East and Africa - Market size and forecast 2022-2027 ($ million)
- Exhibit 79: Chart on Middle East and Africa - Year-over-year growth 2022-2027 (%)
- Exhibit 80: Data Table on Middle East and Africa - Year-over-year growth 2022-2027 (%)
- 9.7 South America - Market size and forecast 2022-2027
- Exhibit 81: Chart on South America - Market size and forecast 2022-2027 ($ million)
- Exhibit 82: Data Table on South America - Market size and forecast 2022-2027 ($ million)
- Exhibit 83: Chart on South America - Year-over-year growth 2022-2027 (%)
- Exhibit 84: Data Table on South America - Year-over-year growth 2022-2027 (%)
- 9.8 US - Market size and forecast 2022-2027
- Exhibit 85: Chart on US - Market size and forecast 2022-2027 ($ million)
- Exhibit 86: Data Table on US - Market size and forecast 2022-2027 ($ million)
- Exhibit 87: Chart on US - Year-over-year growth 2022-2027 (%)
- Exhibit 88: Data Table on US - Year-over-year growth 2022-2027 (%)
- 9.9 China - Market size and forecast 2022-2027
- Exhibit 89: Chart on China - Market size and forecast 2022-2027 ($ million)
- Exhibit 90: Data Table on China - Market size and forecast 2022-2027 ($ million)
- Exhibit 91: Chart on China - Year-over-year growth 2022-2027 (%)
- Exhibit 92: Data Table on China - Year-over-year growth 2022-2027 (%)
- 9.10 Germany - Market size and forecast 2022-2027
- Exhibit 93: Chart on Germany - Market size and forecast 2022-2027 ($ million)
- Exhibit 94: Data Table on Germany - Market size and forecast 2022-2027 ($ million)
- Exhibit 95: Chart on Germany - Year-over-year growth 2022-2027 (%)
- Exhibit 96: Data Table on Germany - Year-over-year growth 2022-2027 (%)
- 9.11 Japan - Market size and forecast 2022-2027
- Exhibit 97: Chart on Japan - Market size and forecast 2022-2027 ($ million)
- Exhibit 98: Data Table on Japan - Market size and forecast 2022-2027 ($ million)
- Exhibit 99: Chart on Japan - Year-over-year growth 2022-2027 (%)
- Exhibit 100: Data Table on Japan - Year-over-year growth 2022-2027 (%)
- 9.12 UK - Market size and forecast 2022-2027
- Exhibit 101: Chart on UK - Market size and forecast 2022-2027 ($ million)
- Exhibit 102: Data Table on UK - Market size and forecast 2022-2027 ($ million)
- Exhibit 103: Chart on UK - Year-over-year growth 2022-2027 (%)
- Exhibit 104: Data Table on UK - Year-over-year growth 2022-2027 (%)
- 9.13 Market opportunity by geography
- Exhibit 105: Market opportunity by geography ($ million)
10 Drivers, Challenges, and Trends
- 10.1 Market drivers
- 10.2 Market challenges
- 10.3 Impact of drivers and challenges
- Exhibit 106: Impact of drivers and challenges in 2022 and 2027
- 10.4 Market trends
11 Vendor Landscape
- 11.1 Overview
- 11.2 Vendor landscape
- Exhibit 107: Overview on Criticality of inputs and Factors of differentiation
- 11.3 Landscape disruption
- Exhibit 108: Overview on factors of disruption
- 11.4 Industry risks
- Exhibit 109: Impact of key risks on business
12 Vendor Analysis
- 12.1 Vendors covered
- Exhibit 110: Vendors covered
- 12.2 Market positioning of vendors
- Exhibit 111: Matrix on vendor position and classification
- 12.3 Canon Inc.
- Exhibit 112: Canon Inc. - Overview
- Exhibit 113: Canon Inc. - Business segments
- Exhibit 114: Canon Inc. - Key offerings
- Exhibit 115: Canon Inc. - Segment focus
- 12.4 Cisco Systems Inc.
- Exhibit 116: Cisco Systems Inc. - Overview
- Exhibit 117: Cisco Systems Inc. - Business segments
- Exhibit 118: Cisco Systems Inc. - Key news
- Exhibit 119: Cisco Systems Inc. - Key offerings
- Exhibit 120: Cisco Systems Inc. - Segment focus
- 12.5 Costar Video Systems
- Exhibit 121: Costar Video Systems - Overview
- Exhibit 122: Costar Video Systems - Product / Service
- Exhibit 123: Costar Video Systems - Key offerings
- 12.6 CP PLUS International
- Exhibit 124: CP PLUS International - Overview
- Exhibit 125: CP PLUS International - Product / Service
- Exhibit 126: CP PLUS International - Key offerings
- 12.7 Hangzhou Hikvision Digital Technology Co. Ltd.
- Exhibit 127: Hangzhou Hikvision Digital Technology Co. Ltd. - Overview
- Exhibit 128: Hangzhou Hikvision Digital Technology Co. Ltd. - Product / Service
- Exhibit 129: Hangzhou Hikvision Digital Technology Co. Ltd. - Key offerings
- 12.8 Hanwha Techwin America
- Exhibit 130: Hanwha Techwin America - Overview
- Exhibit 131: Hanwha Techwin America - Product / Service
- Exhibit 132: Hanwha Techwin America - Key offerings
- 12.9 Honeywell International Inc.
- Exhibit 133: Honeywell International Inc. - Overview
- Exhibit 134: Honeywell International Inc. - Business segments
- Exhibit 135: Honeywell International Inc. - Key news
- Exhibit 136: Honeywell International Inc. - Key offerings
- Exhibit 137: Honeywell International Inc. - Segment focus
- 12.10 Johnson Controls International Plc.
- Exhibit 138: Johnson Controls International Plc. - Overview
- Exhibit 139: Johnson Controls International Plc. - Business segments
- Exhibit 140: Johnson Controls International Plc. - Key news
- Exhibit 141: Johnson Controls International Plc. - Key offerings
- Exhibit 142: Johnson Controls International Plc. - Segment focus
- 12.11 Motorola Solutions Inc.
- Exhibit 143: Motorola Solutions Inc. - Overview
- Exhibit 144: Motorola Solutions Inc. - Business segments
- Exhibit 145: Motorola Solutions Inc. - Key offerings
- Exhibit 146: Motorola Solutions Inc. - Segment focus
- 12.12 Panasonic Holdings Corp.
- Exhibit 147: Panasonic Holdings Corp. - Overview
- Exhibit 148: Panasonic Holdings Corp. - Business segments
- Exhibit 149: Panasonic Holdings Corp. - Key news
- Exhibit 150: Panasonic Holdings Corp. - Key offerings
- Exhibit 151: Panasonic Holdings Corp. - Segment focus
- 12.13 Robert Bosch GmbH
- Exhibit 152: Robert Bosch GmbH - Overview
- Exhibit 153: Robert Bosch GmbH - Business segments
- Exhibit 154: Robert Bosch GmbH - Key news
- Exhibit 155: Robert Bosch GmbH - Key offerings
- Exhibit 156: Robert Bosch GmbH - Segment focus
- 12.14 Samsung Electronics Co. Ltd.
- Exhibit 157: Samsung Electronics Co. Ltd. - Overview
- Exhibit 158: Samsung Electronics Co. Ltd. - Business segments
- Exhibit 159: Samsung Electronics Co. Ltd. - Key news
- Exhibit 160: Samsung Electronics Co. Ltd. - Key offerings
- Exhibit 161: Samsung Electronics Co. Ltd. - Segment focus
- 12.15 Schneider Electric SE
- Exhibit 162: Schneider Electric SE - Overview
- Exhibit 163: Schneider Electric SE - Business segments
- Exhibit 164: Schneider Electric SE - Key news
- Exhibit 165: Schneider Electric SE - Key offerings
- Exhibit 166: Schneider Electric SE - Segment focus
- 12.16 Teledyne FLIR LLC
- Exhibit 167: Teledyne FLIR LLC - Overview
- Exhibit 168: Teledyne FLIR LLC - Business segments
- Exhibit 169: Teledyne FLIR LLC - Key offerings
- Exhibit 170: Teledyne FLIR LLC - Segment focus
- 12.17 Zhejiang Dahua Technology Co. Ltd.
- Exhibit 171: Zhejiang Dahua Technology Co. Ltd. - Overview
- Exhibit 172: Zhejiang Dahua Technology Co. Ltd. - Business segments
- Exhibit 173: Zhejiang Dahua Technology Co. Ltd. - Key offerings
- Exhibit 174: Zhejiang Dahua Technology Co. Ltd. - Segment focus
13 Appendix
- 13.1 Scope of the report
- 13.2 Inclusions and exclusions checklist
- Exhibit 175: Inclusions checklist
- Exhibit 176: Exclusions checklist
- 13.3 Currency conversion rates for US$
- Exhibit 177: Currency conversion rates for US$
- 13.4 Research methodology
- Exhibit 178: Research methodology
- Exhibit 179: Validation techniques employed for market sizing
- Exhibit 180: Information sources
- 13.5 List of abbreviations
- Exhibit 181: List of abbreviations
About Us
Technavio is a leading global technology research and advisory company. Their research and analysis focus on emerging market trends and provide actionable insights to help businesses identify market opportunities and develop effective strategies to optimize their market positions. With over 500 specialized analysts, Technavio's report library consists of more than 17,000 reports and counting, covering 800 technologies, spanning across 50 countries. Their client base consists of enterprises of all sizes, including more than 100 Fortune 500 companies. This growing client base relies on Technavio's comprehensive coverage, extensive research, and actionable market insights to identify opportunities in existing and potential markets and assess their competitive positions within changing market scenarios.
Contact
Technavio Research
Jesse Maida
Media & Marketing Executive
US: +1 844 364 1100
UK: +44 203 893 3200
Email: media@technavio.com
Website: www.technavio.com/
")
View original content to download multimedia:https://www.prnewswire.com/news-releases/surveillance-and-security-equipment-market-2023-2027-a-descriptive-analysis-of-five-forces-model-market-dynamics-and-segmentation---technavio-301742990.html
SOURCE Technavio
Uncategorized
One city held a mass passport-getting event
A New Orleans congressman organized a way for people to apply for their passports en masse.
Share this:


While the number of Americans who do not have a passport has dropped steadily from more than 80% in 1990 to just over 50% now, a lack of knowledge around passport requirements still keeps a significant portion of the population away from international travel.
Over the four years that passed since the start of covid-19, passport offices have also been dealing with significant backlog due to the high numbers of people who were looking to get a passport post-pandemic.
Related: Here is why it is (still) taking forever to get a passport
To deal with these concurrent issues, the U.S. State Department recently held a mass passport-getting event in the city of New Orleans. Called the "Passport Acceptance Event," the gathering was held at a local auditorium and invited residents of Louisiana’s 2nd Congressional District to complete a passport application on-site with the help of staff and government workers.
'Come apply for your passport, no appointment is required'
"Hey #LA02," Rep. Troy A. Carter Sr. (D-LA), whose office co-hosted the event alongside the city of New Orleans, wrote to his followers on Instagram (META) . "My office is providing passport services at our #PassportAcceptance event. Come apply for your passport, no appointment is required."
More Travel:
- A new travel term is taking over the internet (and reaching airlines and hotels)
- The 10 best airline stocks to buy now
- Airlines see a new kind of traveler at the front of the plane
The event was held on March 14 from 10 a.m. to 1 p.m. While it was designed for those who are already eligible for U.S. citizenship rather than as a way to help non-citizens with immigration questions, it helped those completing the application for the first time fill out forms and make sure they have the photographs and identity documents they need. The passport offices in New Orleans where one would normally have to bring already-completed forms have also been dealing with lines and would require one to book spots weeks in advance.
These are the countries with the highest-ranking passports in 2024
According to Carter Sr.'s communications team, those who submitted their passport application at the event also received expedited processing of two to three weeks (according to the State Department's website, times for regular processing are currently six to eight weeks).
While Carter Sr.'s office has not released the numbers of people who applied for a passport on March 14, photos from the event show that many took advantage of the opportunity to apply for a passport in a group setting and get expedited processing.
Every couple of months, a new ranking agency puts together a list of the most and least powerful passports in the world based on factors such as visa-free travel and opportunities for cross-border business.
In January, global citizenship and financial advisory firm Arton Capital identified United Arab Emirates as having the most powerful passport in 2024. While the United States topped the list of one such ranking in 2014, worsening relations with a number of countries as well as stricter immigration rules even as other countries have taken strides to create opportunities for investors and digital nomads caused the American passport to slip in recent years.
A UAE passport grants holders visa-free or visa-on-arrival access to 180 of the world’s 198 countries (this calculation includes disputed territories such as Kosovo and Western Sahara) while Americans currently have the same access to 151 countries.
stocks pandemic covid-19 grantsUncategorized
Fast-food chain closes restaurants after Chapter 11 bankruptcy
Several major fast-food chains recently have struggled to keep restaurants open.
Share this:


Competition in the fast-food space has been brutal as operators deal with inflation, consumers who are worried about the economy and their jobs and, in recent months, the falling cost of eating at home.
Add in that many fast-food chains took on more debt during the covid pandemic and that labor costs are rising, and you have a perfect storm of problems.
It's a situation where Restaurant Brands International (QSR) has suffered as much as any company.
Related: Wendy's menu drops a fan favorite item, adds something new
Three major Burger King franchise operators filed for bankruptcy in 2023, and the chain saw hundreds of stores close. It also saw multiple Popeyes franchisees move into bankruptcy, with dozens of locations closing.
RBI also stepped in and purchased one of its key franchisees.
"Carrols is the largest Burger King franchisee in the United States today, operating 1,022 Burger King restaurants in 23 states that generated approximately $1.8 billion of system sales during the 12 months ended Sept. 30, 2023," RBI said in a news release. Carrols also owns and operates 60 Popeyes restaurants in six states."
The multichain company made the move after two of its large franchisees, Premier Kings and Meridian, saw multiple locations not purchased when they reached auction after Chapter 11 bankruptcy filings. In that case, RBI bought select locations but allowed others to close.
Image source: Chen Jianli/Xinhua via Getty
Another fast-food chain faces bankruptcy problems
Bojangles may not be as big a name as Burger King or Popeye's, but it's a popular chain with more than 800 restaurants in eight states.
"Bojangles is a Carolina-born restaurant chain specializing in craveable Southern chicken, biscuits and tea made fresh daily from real recipes, and with a friendly smile," the chain says on its website. "Founded in 1977 as a single location in Charlotte, our beloved brand continues to grow nationwide."
Like RBI, Bojangles uses a franchise model, which makes it dependent on the financial health of its operators. The company ultimately saw all its Maryland locations close due to the financial situation of one of its franchisees.
Unlike. RBI, Bojangles is not public — it was taken private by Durational Capital Management LP and Jordan Co. in 2018 — which means the company does not disclose its financial information to the public.
That makes it hard to know whether overall softness for the brand contributed to the chain seeing its five Maryland locations after a Chapter 11 bankruptcy filing.
Bojangles has a messy bankruptcy situation
Even though the locations still appear on the Bojangles website, they have been shuttered since late 2023. The locations were operated by Salim Kakakhail and Yavir Akbar Durranni. The partners operated under a variety of LLCs, including ABS Network, according to local news channel WUSA9.
The station reported that the owners face a state investigation over complaints of wage theft and fraudulent W2s. In November Durranni and ABS Network filed for bankruptcy in New Jersey, WUSA9 reported.
"Not only do former employees say these men owe them money, WUSA9 learned the former owners owe the state, too, and have over $69,000 in back property taxes."
Former employees also say that the restaurant would regularly purchase fried chicken from Popeyes and Safeway when it ran out in their stores, the station reported.
Bojangles sent the station a comment on the situation.
"The franchisee is no longer in the Bojangles system," the company said. "However, it is important to note in your coverage that franchisees are independent business owners who are licensed to operate a brand but have autonomy over many aspects of their business, including hiring employees and payroll responsibilities."
Kakakhail and Durranni did not respond to multiple requests for comment from WUSA9.
bankruptcy pandemicUncategorized
Industrial Production Increased 0.1% in February
From the Fed: Industrial Production and Capacity Utilization
Industrial production edged up 0.1 percent in February after declining 0.5 percent in January. In February, the output of manufacturing rose 0.8 percent and the index for mining climbed 2.2 p…
Share this:


Industrial production edged up 0.1 percent in February after declining 0.5 percent in January. In February, the output of manufacturing rose 0.8 percent and the index for mining climbed 2.2 percent. Both gains partly reflected recoveries from weather-related declines in January. The index for utilities fell 7.5 percent in February because of warmer-than-typical temperatures. At 102.3 percent of its 2017 average, total industrial production in February was 0.2 percent below its year-earlier level. Capacity utilization for the industrial sector remained at 78.3 percent in February, a rate that is 1.3 percentage points below its long-run (1972–2023) average.Click on graph for larger image.
emphasis added
This graph shows Capacity Utilization. This series is up from the record low set in April 2020, and above the level in February 2020 (pre-pandemic).
Capacity utilization at 78.3% is 1.3% below the average from 1972 to 2022. This was below consensus expectations.
Note: y-axis doesn't start at zero to better show the change.
 The second graph shows industrial production since 1967.
Industrial production increased to 102.3. This is above the pre-pandemic level.
Industrial production was above consensus expectations.


Key shipping company files for Chapter 11 bankruptcy


These Cities Have The Highest (And Lowest) Share Of Unaffordable Neighborhoods In 2024


The Question You Should Ask Whenever You’re Wrong


Tight inventory and frustrated buyers challenge agents in Virginia


Part 1: Current State of the Housing Market; Overview for mid-March 2024


Industrial Production Increased 0.1% in February


Walmart and Target make key self-checkout changes to fight theft


Your financial plan may be riskier without bitcoin
Key shipping company files Chapter 11 bankruptcy


The best real estate coaching programs for 2024
-

 Uncategorized3 weeks ago
All Of The Elements Are In Place For An Economic Crisis Of Staggering Proportions
-

 International1 week ago
EyePoint poaches medical chief from Apellis; Sandoz CFO, longtime BioNTech exec to retire
-

 Uncategorized4 weeks ago
California Counties Could Be Forced To Pay $300 Million To Cover COVID-Era Program
-

 Uncategorized3 weeks ago
Apparel Retailer Express Moving Toward Bankruptcy
-

 Uncategorized4 weeks ago
Industrial Production Decreased 0.1% in January
-

 International1 week ago
Walmart launches clever answer to Target’s new membership program
-

 Spread & Containment2 days ago
IFM’s Hat Trick and Reflections On Option-To-Buy M&A
-

 Uncategorized4 weeks ago
RFK Jr: The Wuhan Cover-Up & The Rise Of The Biowarfare-Industrial Complex