Uncategorized
Genuine Parts Company Reports Results For the Fourth Quarter and Full Year 2022
Genuine Parts Company Reports Results For the Fourth Quarter and Full Year 2022
PR Newswire
ATLANTA, Feb. 23, 2023
Fourth Quarter 2022 Highlights
Sales of $5.5 billion, Up 15.0%Diluted EPS of $1.77Adjusted Diluted EPS of $2.05, Up 14.5%Full Year 20…
Share this:

Genuine Parts Company Reports Results For the Fourth Quarter and Full Year 2022
PR Newswire
ATLANTA, Feb. 23, 2023
Fourth Quarter 2022 Highlights
- Sales of $5.5 billion, Up 15.0%
- Diluted EPS of $1.77
- Adjusted Diluted EPS of $2.05, Up 14.5%
Full Year 2022 Highlights
- Record sales of $22.1 billion, Up 17.1%
- Segment Profit Margin of 9.4%, Up 60 basis points
- Diluted EPS of $8.31
- Adjusted Diluted EPS of $8.34, Up 20.7% and a New Record
- Cash From Operations of $1.5 billion, Up 16.6%; Free Cash Flow of $1.1 billion, Up 13.6%
- Returned $719 million to Shareholders via Cash Dividends and Share Repurchases
2023 Outlook
- Revenue Growth of 4% to 6%
- Diluted EPS of $8.80 to $8.95
ATLANTA, Feb. 23, 2023 /PRNewswire/ -- Genuine Parts Company (NYSE: GPC) announced today its results for the fourth quarter and twelve months ended December 31, 2022.
"The GPC team capped off a record-setting year with a strong fourth quarter highlighted by double-digit sales and earnings growth and continued margin expansion. We are incredibly proud of our progress throughout the year and thankful to our teammates across the globe for their ongoing commitment to excellence," said Paul Donahue, Chairman and Chief Executive Officer of Genuine Parts Company. "Working together, we have been agile in navigating the dynamics of the macro-economy and continue to deliver market share gains and drive positive momentum in our top and bottom-line results."
Fourth Quarter 2022 Results
Sales were $5.5 billion, a 15.0% increase compared to $4.8 billion in the same period of the prior year. The improvement is attributable to an 11.1% increase in comparable sales and an 8.0% benefit from acquisitions, partially offset by a 4.1% unfavorable impact of foreign currency and other.
Net income was $252 million, or a diluted EPS of $1.77. This compares to net income of $256 million, or $1.79 per diluted share in the prior year period.
Adjusted net income, which excludes an expense of $40 million, or $0.28 per diluted share, in non-recurring items primarily associated with a remeasurement of the company's product liability reserve, costs related to the integration of Kaman Distribution Group (KDG) and a loss related to an investment in S.P. Richards, was $292 million, an increase of 13.8% compared to adjusted net income of $256 million for the same period of the prior year. On a per share diluted basis, adjusted net income was $2.05, an increase of 14.5% compared to $1.79 per diluted share in the prior year. Refer to the reconciliation of GAAP net income to adjusted net income for more information.
Fourth Quarter 2022 Segment Highlights
Automotive Parts Group ("Automotive")
Global Automotive sales were $3.4 billion in the fourth quarter, up 7.6% from the same period in 2021, consisting of an 8.2% increase in comparable sales and a 4.8% benefit from acquisitions, net of a 5.4% unfavorable impact of foreign currency and other. Segment profit of $295 million increased 11.0%, with profit margin of 8.6% up 30 basis points from the same period of the prior year.
Industrial Parts Group ("Industrial")
Industrial sales were $2.1 billion, up 29.6% from the same period in 2021, and reflecting a 16.7% increase in comparable sales and a 14.3% contribution from the KDG acquisition, slightly offset by a 1.4% unfavorable impact of foreign currency. Segment profit of $230 million increased 49.8%, with profit margin of 11.0% up 150 basis points from the same period of the prior year.
"The strength in Automotive sales was broad-based, with double-digit total sales growth in local currency in each of our global operations," said Will Stengel, President and Chief Operating Officer. "In addition, Industrial generated its seventh consecutive quarter of double-digit sales comps and tenth consecutive quarter of margin expansion, while continuing to execute well and create value with the accelerated integration of KDG. Our strong fourth quarter and record financial performance in 2022 are testaments to our teams' hard work and dedication to serve our customers."
Full Year 2022 Results
Sales in 2022 were $22.1 billion, a 17.1% increase from $18.9 billion in 2021. Net income for the twelve months was $1.2 billion, or $8.31 per diluted share. Adjusted net income, which excludes an expense of $5 million, or $0.03 per diluted share, in non-recurring items as described above as well as transaction and other costs related to the acquisition of KDG and a gain on the sale of certain real estate recorded in the prior quarters of 2022, was $1.2 billion, or $8.34 per diluted share, an increase of 20.7% compared to $6.91 per diluted share in the prior year. Refer to the reconciliation of GAAP net income to adjusted net income for more information.
Balance Sheet, Cash Flow and Capital Allocation
The company generated cash flow from operations of $1.5 billion in 2022, a 16.6% increase from $1.3 billion in 2021 driven primarily by higher net income and effective management of our working capital. We used $1.7 billion in cash for investing activities, primarily in connection with the acquisition of KDG, in addition to $340 million for capital expenditures. We also had $205 million in cash provided by financing activities, which includes $961 million of net proceeds from debt primarily related to the KDG acquisition. This was partially offset by quarterly dividends of $496 million paid to shareholders and $223 million of share repurchases. Free cash flow was $1.1 billion, a 13.6% increase from $992 million for the twelve months in 2021.
The company ended the quarter and year with $2.2 billion in total liquidity, consisting of $1.5 billion availability on the revolving credit facility and $653 million in cash and cash equivalents.
2023 Outlook
In consideration of several factors, the company is establishing full-year 2023 guidance. The company considered its recent business trends and financial results, current growth plans, strategic initiatives, global economic outlook, geopolitical conflicts and the potential impact on results in establishing its guidance, which is outlined in the table below.
Year Ended 12/31/2023 | ||
Total sales growth | 4% to 6% | |
Automotive sales growth | 4% to 6% | |
Industrial sales growth | 4% to 6% | |
Diluted earnings per share | $8.80 to $8.95 | |
Adjusted diluted earnings per share | $8.80 to $8.95 | |
Effective tax rate | Approx. 25% | |
Net cash provided by operating activities | $1.2 billion to $1.4 billion | |
Free cash flow | $800 million to $1.0 billion |
"We had an exceptional 2022 which included celebrating our 95th year of operations. We have quickly turned our attention to the year ahead and, while the macro-environment remains uncertain, we are confident in our strategic plans to drive sustained sales and earnings growth, continued margin expansion and strong cash flow. We believe our progress in these key areas, combined with a strong balance sheet, position GPC with the financial strength and flexibility to pursue strategic growth opportunities while also returning capital to shareholders," Mr. Donahue concluded.
Non-GAAP Information
This release contains certain financial information not derived in accordance with United States ("U.S.") generally accepted accounting principles ("GAAP"). These items include adjusted net income, adjusted diluted net income per common share and free cash flow. The company believes that the presentation of adjusted net income, adjusted diluted net income per common share and free cash flow, when considered together with the corresponding GAAP financial measures and the reconciliations to those measures, provide meaningful supplemental information to both management and investors that is indicative of the company's core operations. The company considers these metrics useful to investors because they provide greater transparency into management's view and assessment of the company's ongoing operating performance by removing items management believes are not representative of our continuing operations and may distort our longer-term operating trends. We believe these measures are useful and enhance the comparability of our results from period to period and with our competitors, as well as show ongoing results from operations distinct from items that are infrequent or not associated with the company's core operations. The company does not, nor does it suggest investors should, consider such non-GAAP financial measures as superior to, in isolation from, or as a substitute for, GAAP financial information. The company has included a reconciliation of this additional information to the most comparable GAAP measure following the financial statements below.
Comparable Sales
Comparable sales is a key metric that refers to period-over-period comparisons of our sales excluding the impact of acquisitions, foreign currency and other. The company considers this metric useful to investors because it provides greater transparency into management's view and assessment of the company's core ongoing operations. This is a metric that is widely used by analysts, investors and competitors in our industry, although our calculation of the metric may not be comparable to similar measures disclosed by other companies, because not all companies and analysts calculate this metric in the same manner.
Conference Call
Genuine Parts Company will hold a conference call today at 11:00 a.m. Eastern time to discuss the results of the quarter. A supplemental earnings deck will also be available for reference. Interested parties may listen to the call and view the supplemental earnings deck on the company's investor relations website. The call is also available by dialing 888-317-6003, conference ID 0079869. A replay will also be available on the company's website or at 877-344-7529 conference ID 1162108, two hours after the completion of the call.
About Genuine Parts Company
Founded in 1928, Genuine Parts Company is a global service organization engaged in the distribution of automotive and industrial replacement parts. The company's Automotive Parts Group distributes automotive replacement parts in the U.S., Canada, Mexico, Australasia, France, the United Kingdom, Ireland, Germany, Poland, the Netherlands, Belgium, Spain and Portugal. The company's Industrial Parts Group distributes industrial replacement parts in the U.S., Canada, Mexico and Australasia. In total, the company serves its global customers from an extensive network of more than 10,000 locations in 17 countries and has approximately 58,000 employees. Further information is available at www.genpt.com.
Forward Looking Statements
Some statements in this release, as well as in materials the company files with the Securities and Exchange Commission (SEC), release to the public or make available on the company's website, constitute forward-looking statements that are subject to the safe harbor provisions of the Private Securities Litigation Reform Act of 1995. All statements in the future tense and all statements accompanied by words such as "expect," "likely," "outlook," "forecast," "preliminary," "would," "could," "should," "position," "will," "project," "intend," "plan," "on track," "anticipate," "to come," "may," "possible," "assume," or similar expressions are intended to identify such forward-looking statements. These forward-looking statements include the company's view of business and economic trends for the coming year, the company's ability to execute our strategic priorities and capitalize in light of these business and economic trends, and the established full-year 2023 financial guidance for the company provided above. Senior officers may also make verbal statements to analysts, investors, the media and others that are forward-looking.
The company cautions that all forward-looking statements involve risks and uncertainties, and while the company believes that its expectations for the future are reasonable in view of currently available information, you are cautioned not to place undue reliance on our forward-looking statements. Actual results or events may differ materially from those indicated as a result of various important factors. Such factors may include, among other things, changes in general economic conditions, including unemployment, inflation (including the impact of tariffs) or deflation and geopolitical conflicts such as the conflict between Russia and Ukraine; volatility in oil prices; significant cost increases, such as rising fuel and freight expenses; public health emergencies such as the COVID-19 pandemic, including the effects on the financial health of our business partners and customers, on supply chains and our suppliers, on vehicle miles driven as well as other metrics that affect our business, and on access to capital and liquidity provided by the financial and capital markets; our ability to maintain compliance with our debt covenants; our ability to successfully integrate acquired businesses into our operations and to realize the anticipated synergies and benefits; our ability to successfully implement our business initiatives in our two business segments; slowing demand for our products; the ability to maintain favorable supplier arrangements and relationships; changes in national and international legislation or government regulations or policies, including changes to import tariffs, environmental and social policy, infrastructure programs and privacy legislation, and their impact to us, our suppliers and customers; changes in tax policies; volatile exchange rates; our ability to successfully attract and retain employees in the current labor market; uncertain credit markets and other macroeconomic conditions; competitive product, service and pricing pressures; failure or weakness in our disclosure controls and procedures and internal controls over financial reporting, including as a result of the work from home environment; the uncertainties and costs of litigation; disruptions caused by a failure or breach of our information systems, as well as other risks and uncertainties discussed in the company's Annual Report on Form 10-K for 2022 and from time to time in the company's subsequent filings with the SEC.
Forward-looking statements speak only as of the date they are made, and the company undertakes no duty to update any forward-looking statements except as required by law. You are advised, however, to review any further disclosures we make on related subjects in our subsequent Forms 10-K, 10-Q, 8-K and other reports filed with the SEC.
GENUINE PARTS COMPANY AND SUBSIDIARIES | ||||||||
CONSOLIDATED STATEMENTS OF INCOME (LOSS) | ||||||||
(UNAUDITED) | ||||||||
Three Months Ended | Twelve Months Ended | |||||||
(in thousands, except per share data) | 2022 | 2021 | 2022 | 2021 | ||||
Net sales | $ 5,523,650 | $ 4,803,209 | $ 22,095,973 | $ 18,870,510 | ||||
Cost of goods sold | 3,549,959 | 3,109,760 | 14,355,869 | 12,236,374 | ||||
Gross profit | 1,973,691 | 1,693,449 | 7,740,104 | 6,634,136 | ||||
Operating expenses: | ||||||||
Selling, administrative and other expenses | 1,531,883 | 1,279,265 | 5,758,295 | 5,162,506 | ||||
Depreciation and amortization | 87,997 | 72,594 | 347,819 | 290,971 | ||||
Provision for doubtful accounts | 6,252 | 3,509 | 19,791 | 17,739 | ||||
Total operating expenses | 1,626,132 | 1,355,368 | 6,125,905 | 5,471,216 | ||||
Non-operating expenses (income): | ||||||||
Interest expense, net | 15,569 | 14,297 | 73,887 | 62,150 | ||||
Other | (5,393) | (22,122) | (32,290) | (99,576) | ||||
Total non-operating expenses (income) | 10,176 | (7,825) | 41,597 | (37,426) | ||||
Income before income taxes | 337,383 | 345,906 | 1,572,602 | 1,200,346 | ||||
Income taxes | 85,407 | 89,907 | 389,901 | 301,556 | ||||
Net income (loss) | $ 251,976 | $ 255,999 | $ 1,182,701 | $ 898,790 | ||||
Dividends declared per common share | $ 0.895 | $ 0.815 | $ 3.580 | $ 3.260 | ||||
Basic earnings per share | $ 1.79 | $ 1.80 | $ 8.36 | $ 6.27 | ||||
Diluted earnings per share | $ 1.77 | $ 1.79 | $ 8.31 | $ 6.23 | ||||
Weighted average common shares outstanding | 141,049 | 142,275 | 141,468 | 143,435 | ||||
Dilutive effect of stock options and non-vested restricted | 923 | 778 | 854 | 786 | ||||
Weighted average common shares outstanding — | 141,972 | 143,053 | 142,322 | 144,221 | ||||
GENUINE PARTS COMPANY AND SUBSIDIARIES | ||||||||
SEGMENT INFORMATION | ||||||||
(UNAUDITED) | ||||||||
Three Months Ended | Twelve Months Ended | |||||||
(in thousands) | 2022 | 2021 | 2022 | 2021 | ||||
Net sales: | ||||||||
Automotive | $ 3,433,057 | $ 3,190,133 | $ 13,666,634 | $ 12,544,131 | ||||
Industrial | 2,090,593 | 1,613,076 | 8,429,339 | 6,326,379 | ||||
Total net sales | $ 5,523,650 | $ 4,803,209 | $ 22,095,973 | $ 18,870,510 | ||||
Segment profit: | ||||||||
Automotive | $ 295,199 | $ 265,841 | $ 1,191,674 | $ 1,073,427 | ||||
Industrial | 230,306 | 153,773 | 886,636 | 595,232 | ||||
Total segment profit | 525,505 | 419,614 | 2,078,310 | 1,668,659 | ||||
Interest expense, net | (15,568) | (14,297) | (73,886) | (62,150) | ||||
Corporate expense | (81,481) | (44,813) | (269,364) | (174,842) | ||||
Intangible asset amortization | (38,697) | (25,034) | (157,437) | (103,273) | ||||
Other unallocated costs | (52,376) | 10,436 | (5,021) | (128,048) | ||||
Income before income taxes | $ 337,383 | $ 345,906 | $ 1,572,602 | $ 1,200,346 | ||||
The following table presents a summary of the other unallocated costs: | ||||||||
Three Months Ended | Twelve Months Ended | |||||||
(in thousands) | 2022 | 2021 | 2022 | 2021 | ||||
Other unallocated costs: | ||||||||
Gain on sales of real estate | $ — | $ — | $ 102,803 | $ — | ||||
Gain on insurance proceeds | — | 3,862 | 1,507 | 3,862 | ||||
Product liability adjustment | (28,730) | — | (28,730) | — | ||||
Product liability damages award | — | — | — | (77,421) | ||||
Loss on software disposal | — | — | — | (61,063) | ||||
Gain on equity investment | — | 10,229 | — | 10,229 | ||||
Transaction and other costs | (23,646) | (3,655) | (80,601) | (3,655) | ||||
Total other unallocated costs (1) | $ (52,376) | $ 10,436 | $ (5,021) | $ (128,048) | ||||
(1) Refer to the reconciliation of GAAP net income to adjusted net income for explanation of adjustments. |
GENUINE PARTS COMPANY AND SUBSIDIARIES | ||||
CONSOLIDATED BALANCE SHEETS | ||||
(UNAUDITED) | ||||
As of December 31, | ||||
(in thousands, except share and per share data) | 2022 | 2021 | ||
Assets | ||||
Current assets: | ||||
Cash and cash equivalents | $ 653,463 | $ 714,701 | ||
Trade accounts receivable, less allowance for doubtful accounts (2022 – $53,872; | 2,188,868 | 1,797,955 | ||
Merchandise inventories, net | 4,441,649 | 3,889,919 | ||
Prepaid expenses and other current assets | 1,532,759 | 1,353,847 | ||
Total current assets | 8,816,739 | 7,756,422 | ||
Goodwill | 2,588,113 | 1,915,307 | ||
Other intangible assets, net | 1,812,510 | 1,406,401 | ||
Property, plant and equipment, less accumulated depreciation (2022 – $1,435,677; | 1,326,014 | 1,234,399 | ||
Operating lease assets | 1,104,678 | 1,053,689 | ||
Other assets | 847,325 | 985,884 | ||
Total assets | $ 16,495,379 | $ 14,352,102 | ||
Liabilities and equity | ||||
Current liabilities: | ||||
Trade accounts payable | $ 5,456,550 | $ 4,804,939 | ||
Current portion of debt | 252,029 | — | ||
Other current liabilities | 1,851,340 | 1,660,768 | ||
Dividends payable | 126,191 | 115,876 | ||
Total current liabilities | 7,686,110 | 6,581,583 | ||
Long-term debt | 3,076,794 | 2,409,363 | ||
Operating lease liabilities | 836,019 | 789,175 | ||
Pension and other post-retirement benefit liabilities | 197,879 | 265,134 | ||
Deferred tax liabilities | 391,163 | 280,778 | ||
Other long-term liabilities | 502,967 | 522,779 | ||
Equity: | ||||
Preferred stock, par value $1 per share — authorized 10,000,000 shares; none issued | — | — | ||
Common stock, par value $1 per share - authorized 450,000,000 shares; issued and | 140,941 | 142,181 | ||
Additional paid-in capital | 140,324 | 119,975 | ||
Accumulated other comprehensive loss | (1,032,542) | (857,739) | ||
Retained earnings | 4,541,640 | 4,086,325 | ||
Total parent equity | 3,790,363 | 3,490,742 | ||
Noncontrolling interests in subsidiaries | 14,084 | 12,548 | ||
Total equity | 3,804,447 | 3,503,290 | ||
Total liabilities and equity | $ 16,495,379 | $ 14,352,102 | ||
GENUINE PARTS COMPANY AND SUBSIDIARIES | ||||
CONSOLIDATED STATEMENTS OF CASH FLOWS | ||||
(UNAUDITED) | ||||
Year Ended December 31 | ||||
(in thousands) | 2022 | 2021 | ||
Operating activities: | ||||
Net income | $ 1,182,701 | $ 898,790 | ||
Adjustments to reconcile net income to net cash provided by operating activities: | ||||
Depreciation and amortization | 347,819 | 290,971 | ||
Deferred income taxes | 2,220 | 31,676 | ||
Share-based compensation | 38,058 | 25,597 | ||
Gain on sale of real estate | (102,803) | — | ||
Other operating activities | 18,377 | 22,575 | ||
Changes in operating assets and liabilities: | ||||
Trade accounts receivable, net | (244,371) | (258,994) | ||
Merchandise inventories, net | (380,420) | (329,237) | ||
Trade accounts payable | 676,406 | 777,318 | ||
Other assets and liabilities | (71,016) | (200,411) | ||
Net cash provided by operating activities | 1,466,971 | 1,258,285 | ||
Investing activities: | ||||
Purchases of property, plant and equipment | (339,632) | (266,136) | ||
Proceeds from sale of property, plant and equipment | 145,007 | 26,549 | ||
Proceeds from divestitures of businesses | 33,604 | 17,738 | ||
Proceeds from settlement of net investment hedge | 158,441 | — | ||
Acquisitions and other investing activities | (1,681,660) | (284,315) | ||
Net cash used in investing activities | (1,684,240) | (506,164) | ||
Financing activities: | ||||
Proceeds from debt | 5,108,641 | 892,694 | ||
Payments on debt | (4,147,773) | (1,053,423) | ||
Share-based awards exercised | (17,377) | (22,346) | ||
Dividends paid | (495,917) | (465,649) | ||
Purchase of stock | (222,726) | (333,599) | ||
Other financing activities | (19,747) | (7,209) | ||
Net cash provided by (used in) financing activities | 205,101 | (989,532) | ||
Effect of exchange rate changes on cash and cash equivalents | (49,070) | (38,054) | ||
Net decrease in cash and cash equivalents | (61,238) | (275,465) | ||
Cash and cash equivalents at beginning of year | 714,701 | 990,166 | ||
Cash and cash equivalents at end of year | $ 653,463 | $ 714,701 | ||
Supplemental disclosures of cash flow information | ||||
Cash paid during the year for: | ||||
Income taxes | $ 362,859 | $ 305,326 | ||
Interest | $ 73,368 | $ 65,732 | ||
GENUINE PARTS COMPANY AND SUBSIDIARIES | ||||||||
RECONCILIATION OF GAAP NET INCOME TO ADJUSTED NET INCOME AND GAAP DILUTED NET INCOME PER | ||||||||
(UNAUDITED) | ||||||||
Three Months Ended | Twelve Months Ended | |||||||
(in thousands) | 2022 | 2021 | 2022 | 2021 | ||||
GAAP net income | $ 251,976 | $ 255,999 | $ 1,182,701 | $ 898,790 | ||||
Adjustments: | ||||||||
Gain on sales of real estate (1) | — | — | (102,803) | — | ||||
Gain on insurance proceeds (2) | — | (3,862) | (1,507) | (3,862) | ||||
Product liability adjustment (3) | 28,730 | — | 28,730 | — | ||||
Product liability damages award (4) | — | — | — | 77,421 | ||||
Loss on software disposal (5) | — | — | — | 61,063 | ||||
Gain on equity investment (6) | — | (10,229) | — | (10,229) | ||||
Transaction and other costs (7) | 23,646 | 3,655 | 80,601 | 3,655 | ||||
Total adjustments | 52,376 | (10,436) | 5,021 | 128,048 | ||||
Tax impact of adjustments | (12,788) | 10,661 | (137) | (29,828) | ||||
Adjusted net income | $ 291,564 | $ 256,224 | $ 1,187,585 | $ 997,010 | ||||
The table below represent amounts per common share assuming dilution: | ||||||||
Three Months Ended | Twelve Months Ended | |||||||
(in thousands, except per share data) | 2022 | 2021 | 2022 | 2021 | ||||
GAAP net income per common share | $ 1.77 | $ 1.79 | $ 8.31 | $ 6.23 | ||||
Adjustments: | ||||||||
Gain on sales of real estate (1) | — | — | (0.72) | — | ||||
Gain on insurance proceeds (2) | — | (0.03) | (0.01) | (0.03) | ||||
Product liability adjustment (3) | 0.20 | — | 0.20 | — | ||||
Product liability damages award (4) | — | — | — | 0.54 | ||||
Loss on software disposal (5) | — | — | — | 0.42 | ||||
Gain on equity investment (6) | — | (0.07) | — | (0.07) | ||||
Transaction and other costs (7) | 0.17 | 0.03 | 0.56 | 0.03 | ||||
Total adjustments | 0.37 | (0.07) | 0.03 | 0.89 | ||||
Tax impact of adjustments | (0.09) | 0.07 | — | (0.21) | ||||
Adjusted diluted net income per common share | $ 2.05 | $ 1.79 | $ 8.34 | $ 6.91 | ||||
Weighted average common shares outstanding - assuming | 141,972 | 143,053 | 142,322 | 144,221 | ||||
The table below clarifies where the items that have been adjusted above to improve comparability of the financial | ||||||||
Three Months Ended | Twelve Months Ended | |||||||
(in thousands) | 2022 | 2021 | 2022 | 2021 | ||||
Cost of goods sold | $ — | $ — | $ 5,000 | $ — | ||||
Selling, administrative and other expenses | 43,376 | 3,655 | (7,472) | 142,139 | ||||
Restructuring costs | — | — | — | — | ||||
Goodwill impairment charge | — | — | — | — | ||||
Non-operating (income): Other | 9,000 | (14,091) | 7,493 | (14,091) | ||||
Total adjustments | $ 52,376 | $ (10,436) | $ 5,021 | $ 128,048 | ||||
(1) | Adjustment reflects a gain on the sale of real estate that had been leased to S.P. Richards. |
(2) | Adjustment reflects insurance recoveries in excess of losses incurred on inventory, property, plant and equipment and other fire-related costs. |
(3) | Adjustment to remeasure the product liability reserve for a revised estimate of the number of claims to be incurred in future periods, among other assumptions. |
(4) | Adjustment reflects damages reinstated by the Washington Supreme Court order on July 8, 2021 in connection with a 2017 automotive product liability claim. |
(5) | Adjustment reflects a loss on an internally developed software project that was disposed of due to a change in management strategy related to advances in alternative technologies. |
(6) | Adjustment relates to gains recognized upon remeasurement of certain equity investments to fair value upon acquiring the remaining equity of those entities. |
(7) | Adjustment for 2022 primarily includes costs of $67 million associated with the January 3, 2022 acquisition and integration of KDG which includes a $17 million impairment charge. The impairment charge was driven by a decision to retire certain legacy trade names, classified as other intangible assets, prior to the end of their estimated useful lives as part of executing our KDG integration and rebranding strategy. Separately, this adjustment includes an $11 million loss related to an investment. Adjustment for 2021 include transaction and other costs related to acquisitions. |
GENUINE PARTS COMPANY AND SUBSIDIARIES | ||||||||||
CHANGE IN NET SALES SUMMARY | ||||||||||
(UNAUDITED) | ||||||||||
Three Months Ended December 31, 2022 | ||||||||||
Comparable | Acquisitions | Foreign | Other | GAAP Total | ||||||
Automotive | 8.2 % | 4.8 % | (5.5) % | 0.1 % | 7.6 % | |||||
Industrial | 16.7 % | 14.3 % | (1.4) % | — % | 29.6 % | |||||
Total Net Sales | 11.1 % | 8.0 % | (4.2) % | 0.1 % | 15.0 % | |||||
Twelve Months Ended December 31, 2022 | ||||||||||
Comparable | Acquisitions | Foreign | Other | GAAP Total | ||||||
Automotive | 9.0 % | 4.5 % | (4.5) % | (0.1) % | 8.9 % | |||||
Industrial | 17.3 % | 16.8 % | (0.9) % | — % | 33.2 % | |||||
Total Net Sales | 11.8 % | 8.6 % | (3.3) % | — % | 17.1 % | |||||
GENUINE PARTS COMPANY AND SUBSIDIARIES | ||||
RECONCILIATION OF GAAP NET CASH PROVIDED BY OPERATING ACTIVITIES TO FREE CASH FLOW | ||||
(UNAUDITED) | ||||
Twelve Months Ended December 31, | ||||
(in thousands) | 2022 | 2021 | ||
Net cash provided by operating activities | $ 1,466,971 | $ 1,258,285 | ||
Purchases of property, plant and equipment | (339,632) | (266,136) | ||
Free Cash Flow | $ 1,127,339 | $ 992,149 | ||
View original content to download multimedia:https://www.prnewswire.com/news-releases/genuine-parts-company-reports-results-for-the-fourth-quarter-and-full-year-2022-301754044.html
SOURCE Genuine Parts Company
Uncategorized
Part 1: Current State of the Housing Market; Overview for mid-March 2024
Today, in the Calculated Risk Real Estate Newsletter: Part 1: Current State of the Housing Market; Overview for mid-March 2024
A brief excerpt: This 2-part overview for mid-March provides a snapshot of the current housing market.
I always like to star…
Share this:

A brief excerpt:
This 2-part overview for mid-March provides a snapshot of the current housing market.There is much more in the article.
I always like to start with inventory, since inventory usually tells the tale!
...
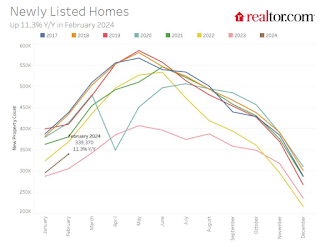
Here is a graph of new listing from Realtor.com’s February 2024 Monthly Housing Market Trends Report showing new listings were up 11.3% year-over-year in February. This is still well below pre-pandemic levels. From Realtor.com:
However, providing a boost to overall inventory, sellers turned out in higher numbers this February as newly listed homes were 11.3% above last year’s levels. This marked the fourth month of increasing listing activity after a 17-month streak of decline.Note the seasonality for new listings. December and January are seasonally the weakest months of the year for new listings, followed by February and November. New listings will be up year-over-year in 2024, but we will have to wait for the March and April data to see how close new listings are to normal levels.
There are always people that need to sell due to the so-called 3 D’s: Death, Divorce, and Disease. Also, in certain times, some homeowners will need to sell due to unemployment or excessive debt (neither is much of an issue right now).
And there are homeowners who want to sell for a number of reasons: upsizing (more babies), downsizing, moving for a new job, or moving to a nicer home or location (move-up buyers). It is some of the “want to sell” group that has been locked in with the golden handcuffs over the last couple of years, since it is financially difficult to move when your current mortgage rate is around 3%, and your new mortgage rate will be in the 6 1/2% to 7% range.
But time is a factor for this “want to sell” group, and eventually some of them will take the plunge. That is probably why we are seeing more new listings now.
Uncategorized
Pharma industry reputation remains steady at a ‘new normal’ after Covid, Harris Poll finds
The pharma industry is hanging on to reputation gains notched during the Covid-19 pandemic. Positive perception of the pharma industry is steady at 45%…
Share this:


The pharma industry is hanging on to reputation gains notched during the Covid-19 pandemic. Positive perception of the pharma industry is steady at 45% of US respondents in 2023, according to the latest Harris Poll data. That’s exactly the same as the previous year.
Pharma’s highest point was in February 2021 — as Covid vaccines began to roll out — with a 62% positive US perception, and helping the industry land at an average 55% positive sentiment at the end of the year in Harris’ 2021 annual assessment of industries. The pharma industry’s reputation hit its most recent low at 32% in 2019, but it had hovered around 30% for more than a decade prior.
“Pharma has sustained a lot of the gains, now basically one and half times higher than pre-Covid,” said Harris Poll managing director Rob Jekielek. “There is a question mark around how sustained it will be, but right now it feels like a new normal.”
The Harris survey spans 11 global markets and covers 13 industries. Pharma perception is even better abroad, with an average 58% of respondents notching favorable sentiments in 2023, just a slight slip from 60% in each of the two previous years.
Pharma’s solid global reputation puts it in the middle of the pack among international industries, ranking higher than government at 37% positive, insurance at 48%, financial services at 51% and health insurance at 52%. Pharma ranks just behind automotive (62%), manufacturing (63%) and consumer products (63%), although it lags behind leading industries like tech at 75% positive in the first spot, followed by grocery at 67%.
The bright spotlight on the pharma industry during Covid vaccine and drug development boosted its reputation, but Jekielek said there’s maybe an argument to be made that pharma is continuing to develop innovative drugs outside that spotlight.
“When you look at pharma reputation during Covid, you have clear sense of a very dynamic industry working very quickly and getting therapies and products to market. If you’re looking at things happening now, you could argue that pharma still probably doesn’t get enough credit for its advances, for example, in oncology treatments,” he said.
vaccine pandemic covid-19Uncategorized
Q4 Update: Delinquencies, Foreclosures and REO
Today, in the Calculated Risk Real Estate Newsletter: Q4 Update: Delinquencies, Foreclosures and REO
A brief excerpt: I’ve argued repeatedly that we would NOT see a surge in foreclosures that would significantly impact house prices (as happened followi…
Share this:


A brief excerpt:
I’ve argued repeatedly that we would NOT see a surge in foreclosures that would significantly impact house prices (as happened following the housing bubble). The two key reasons are mortgage lending has been solid, and most homeowners have substantial equity in their homes..There is much more in the article. You can subscribe at https://calculatedrisk.substack.com/ mortgage rates real estate mortgages pandemic interest rates
...
And on mortgage rates, here is some data from the FHFA’s National Mortgage Database showing the distribution of interest rates on closed-end, fixed-rate 1-4 family mortgages outstanding at the end of each quarter since Q1 2013 through Q3 2023 (Q4 2023 data will be released in a two weeks).
This shows the surge in the percent of loans under 3%, and also under 4%, starting in early 2020 as mortgage rates declined sharply during the pandemic. Currently 22.6% of loans are under 3%, 59.4% are under 4%, and 78.7% are under 5%.
With substantial equity, and low mortgage rates (mostly at a fixed rates), few homeowners will have financial difficulties.


Q4 Update: Delinquencies, Foreclosures and REO


Pharma industry reputation remains steady at a ‘new normal’ after Covid, Harris Poll finds


Digital Currency And Gold As Speculative Warnings


Part 1: Current State of the Housing Market; Overview for mid-March 2024


Bougie Broke The Financial Reality Behind The Facade


Aging at AACR Annual Meeting 2024


The most potent labor market indicator of all is still strongly positive


‘Bougie Broke’ – The Financial Reality Behind The Facade


Bitcoin on Wheels: The Story of Bitcoinetas


Futures Flat At All-Time High As Bitcoin Surges To Record, Oil Rises
-

 Uncategorized3 weeks ago
All Of The Elements Are In Place For An Economic Crisis Of Staggering Proportions
-

 International5 days ago
EyePoint poaches medical chief from Apellis; Sandoz CFO, longtime BioNTech exec to retire
-

 Uncategorized4 weeks ago
California Counties Could Be Forced To Pay $300 Million To Cover COVID-Era Program
-

 Uncategorized3 weeks ago
Apparel Retailer Express Moving Toward Bankruptcy
-

 Uncategorized4 weeks ago
Industrial Production Decreased 0.1% in January
-

 International5 days ago
Walmart launches clever answer to Target’s new membership program
-

 Uncategorized4 weeks ago
RFK Jr: The Wuhan Cover-Up & The Rise Of The Biowarfare-Industrial Complex
-

 Uncategorized3 weeks ago
GOP Efforts To Shore Up Election Security In Swing States Face Challenges