International
Futures Tick Higher Ahead Of Key PCE Print
Futures Tick Higher Ahead Of Key PCE Print
US stock futures edged higher after Thursday’s slump as investors weighed strong job data and…
Share this:

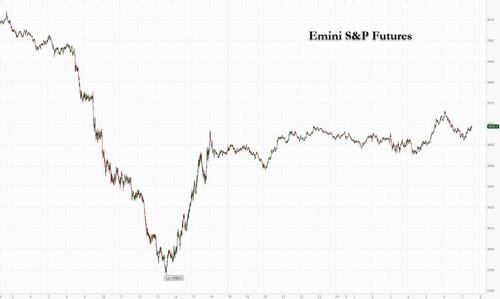
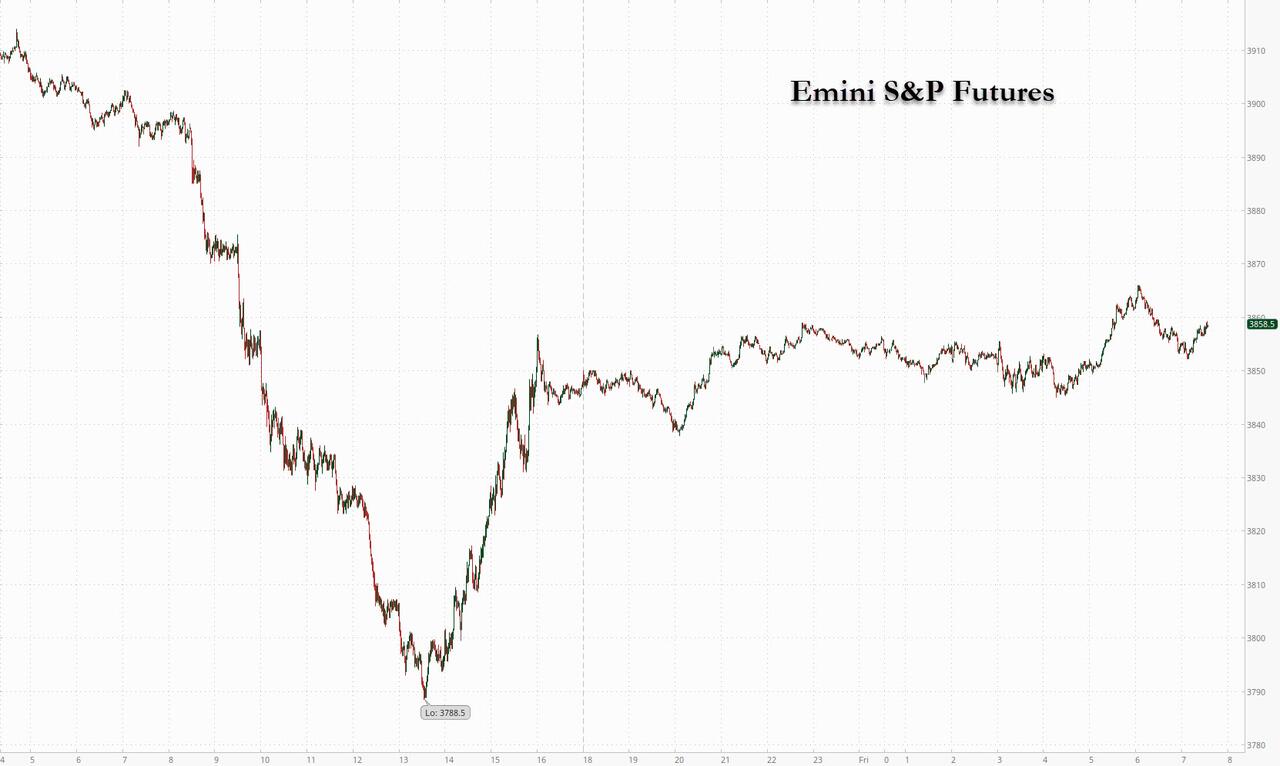
US stock futures edged higher after Thursday’s slump as investors weighed strong job data and prospects of further policy tightening to cool inflation ahead of today's closely watched core PCE print which may reverse the negative sentiment (especially if it comes at 4.5% Y/Y or lower) and send stocks sharply higher (see here for more). Contracts on the Nasdaq 100 and the S&P 500 gained 0.3% by 7:30 am ET one day after the S&P 500 cash index plunged 1.5% on Thursday and was set for a third consecutive weekly loss, the longest losing streak since September. The index is also on pace for its second-worst December on record, while the Nasdaq 100 is on course for its steepest slump in the month since 2002.
In premarket trading Friday, Tesla Inc. shares rose after Elon Musk said he isn’t planning to sell any more shares for two years. Meme stock AMC Entertainment slid after the movie theater chain operator proposed converting preferred equity units into common shares. Meanwhile, avocado supplier Mission Produce reported fiscal fourth-quarter revenue and adjusted earnings per share that missed the average analyst estimates and predicted lower pricing in the first quarter.
Sentiment on Wall Street took a hit Thursday as jobless claims came in lower than expected, signaling the Federal Reserve has more work to do on inflation, while earnings disappointments sparked fears among investors of a recession. Technically, the set up isn’t looking good, according to Bloomberg intelligence strategist Gina Martin Adams, with a descent in equities that began at the start of 2022 looking set to persist into early 2023. “Momentum and breadth remain weak and industry cues hint at a prolonged struggle,” she wrote in a note.
With stocks sliding, global equity funds saw record weekly outflows of almost $42 billion in the week to Dec. 21, which were largely driven by US stock funds shedding $37 billion of assets, according to EPFR Global data. The outflows were mostly due to seasonal redemptions from US ETFs, Citigroup strategists said. And as a catastrophic year for stocks draws to a close, investors have also had a warning from strategists that they should brace for more pain heading into 2023.
“I think it’s going to be a very difficult year,” said James Athey, investment director at Abrdn. “The fact of the matter is that there’s been a significant monetary tightening we haven’t seen in a long time,” he said. “The effect of that on a global economy which is drowning in debt is highly likely to be deleterious.”
“Markets are in a state of flux at the moment, we have quite high inflation and interest rates that don’t quite seem able to catch up,” Richard Harris, chief executive officer at Port Shelter Investment Management, said in an interview on Bloomberg TV. “You have to be careful with equities, but they are still a better bet than bonds at the moment.”
Notable headlines overnight:
- Joe Biden said it will take time to get inflation back to normal levels, according to Yahoo News.
- Tesla CEO Musk said he will not sell any more Tesla stock for at least 18-24 months; waiting to see the extent of a recession before share buybacks, via Twitter Space. Musk said the economy will be in a "serious recession" in 2023, and demand will be lower.
Investors are now awaiting the PCE deflator, a key inflation measure tracked by the Fed. Analysts polled by Bloomberg expect a year-on-year 5.5% headline print, slowing from October’s 6%.
In Europe, the Stoxx 600 was on the rise, led by real estate, basic resources and retail stocks, and was headed for the first weekly gain in three as risk appetite returned before the Christmas holiday.
Earlier in the session, Asian stocks fell, on track for a second-straight weekly loss on concerns about aggressive US interest-rate hikes and the spread of the coronavirus in China. The MSCI Asia Pacific Index fell as much as 1.2%, with technology and energy stocks falling the most and dragging down South Korean and Taiwanese benchmarks. Trading was thin in much of the region ahead of year-end holidays. US economic growth in the third quarter was firmer than previously estimated, pushing a pause in the Federal Reserve’s policy tightening further out of reach. Investors are also wary that the core PCE deflator — a key US inflation measure — due later Friday may add to reasons for tighter policy. Meantime, a weaker sales outlook by memory maker Micron weighed on the chip sector. Friday’s decline put the MSCI Asia gauge on track for a 0.6% loss this week. While some strategists are optimistic that the year ahead could bring a rally after this year’s double-digit drop, the first half of 2023 looks riddled with challenges to profits as the global economy slows down and China’s path to reopening remains uncertain
“The Grinch selloff is firmly in place after Micron delivered a gloomy outlook and as better-than-expected US economic data supported the Fed’s case for more ongoing rate increases,” Edward Moya, a senior market analyst at Oanda, wrote in a note. “Global coordinated central bank tightening has yet to fully impact most of the economic readings for the major economies and that should have investors nervous over earnings downgrades and credit risks.” Key measures of Hong Kong and mainland stocks fell as the market digested China’s rising infection numbers and a sharp slowdown in economic activity.
Japan's Nikkei 225 posted its worst week since June on fears that the Bank of Japan has begun to exit its easy-money policy. On Friday, Japanese stocks declined as resilient US economic data renewed investor worries that the Federal Reserve will continue raising interest rates aggressively. The Topix fell 0.5% to close at 1,897.94, while the Nikkei declined 1% to 26,235.25. Toyota Motor Corp. contributed the most to the Topix decline, decreasing 1.2%. Out of 2,162 stocks in the index, 677 rose and 1,384 fell, while 101 were unchanged. US Third-Quarter GDP Revised Higher to 3.2% on Firmer Spending “How long the Fed maintains its hawkish stance will depend on inflation,” said Tatsushi Maeno, a senior strategist at Okasan Asset Management. “There may be a mood of restrained buying ahead of the US PCE data this evening,” which could provide the next clue on the Fed’s moves
In Fx, the Bloomberg Dollar Spot Index weakened for first time in three days. The dollar pulled back against a basket of currencies and was headed for a weekly decline, having risen for the two previous weeks. The yen firmed, bringing this week’s gains to almost 3%, thanks to the Bank of Japan’s sudden hawkish policy pivot announced on Tuesday.
In rates, Treasury yields grind higher, following similar price action in bunds where ECB hike premium has edged up over early London session on no immediate catalyst. US session focus includes a busy data slate which includes PCE deflator and University of Michigan sentiment. Early 2pm New York close for cash Treasuries, recommended by SIFMA. US 10-year yields around 3.71%, cheaper by 3bp vs. Thursday close and trading broadly inline with bunds and gilts. 2-year TSY yields are steady at 4.27% while 10-year yields gain 1.1bps to 3.69%. In Thursday’s trading session yields rose after stronger-than expected US economic data with 2-year tenor gaining 5bps while 10-year finished up 2bps. Spreads pare portion of Thursday’s flattening move with Treasury 2s10s, 5s30s curves steeper by 1.4bp and 1.2bp on the day.
In commodities, crude oil is firmer with WTI & Brent up by roughly $2.0/bbl, with WTI needing another USD 1.00/bbl of upside to test Thursday’s WTD peak of USD 79.90/bbl; early on Friday Russia said it could cut oil output by 5-7% early next year as a response to the Western price caps, according to RIA citing Deputy PM Novak; Spot gold/silver are incrementally firmer given the Dollar continues to languish, though the yellow metal remains capped by USD 1800/oz and as such is well within recent ranges.
Looking at today's busy calendar slate, we get Personal income and spending as well as the Fed's favorite inflation metric, core PCE; we also get Durable Capital goods and new orders as well as the UMichigan sentiment indicator and new home sales.
Market Snapshot
- S&P 500 futures little changed at 3,848.50
- MXAP down 1.0% to 155.37
- MXAPJ down 1.1% to 503.74
- Nikkei down 1.0% to 26,235.25
- Topix down 0.5% to 1,897.94
- Hang Seng Index down 0.4% to 19,593.06
- Shanghai Composite down 0.3% to 3,045.87
- Sensex down 1.6% to 59,868.93
- Australia S&P/ASX 200 down 0.6% to 7,107.69
- Kospi down 1.8% to 2,313.69
- STOXX Europe 600 up 0.3% to 428.34
- German 10Y yield little changed at 2.40%
- Euro little changed at $1.0600
- Brent Futures up 1.8% to $82.45/bbl
- Gold spot up 0.2% to $1,796.18
- U.S. Dollar Index little changed at 104.37
Top Overnight News from Bloomberg
- Oil Pushes Higher as Russia May Cut Output in Response to Cap
- Jan. 6 Panel Releases Report Blasting Trump for Capitol Assault
- Tencent Rant, Sea Pay Freeze Hint at Deepening Gaming Crisis
- Sea Dives After Pay Freeze, Bonus Cuts Suggest Tougher 2023
- Biogen’s ALS Drug Raises Stakes in War Over Fast Drug Approvals
- Trump Asked About Using Troops on Protesters, Esper Told Panel
- Bankman-Fried’s $250 Million Bail Doesn’t Mean He Has Money
- US Stocks Snap Two Days of Gains; Dollar Rises: Markets Wrap
- Tech Bulls Face Worst December in 20 Years as Fed Anxiety Grows
- Well-Timed Shorts See Value Investor Notching 40% Gains for 2022
- Storm Upends Holiday Travel, Triggers White House Warning
A more detailed look at global markets courtesy of Newsquawk
Asia-Pac stocks traded mostly lower but drifted off worst levels following a similar session stateside. ASX 200 saw all of its sectors in the red with losses led by Tech, Energy and gold miners. Nikkei 225 was dragged lower by its industrial sector, whilst Japanese Core CPI in November rose at the fastest annual pace since 1981. Hang Seng and Shanghai Comp were mixed in which the former succumbed to the regional losses and the latter briefly moved into the green, whilst the PBoC injected a net CNY 704bln in the week via OMO - the largest weekly cash in nearly two months, according to Reuters calculations.
Top Asian News
- China reported zero new COVID deaths in the mainland on Dec 22nd vs zero a day earlier, according to Reuters.
- PBoC injected CNY 2bln via 7-day reverse repos with the rate maintained at 2.00%; injects CNY 203bln via 14-day reverse repos with the rate maintained at 2.15%; daily net injection CNY 164bln.
- PBoC injected a net CNY 704bln in the week via OMO; the largest weekly cash in nearly two months, according to Reuters calculations.
- Japanese PM Kishida could conduct a cabinet reshuffle as early as January 10th, according to ANN.
- Japanese government official said the next wave of food inflation is likely to come in February 2023; effects of government subsidies to cushion energy bills will likely start affecting CPI from February 2023, according to Reuters.
- BoJ October meeting minutes (two meetings ago): One member said the effects of BoJ's easing may be heightening as a moderate increase in inflation expectations push down real interest rates.
- China reportedly estimates the COVID surge is affecting 37mln people per day, via Bloomberg.
- Indian Health Minister says in the next week, planning to make COVID-19 negative test report compulsory for passengers from nations with a high case load.
European bourses are marginally firmer, Euro Stoxx 50 +0.2%, with the Stoxx 600 on track to end the week with upside of circa. 0.6%. Sectors are, after a mixed open, mostly in the green though Utilities and Travel & Leisure remain incrementally softer.
Stateside, futures are similarly supported, ES +0.3%, though we await US monthly PCE metrics for another factor into the Fed's deliberations. TSMC (TSM/2330 TT) is said to be in talks with suppliers over its first European plant, according to FT sources; Senior executives are heading to Germany early next year for discussions.
Top European News
- Janus Henderson’s New CEO To Expand In Latin America, Asia
- Meet the Improbable Stars of Turkey’s Year of Inflation Infamy
- Russia Says It May Cut Daily Oil Output by 700,000 Barrels
- Japan Begins Defense Upgrade With 26% Spending Increase for 2023
- Russia’s Novak: Decisions on Turkey Gas Hub May Be Taken in 2023
- Poland Sues EU Over Mounting Fine in Rule-of-Law Dispute
Geopolitical
- Senior Chinese Diplomat Wang Yi spoke to US Secretary of State Blinken and said US must stop supressing China's development and should not challenge China's red lines, according to Reuters.
- Chinese Foreign Ministry announced sanctions on Yu Maochun and Todd Stein as countermeasures to US’ sanction on two Chinese officials, citing human rights issues in Xizang (Tibet), according to Global Times.
- N. Korea has fired what could be a ballistic missile, via Japanese Coast Guard; Yonhap reports this as being a ballistic missile; landed outside of Japan's EEZ.
FX
- Dollar wanes after GDP and IJC boost as the focus switches to PCE amidst a partial recovery in risk appetite, DXY roams from 104.160 to 104.510.
- Kiwi claws back losses vs Aussie and Buck as AUD/NZD retreats through 1.0650, NZD/USD breaches 200 DMA and AUD/USD scales 100 DMA with a slight lag.
- Pound, Euro and Loonie take advantage of softer Greenback, but Yen hampered by high yields, Cable firmer on 1.2000 handle, EUR/USD resilient around 1.0600, USD/CAD probing 1.3600 and USD/JPY hovering above 132.50.
- PBoC sets USD/CNY mid-point at 6.9810 vs exp. 6.9885 (prev. 6.9713)
Fixed Income
- Debt remains in virtual freefall, with Bunds extending losses sub-135.00, Gilts towards 100.00 and the T-note rooted within a 113-09+/15+ range
- Curves re-steepen marginally as the spotlight turns to US PCE data as the last potential macro market mover before the Xmas break
Commodities
- Crude benchmarks are firmer on the session with magnitudes more pronounced than across other asset classes; currently, WTI & Brent Fed’23 are firmer by just shy of USD 2.0/bbl, with WTI needing another USD 1.00/bbl of upside to test Thursday’s WTD peak of USD 79.90/bbl.
- Spot gold/silver are incrementally firmer given the Dollar continues to languish, though the yellow metal remains capped by USD 1800/oz and as such is well within recent ranges.
- Russia could cut oil output by 5-7% early next year as a response to the Western price caps, according to RIA citing Deputy PM Novak; Russia may cut oil output by 500-700k BPD, according to Tass citing Deputy PM Novak
- Colorado Interstate Gas Co. declared force majeure at CIG Wamsutter compressor station, according to Reuters.
- Phillips 66 (PSX) Wood River, Illinois (380k BPD) refinery reports a unit upset.
US Event Calendar
- 08:30: Nov. Durable Goods Orders, est. -1.0%, prior 1.1%; -Less Transportation, est. 0%, prior 0.5%
- Cap Goods Orders Nondef Ex Air, est. 0%, prior 0.6%
- Cap Goods Ship Nondef Ex Air, est. -0.3%, prior 1.5%
- 08:30: Nov. Personal Income, est. 0.3%, prior 0.7%
- Personal Spending, est. 0.2%, prior 0.8%
- Real Personal Spending, est. 0.1%, prior 0.5%
- 08:30: Nov. PCE Deflator MoM, est. 0.1%, prior 0.3%
- PCE Deflator YoY, est. 5.5%, prior 6.0%
- PCE Core Deflator MoM, est. 0.2%, prior 0.2%
- PCE Core Deflator YoY, est. 4.6%, prior 5.0%
- 10:00: Dec. U. of Mich. Sentiment, est. 59.1, prior 59.1
- U. of Mich. Current Conditions, est. 60.3, prior 60.2
- U. of Mich. Expectations, est. 58.5, prior 58.4
- U. of Mich. 1 Yr Inflation, est. 4.6%, prior 4.6%; 5-10 Yr Inflation, est. 3.0%, prior 3.0%
- 10:00: Nov. New Home Sales, est. 600,000, prior 632,000
- Nov. New Home Sales MoM, est. -5.1%, prior 7.5%
International
Congress’ failure so far to deliver on promise of tens of billions in new research spending threatens America’s long-term economic competitiveness
A deal that avoided a shutdown also slashed spending for the National Science Foundation, putting it billions below a congressional target intended to…
Share this:


Federal spending on fundamental scientific research is pivotal to America’s long-term economic competitiveness and growth. But less than two years after agreeing the U.S. needed to invest tens of billions of dollars more in basic research than it had been, Congress is already seriously scaling back its plans.
A package of funding bills recently passed by Congress and signed by President Joe Biden on March 9, 2024, cuts the current fiscal year budget for the National Science Foundation, America’s premier basic science research agency, by over 8% relative to last year. That puts the NSF’s current allocation US$6.6 billion below targets Congress set in 2022.
And the president’s budget blueprint for the next fiscal year, released on March 11, doesn’t look much better. Even assuming his request for the NSF is fully funded, it would still, based on my calculations, leave the agency a total of $15 billion behind the plan Congress laid out to help the U.S. keep up with countries such as China that are rapidly increasing their science budgets.
I am a sociologist who studies how research universities contribute to the public good. I’m also the executive director of the Institute for Research on Innovation and Science, a national university consortium whose members share data that helps us understand, explain and work to amplify those benefits.
Our data shows how underfunding basic research, especially in high-priority areas, poses a real threat to the United States’ role as a leader in critical technology areas, forestalls innovation and makes it harder to recruit the skilled workers that high-tech companies need to succeed.
A promised investment
Less than two years ago, in August 2022, university researchers like me had reason to celebrate.
Congress had just passed the bipartisan CHIPS and Science Act. The science part of the law promised one of the biggest federal investments in the National Science Foundation in its 74-year history.
The CHIPS act authorized US$81 billion for the agency, promised to double its budget by 2027 and directed it to “address societal, national, and geostrategic challenges for the benefit of all Americans” by investing in research.
But there was one very big snag. The money still has to be appropriated by Congress every year. Lawmakers haven’t been good at doing that recently. As lawmakers struggle to keep the lights on, fundamental research is quickly becoming a casualty of political dysfunction.
Research’s critical impact
That’s bad because fundamental research matters in more ways than you might expect.
For instance, the basic discoveries that made the COVID-19 vaccine possible stretch back to the early 1960s. Such research investments contribute to the health, wealth and well-being of society, support jobs and regional economies and are vital to the U.S. economy and national security.
Lagging research investment will hurt U.S. leadership in critical technologies such as artificial intelligence, advanced communications, clean energy and biotechnology. Less support means less new research work gets done, fewer new researchers are trained and important new discoveries are made elsewhere.
But disrupting federal research funding also directly affects people’s jobs, lives and the economy.
Businesses nationwide thrive by selling the goods and services – everything from pipettes and biological specimens to notebooks and plane tickets – that are necessary for research. Those vendors include high-tech startups, manufacturers, contractors and even Main Street businesses like your local hardware store. They employ your neighbors and friends and contribute to the economic health of your hometown and the nation.
Nearly a third of the $10 billion in federal research funds that 26 of the universities in our consortium used in 2022 directly supported U.S. employers, including:
A Detroit welding shop that sells gases many labs use in experiments funded by the National Institutes of Health, National Science Foundation, Department of Defense and Department of Energy.
A Dallas-based construction company that is building an advanced vaccine and drug development facility paid for by the Department of Health and Human Services.
More than a dozen Utah businesses, including surveyors, engineers and construction and trucking companies, working on a Department of Energy project to develop breakthroughs in geothermal energy.
When Congress shortchanges basic research, it also damages businesses like these and people you might not usually associate with academic science and engineering. Construction and manufacturing companies earn more than $2 billion each year from federally funded research done by our consortium’s members.

Jobs and innovation
Disrupting or decreasing research funding also slows the flow of STEM – science, technology, engineering and math – talent from universities to American businesses. Highly trained people are essential to corporate innovation and to U.S. leadership in key fields, such as AI, where companies depend on hiring to secure research expertise.
In 2022, federal research grants paid wages for about 122,500 people at universities that shared data with my institute. More than half of them were students or trainees. Our data shows that they go on to many types of jobs but are particularly important for leading tech companies such as Google, Amazon, Apple, Facebook and Intel.
That same data lets me estimate that over 300,000 people who worked at U.S. universities in 2022 were paid by federal research funds. Threats to federal research investments put academic jobs at risk. They also hurt private sector innovation because even the most successful companies need to hire people with expert research skills. Most people learn those skills by working on university research projects, and most of those projects are federally funded.
High stakes
If Congress doesn’t move to fund fundamental science research to meet CHIPS and Science Act targets – and make up for the $11.6 billion it’s already behind schedule – the long-term consequences for American competitiveness could be serious.
Over time, companies would see fewer skilled job candidates, and academic and corporate researchers would produce fewer discoveries. Fewer high-tech startups would mean slower economic growth. America would become less competitive in the age of AI. This would turn one of the fears that led lawmakers to pass the CHIPS and Science Act into a reality.
Ultimately, it’s up to lawmakers to decide whether to fulfill their promise to invest more in the research that supports jobs across the economy and in American innovation, competitiveness and economic growth. So far, that promise is looking pretty fragile.
This is an updated version of an article originally published on Jan. 16, 2024.
Jason Owen-Smith receives research support from the National Science Foundation, the National Institutes of Health, the Alfred P. Sloan Foundation and Wellcome Leap.
economic growth covid-19 grants congress vaccine chinaInternational
What’s Driving Industrial Development in the Southwest U.S.
The post-COVID-19 pandemic pipeline, supply imbalances, investment and construction challenges: these are just a few of the topics address by a powerhouse…
Share this:


The post-COVID-19 pandemic pipeline, supply imbalances, investment and construction challenges: these are just a few of the topics address by a powerhouse panel of executives in industrial real estate this week at NAIOP’s I.CON West in Long Beach, California. Led by Dawn McCombs, principal and Denver lead industrial specialist for Avison Young, the panel tackled some of the biggest issues facing the sector in the Western U.S.
Starting with the pandemic in 2020 and continuing through 2022, McCombs said, the industrial sector experienced a huge surge in demand, resulting in historic vacancies, rent growth and record deliveries. Operating fundamentals began to normalize in 2023 and construction starts declined, certainly impacting vacancy and absorption moving forward.
“Development starts dropped by 65% year-over-year across the U.S. last year. In Q4, we were down 25% from pre-COVID norms,” began Megan Creecy-Herman, president, U.S. West Region, Prologis, noting that all of that is setting us up to see an improvement of fundamentals in the market. “U.S. vacancy ended 2023 at about 5%, which is very healthy.”
Vacancies are expected to grow in Q1 and Q2, peaking mid-year at around 7%. Creecy-Herman expects to see an increase in absorption as customers begin to have confidence in the economy, and everyone gets some certainty on what the Fed does with interest rates.
“It’s an interesting dynamic to see such a great increase in rents, which have almost doubled in some markets,” said Reon Roski, CEO, Majestic Realty Co. “It’s healthy to see a slowing down… before [rents] go back up.”
Pre-pandemic, a lot of markets were used to 4-5% vacancy, said Brooke Birtcher Gustafson, fifth-generation president of Birtcher Development. “Everyone was a little tepid about where things are headed with a mediocre outlook for 2024, but much of this is normalizing in the Southwest markets.”
McCombs asked the panel where their companies found themselves in the construction pipeline when the Fed raised rates in 2022.
In Salt Lake City, said Angela Eldredge, chief operations officer at Price Real Estate, there is a typical 12-18-month lead time on construction materials. “As rates started to rise in 2022, lots of permits had already been pulled and construction starts were beginning, so those project deliveries were in fall 2023. [The slowdown] was good for our market because it kept rates high, vacancies lower and helped normalize the market to a healthy pace.”
A supply imbalance can stress any market, and Gustafson joked that the current imbalance reminded her of a favorite quote from the movie Super Troopers: “Desperation is a stinky cologne.” “We’re all still a little crazed where this imbalance has put us, but for the patient investor and owner, there will be a rebalancing and opportunity for the good quality real estate to pass the sniff test,” she said.
At Bircher, Gustafson said that mid-pandemic, there were predictions that one billion square feet of new product would be required to meet tenant demand, e-commerce growth and safety stock. That transition opened a great opportunity for investors to run at the goal. “In California, the entitlement process is lengthy, around 24-36 months to get from the start of an acquisition to the completion of a building,” she said. Fast forward to 2023-2024, a lot of what is being delivered in 2024 is the result of that chase.
“Being an optimistic developer, there is good news. The supply imbalance helped normalize what was an unsustainable surge in rents and land values,” she said. “It allowed corporate heads of real estate to proactively evaluate growth opportunities, opened the door for contrarian investors to land bank as values drop, and provided tenants with options as there is more product. Investment goals and strategies have shifted, and that’s created opportunity for buyers.”
“Developers only know how to run and develop as much as we can,” said Roski. “There are certain times in cycles that we are forced to slow down, which is a good thing. In the last few years, Majestic has delivered 12-14 million square feet, and this year we are developing 6-8 million square feet. It’s all part of the cycle.”
Creecy-Herman noted that compared to the other asset classes and opportunities out there, including office and multifamily, industrial remains much more attractive for investment. “That was absolutely one of the things that underpinned the amount of investment we saw in a relatively short time period,” she said.
Market rent growth across Los Angeles, Inland Empire and Orange County moved up more than 100% in a 24-month period. That created opportunities for landlords to flexible as they’re filling up their buildings. “Normalizing can be uncomfortable especially after that kind of historic high, but at the same time it’s setting us up for strong years ahead,” she said.
Issues that owners and landlords are facing with not as much movement in the market is driving a change in strategy, noted Gustafson. “Comps are all over the place,” she said. “You have to dive deep into every single deal that is done to understand it and how investment strategies are changing.”
Tenants experienced a variety of challenges in the pandemic years, from supply chain to labor shortages on the negative side, to increased demand for products on the positive, McCombs noted.
“Prologis has about 6,700 customers around the world, from small to large, and the universal lesson [from the pandemic] is taking a more conservative posture on inventories,” Creecy-Herman said. “Customers are beefing up inventories, and that conservatism in the supply chain is a lesson learned that’s going to stick with us for a long time.” She noted that the company has plenty of clients who want to take more space but are waiting on more certainty from the broader economy.
“E-commerce grew by 8% last year, and we think that’s going to accelerate to 10% this year. This is still less than 25% of all retail sales, so the acceleration we’re going to see in e-commerce… is going to drive the business forward for a long time,” she said.
Roski noted that customers continually re-evaluate their warehouse locations, expanding during the pandemic and now consolidating but staying within one delivery day of vast consumer bases.
“This is a generational change,” said Creecy-Herman. “Millions of young consumers have one-day delivery as a baseline for their shopping experience. Think of what this means for our business long term to help our customers meet these expectations.”
McCombs asked the panelists what kind of leasing activity they are experiencing as a return to normalcy is expected in 2024.
“During the pandemic, shifts in the ports and supply chain created a build up along the Mexican border,” said Roski, noting border towns’ importance to increased manufacturing in Mexico. A shift of populations out of California and into Arizona, Nevada, Texas and Florida have resulted in an expansion of warehouses in those markets.
Eldridge said that Salt Lake City’s “sweet spot” is 100-200 million square feet, noting that the market is best described as a mid-box distribution hub that is close to California and Midwest markets. “Our location opens up the entire U.S. to our market, and it’s continuing to grow,” she said.
The recent supply chain and West Coast port clogs prompted significant investment in nearshoring and port improvements. “Ports are always changing,” said Roski, listing a looming strike at East Coast ports, challenges with pirates in the Suez Canal, and water issues in the Panama Canal. “Companies used to fix on one port and that’s where they’d bring in their imports, but now see they need to be [bring product] in a couple of places.”
“Laredo, [Texas,] is one of the largest ports in the U.S., and there’s no water. It’s trucks coming across the border. Companies have learned to be nimble and not focused on one area,” she said.
“All of the markets in the southwest are becoming more interconnected and interdependent than they were previously,” Creecy-Herman said. “In Southern California, there are 10 markets within 500 miles with over 25 million consumers who spend, on average, 10% more than typical U.S. consumers.” Combined with the port complex, those fundamentals aren’t changing. Creecy-Herman noted that it’s less of a California exodus than it is a complementary strategy where customers are taking space in other markets as they grow. In the last 10 years, she noted there has been significant maturation of markets such as Las Vegas and Phoenix. As they’ve become more diversified, customers want to have a presence there.
In the last decade, Gustafson said, the consumer base has shifted. Tenants continue to change strategies to adapt, such as hub-and-spoke approaches. From an investment perspective, she said that strategies change weekly in response to market dynamics that are unprecedented.
McCombs said that construction challenges and utility constraints have been compounded by increased demand for water and power.
“Those are big issues from the beginning when we’re deciding on whether to buy the dirt, and another decision during construction,” Roski said. “In some markets, we order transformers more than a year before they are needed. Otherwise, the time comes [to use them] and we can’t get them. It’s a new dynamic of how leases are structured because it’s something that’s out of our control.” She noted that it’s becoming a bigger issue with electrification of cars, trucks and real estate, and the U.S. power grid is not prepared to handle it.
Salt Lake City’s land constraints play a role in site selection, said Eldridge. “Land values of areas near water are skyrocketing.”
The panelists agreed that a favorable outlook is ahead for 2024, and today’s rebalancing will drive a healthy industry in the future as demand and rates return to normalized levels, creating opportunities for investors, developers and tenants.
This post is brought to you by JLL, the social media and conference blog sponsor of NAIOP’s I.CON West 2024. Learn more about JLL at www.us.jll.com or www.jll.ca.
fed pandemic covid-19 real estate interest rates mexicoInternational
Analyst reviews Apple stock price target amid challenges
Here’s what could happen to Apple shares next.
Share this:


They said it was bound to happen.
It was Jan. 11, 2024 when software giant Microsoft (MSFT) briefly passed Apple (AAPL) as the most valuable company in the world.
Microsoft's stock closed 0.5% higher, giving it a market valuation of $2.859 trillion.
It rose as much as 2% during the session and the company was briefly worth $2.903 trillion. Apple closed 0.3% lower, giving the company a market capitalization of $2.886 trillion.
"It was inevitable that Microsoft would overtake Apple since Microsoft is growing faster and has more to benefit from the generative AI revolution," D.A. Davidson analyst Gil Luria said at the time, according to Reuters.
The two tech titans have jostled for top spot over the years and Microsoft was ahead at last check, with a market cap of $3.085 trillion, compared with Apple's value of $2.684 trillion.
Analysts noted that Apple had been dealing with weakening demand, including for the iPhone, the company’s main source of revenue.
Demand in China, a major market, has slumped as the country's economy makes a slow recovery from the pandemic and competition from Huawei.
Sales in China of Apple's iPhone fell by 24% in the first six weeks of 2024 compared with a year earlier, according to research firm Counterpoint, as the company contended with stiff competition from a resurgent Huawei "while getting squeezed in the middle on aggressive pricing from the likes of OPPO, vivo and Xiaomi," said senior Analyst Mengmeng Zhang.
“Although the iPhone 15 is a great device, it has no significant upgrades from the previous version, so consumers feel fine holding on to the older-generation iPhones for now," he said.
Big plans for China
Counterpoint said that the first six weeks of 2023 saw abnormally high numbers with significant unit sales being deferred from December 2022 due to production issues.
Apple is planning to open its eighth store in Shanghai – and its 47th across China – on March 21.
Related: Tech News Now: OpenAI says Musk contract 'never existed', Xiaomi's EV, and more
The company also plans to expand its research centre in Shanghai to support all of its product lines and open a new lab in southern tech hub Shenzhen later this year, according to the South China Morning Post.
Meanwhile, over in Europe, Apple announced changes to comply with the European Union's Digital Markets Act (DMA), which went into effect last week, Reuters reported on March 12.
Beginning this spring, software developers operating in Europe will be able to distribute apps to EU customers directly from their own websites instead of through the App Store.
"To reflect the DMA’s changes, users in the EU can install apps from alternative app marketplaces in iOS 17.4 and later," Apple said on its website, referring to the software platform that runs iPhones and iPads.
"Users will be able to download an alternative marketplace app from the marketplace developer’s website," the company said.
Apple has also said it will appeal a $2 billion EU antitrust fine for thwarting competition from Spotify (SPOT) and other music streaming rivals via restrictions on the App Store.
The company's shares have suffered amid all this upheaval, but some analysts still see good things in Apple's future.
Bank of America Securities confirmed its positive stance on Apple, maintaining a buy rating with a steady price target of $225, according to Investing.com.
The firm's analysis highlighted Apple's pricing strategy evolution since the introduction of the first iPhone in 2007, with initial prices set at $499 for the 4GB model and $599 for the 8GB model.
BofA said that Apple has consistently launched new iPhone models, including the Pro/Pro Max versions, to target the premium market.
Analyst says Apple selloff 'overdone'
Concurrently, prices for previous models are typically reduced by about $100 with each new release.
This strategy, coupled with installment plans from Apple and carriers, has contributed to the iPhone's installed base reaching a record 1.2 billion in 2023, the firm said.
More Tech Stocks:
- Analyst unveils new Facebook stock price target after earnings
- Billionaire George Soros sold this popular semiconductor stock
- Ark’s Cathie Wood just traded 3 popular tech stocks
Apple has effectively shifted its sales mix toward higher-value units despite experiencing slower unit sales, BofA said.
This trend is expected to persist and could help mitigate potential unit sales weaknesses, particularly in China.
BofA also noted Apple's dominance in the high-end market, maintaining a market share of over 90% in the $1,000 and above price band for the past three years.
The firm also cited the anticipation of a multi-year iPhone cycle propelled by next-generation AI technology, robust services growth, and the potential for margin expansion.
On Monday, Evercore ISI analysts said they believed that the sell-off in the iPhone maker’s shares may be “overdone.”
The firm said that investors' growing preference for AI-focused stocks like Nvidia (NVDA) has led to a reallocation of funds away from Apple.
In addition, Evercore said concerns over weakening demand in China, where Apple may be losing market share in the smartphone segment, have affected investor sentiment.
And then ongoing regulatory issues continue to have an impact on investor confidence in the world's second-biggest company.
“We think the sell-off is rather overdone, while we suspect there is strong valuation support at current levels to down 10%, there are three distinct drivers that could unlock upside on the stock from here – a) Cap allocation, b) AI inferencing, and c) Risk-off/defensive shift," the firm said in a research note.
Related: Veteran fund manager picks favorite stocks for 2024
stocks pandemic recovery european europe eu china

IFM’s Hat Trick and Reflections On Option-To-Buy M&A


Four Years Ago This Week, Freedom Was Torched


Red Candle In The Wind


Analyst reviews Apple stock price target amid challenges


The SNF Institute for Global Infectious Disease Research announces new advisory board


CDC Warns Thousands Of Children Sent To ER After Taking Common Sleep Aid


Economic Trends, Risks and the Industrial Market


Trump “Clearly Hasn’t Learned From His COVID-Era Mistakes”, RFK Jr. Says


Chronic stress and inflammation linked to societal and environmental impacts in new study


SoCal Industrial Prioritizes Speed, Power and Sustainability
-

 Uncategorized3 weeks ago
All Of The Elements Are In Place For An Economic Crisis Of Staggering Proportions
-

 International5 days ago
EyePoint poaches medical chief from Apellis; Sandoz CFO, longtime BioNTech exec to retire
-

 Uncategorized4 weeks ago
California Counties Could Be Forced To Pay $300 Million To Cover COVID-Era Program
-

 Uncategorized3 weeks ago
Apparel Retailer Express Moving Toward Bankruptcy
-

 Uncategorized4 weeks ago
Industrial Production Decreased 0.1% in January
-

 International5 days ago
Walmart launches clever answer to Target’s new membership program
-

 Uncategorized4 weeks ago
RFK Jr: The Wuhan Cover-Up & The Rise Of The Biowarfare-Industrial Complex
-

 Uncategorized3 weeks ago
GOP Efforts To Shore Up Election Security In Swing States Face Challenges