Futures Swing Wildly In Overnight Rollercoaster Session Before Settling Flat
Futures Swing Wildly In Overnight Rollercoaster Session Before Settling Flat
After a rollercoaster overnight session, which saw S&P futures tumble as much as 2%, dropping as low as 4,260 following Powell’s hawkish comments, futures have..
Share this:

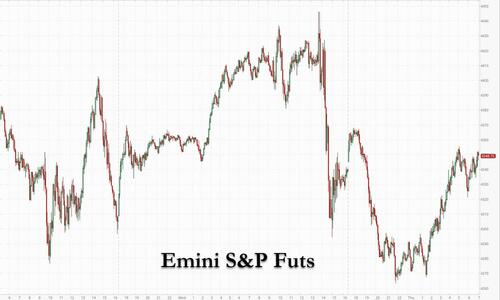
After a rollercoaster overnight session, which saw S&P futures tumble as much as 2%, dropping as low as 4,260 following Powell's hawkish comments, futures have recovered and briefly traded in the green while European stocks are still red though trading near session highs as traders spooked by the Fed's comments started digging for bargains. At 7:20am ET (incredibly illiquid) emini S&P futures were flat at 4,341, Dow futures were up 0.1% or 36 points and Nasdaq futures swung the most and after dropping as much as 2.2% turned green some 0.5% higher or 75 points after Bill Ackman revealed late on Wednesday he had purchased 3.1 million Netflix shares.
The yield curve shrank to the flattest since 2020 after the meeting. Two-year Treasuries extended declines, though longer-dated ones rebounded. The dollar extended gains. Oil fluctuated as calm reigned for crypto. Expectations of Fed tightening sent the policy-sensitive U.S. two-year yield to 1.208%, levels last reached in February 2020. The benchmark 10-year yield slipped slightly to 1.835% having hit a high of 1.88% on Wednesday. The spread between the 10 and two-year bond yields fell to its narrowest since late 2020 as investors priced in a faster pace of rate rises in the medium-term. This in turn helped the dollar to its highest since June 2020 and sent the euro to its lowest in 19-months. The single currency dropped 0.5% to $1.1182 .

In U.S. premarket trading, Tesla fell after signaling supply chain troubles, while Intel slid as it warned on profit margins. Qualtrics International on the other hand, jumped after posting a better-than-expected revenue forecast. Netflix gained as much as 4.8% after hedge fund founder Bill Ackman said he has acquired more than 3.1 million shares in the online video streaming giant. Meanwhile, Teradyne plunged 18% in premarket after the chip-testing firm’s first-quarter earnings forecast fell short of estimates due to to supply constraints and a drop in demand stemming from a slow transition at one of its customers. Other notable premarket movers:
- DouYu (DOYU US) shares jump 10% in U.S. premarket trading after Reuters reports that Tencent plans to take the live game streaming company private, citing people with knowledge of the matter.
- Teradyne (TER US) shares plunge 18% in U.S. premarket trading after the chip-testing firm’s 1Q earnings forecast fell short of estimates due to to supply constraints and a drop in demand stemming from a slow transition at one of its customers.
- Levi Strauss (LEVI US) shares surge 8.3% in premarket trading after the jeans maker gave an outlook for full-year net revenue that exceeded estimates. Analysts say momentum appears to have carried through to the start of 2022.
- Qualtrics (XM US) shares gain 11% in U.S. premarket trading after the software company gave a revenue forecast for 1Q that beat estimates. Analysts were positive on the company’s organic billings growth and said guidance is strong.
U.S. stocks have swung violently this week as investors worried about the fallout from an increasingly hawkish Federal Reserve on a broader economic recovery and company earnings. Overvalued technology-related stocks have been hit particularly hard since higher interest rates mean a bigger discount for the present value of their future profits, hurting growth stocks with the highest valuations and boosting cheap or so-called value shares.
“The hawkish tone last night from the Fed has led to a renewed rotation into value names but given the magnitude of some of the moves we have now seen in growth stocks year-to-date, we believe the opportunity set is again getting more exciting for growth investors,” said Marcus Morris-Eyton, portfolio manager at Allianz Global Investors. “We expect the market to gradually return to fundamentals now the Fed meeting has passed, and the earnings season moves into full swing.”
Investors expect the speed at which the Fed tightens policy to be the major determinant of risk sentiment in the coming months, although the U.S. central bank has said how quickly it hikes will depend on economic data and especially inflation.
"Powell (is) not committing to the size or the frequency of rate hikes and also the timing of the balance sheet reduction. I think that buys him a bit of wiggle room as to how quickly and with what velocity he wants to normalise monetary policy in the U.S." said David Chao, global market strategist, Asia Pacific (ex-Japan) at Invesco.
European equities slump at the open but most indexes gradually fade losses. Euro Stoxx 50 is only down 0.6%, having traded off as much as 1.8%. Spain’s IBEX outperforms, turning an initial 1.5% drop into a gain of as much as 0.8%. Banks and autos are the best performers.
Weeks of fretting over the Fed’s plan to combat inflation with higher interest rates is coming to fruition as Asian stock markets tumble into bear markets and technical corrections: Bear Markets Show Pain Across AsiaEquities as Fed Hikes Near; China Stocks Enter Bear Market as Yuan Tumbles Most in 7 Months. Bonds tumbled across Asia after Fed Chair Jerome Powell’s latest hawkish pivot, with Australian and New Zealand benchmark yields spiking to fresh highs: Fed Fallout Sends Sovereign Yields Soaring to Highs Across Asia
China high-yield dollar bonds fell 1-3 cents on the dollar , according to credit traders, after the market notched its longest winning streak since July: China Junk Dollar Bonds Set for First Drop in More Than a Week. Chinese authorities are considering a proposal to dismantle China Evergrande Group by selling the bulk of its assets: China Weighs Dismantling Evergrande to Contain Debt Crisis. The People’s Bank of China’s newfound autonomy may prove to be an unlikely source of support for the recovery: China Rushes to Deliver Stimulus as Fed Pulls Back in New Era.
Investors globally have dumped riskier assets in 2022 and sought safety as they brace for the end of nearly two years of exceptionally cheap and plentiful cash.
"What cheap money has done is provide a safety blanket from bad news," said Jane Foley, an analyst at Rabobank. "But as this comfort blanket is pulled away, investors will be more exposed and I suspect this will create a more volatile environment for asset prices."
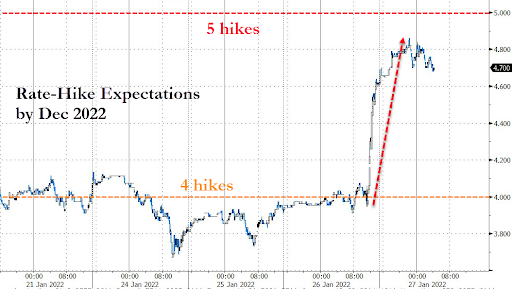
In rates, after extending post-FOMC drop late Wednesday, Treasuries began clawing their way back during Asia session and European morning led by long-end tenors, further flattening the curve. Ten-year Treasury yields slipped three basis points to 1.83% after surging to near a two-year high in the previous session, while the 2-year yield rose by 4bps to 1.19%. Yields are richer by ~5bp across 30-year sector, flattening 5s30s spread by ~3bp to tightest since March 2020; 2s10s spread is flatter by ~6bp and lowest since November 2020; the 10-year yield ~1.83% has retraced about half Wednesday’s surge to 1.876%. The ED market has boosted rate hike expectations to nearly 5 by December.
Treasury auction cycle concludes with $53b 7-year note sale at 1pm ET, following strong demand for 2- and 5-year sales earlier this week. Fed- dated OIS price in ~30bp of rate hikes for March meeting and 117bp by December after Wednesday’s post-FOMC front-end selloff. The hawkish central-bank pricing spills over into Europe: ECB-dated OIS briefly factor in a 20bps move and BOE OIS ~120bps of tightening by year end. Bunds and gilts drop, curves bear-flattening playing catch up to USTs, which bull-flatten away from their post-FOMC extremes. FOMC-dated OIS rates briefly factor in a full five hikes this year. Peripheral spreads tighten, short-end Italy and Spain outperform.
In FX, Bloomberg dollar spot trades close to session highs, adding 0.3%. The Bloomberg Dollar Spot Index rose for a fourth consecutive day as the greenback strengthened against all of its Group-of-10 peers. Hedging costs in major currencies remain relatively low, even as realized steepens and key risk events are captured by the front- end. The euro fell below $1.12 for the first time since November as traders increase bets on higher borrowing costs, with money markets now expecting five Federal Reserve interest-rate increases this year. Bunds extended a decline, sending the German 10-year yield to a one-week high as money markets bet on a faster pace of ECB policy tightening. The Canadian dollar and Norwegian krone held up best against the greenback as oil prices consolidated near a seven-year high and the pound was also among the better-performing G-10 currencies as markets rushed to price in another four interest-rate rises from the Bank of England. Other risk sensitive currencies, led by the New Zealand dollar, were the worst performers. Government bonds dropped in Australia and New Zealand, while the Australian dollar fell to a seven-week low and the New Zealand dollar slid for a sixth consecutive day to touch $0.6596, the lowest since November 2020. New Zealand’s debt auctions drew strong demand even after local data showed inflation quickened to the highest in more than three decades.
In commodities, crude futures drift back into the green. WTI adds 0.2%, rising back above $87; Brent reclaims $90. U.S. officials say they are in talks with major energy-producing countries and companies worldwide over a possible diversion of supplies to Europe if Russia invades Ukraine, although the White House said it faces challenges finding alternative sources of energy supplies. Spot gold trades off worst levels after finding support near $1,810/oz. Most base metals are in the green with LME tin up over 1%. Crypto markets declined amid broad weakness in risk assets during APAC hours; in-fitting with broader performance, crypto has staged a modest recovery during the European session. Bitcoin was last trading at $36,500.
Looking at the day ahead now, data releases include the US GDP reading for Q4, along with the weekly initial jobless claims, December’s pending home sales, durable goods orders, core capital goods orders, and January’s Kansas City Fed manufacturing index. Central bank speakers include the ECB’s Scicluna, whilst earnings releases include Apple, Visa, Mastercard, Comcast, Danaher and McDonald’s.
Market Snapshot
- S&P 500 futures up 0.2% to 4,351.25
- STOXX Europe 600 down 0.4% to 465.34
- MXAP down 2.4% to 182.01
- MXAPJ down 2.1% to 598.93
- Nikkei down 3.1% to 26,170.30
- Topix down 2.6% to 1,842.44
- Hang Seng Index down 2.0% to 23,807.00
- Shanghai Composite down 1.8% to 3,394.25
- Sensex down 1.2% to 57,180.21
- Australia S&P/ASX 200 down 1.8% to 6,838.28
- Kospi down 3.5% to 2,614.49
- German 10Y yield little changed at -0.03%
- Euro down 0.4% to $1.1198
- Brent Futures down 0.3% to $89.72/bbl
- Gold spot down 0.3% to $1,814.46
- U.S. Dollar Index up 0.35% to 96.81
Top Overnight News from Bloomberg
- Spain’s labor market continued to improve in the fourth quarter, with the unemployment rate falling to the lowest since 2008, according to figures released by the nation’s statistics office, INE
- Norway’s $1.3 trillion sovereign wealth fund, the world’s biggest, returned 14.5% in 2021, equivalent to about $176 billion, after stocks rose.
- Turkey’s central bank raised its inflation projections after a collapse in the currency pushed consumer price growth to its highest in President Recep Tayyip Erdogan’s 19-year rule
A more detailed look at global markets courtesy of Newsquawk
In Asia, APAC markets sold off with risk appetite hit as the region digested the hawkish FOMC meeting. Nikkei 225 (-3.1%) suffered losses of more than 3% and with the index down more than 10% from January highs. KOSPI (-3.5%) was mired by another North Korean launch and with Samsung Electronics dwindling post- earnings. Hang Seng (-1.9%) and declined amid a slowdown in Chinese Industrial Profits andShanghai Comp. (-1.7%) with the CSI 300 Index slipping into bear market territory after falling 20% from its February 2021 peak, while developers are hit including Evergrande as investors will have to wait six months for an initial restructuring plan.
Top Asian News
- China Fintech PingPong Is Said to Weigh $1 Billion Hong Kong IPO
- Tencent Plans to Take U.S.-Listed DouYu Private: Reuters
- China Stocks Enter Bear Market as Yuan Tumbles Most in 7 Months
- Japan’s 10-Year Bond Yield Closes at Highest Level Since 2018
In Europe, major bourses in Europe are nursing the post-Fed pressure with the complex now mixed, Stoxx 600 -0.1%. In Europe, with lagging post-Intel (-3.1% pre-market) in-spite of strong numbers givensectors are mixed Tech soft guidance, with European comparables pressured post respective earnings this morning. While Financials outperform post-Fed.
Top European News
- Deutsche Bank Plans to Boost Dividend After Three-Year Drought
- Dutch Government Said to Resume Sale of Majority ABN Amro Stake
- European Gas Fluctuates With Ukraine Tensions and Mild Weather
- U.S., Other ‘Populist’ Nations Mishandled Pandemic, Study Says
In FX, hawkish Fed Powell overshadows official FOMC policy message to give a fresh boost.Greenback Franc, and underperform as Fed gets set to widen the gap between policy stances of SNB, BoJ andYen Euro ECB. Kiwi fails to benefit much from hot NZ CPI and Aussie via a poll predicting RBA tightening in November amidst the Buck’s latest bill run. Rand stands firm awaiting a SARB hike and regains some poise on technical grounds rather than anyRouble real improvement in Russian relations with the US or western nations. CBRT Minutes: the policy stance will be set taking into account the source/permanence of risks, expects the disinflation process to start on the back of measures taken. Will develop tools to support the increase of TRY assets.
In commodities, crude benchmarks have trimmed post-Fed downside in tandem with the equity recovery, as focus remains as Russia receives the US' written response.very much on geopolitics WTI and have recaptured USD 87.00/bbl and USD 90.00/bbl respectively, and are now holding nearBrent session highs. Spot gold lies near the post-Fed trough and as such the 200- & 50-DMAs are back in view at USD 1805/oz and USD 1803/oz respectively. China Gold Association said 2021 gold consumption increased 36.5% Y/Y to 1,220.9 tons and gold output rose 10.0% Y/Y to 329.0 tons, according to Bloomberg
US Event Calendar
- 8:30am: 4Q GDP Annualized QoQ, est. 5.5%, prior 2.3%
- 8:30am: 4Q GDP Price Index, est. 6.0%, prior 6.0%
- 8:30am: 4Q Personal Consumption, est. 3.4%, prior 2.0%
- 8:30am: 4Q PCE Core QoQ, est. 4.9%, prior 4.6%
- 8:30am: Dec. Durable Goods Orders, est. -0.6%, prior 2.6%
- 8:30am: Dec. -Less Transportation, est. 0.3%, prior 0.9%
- 8:30am: Dec. Cap Goods Ship Nondef Ex Air, est. 0.5%, prior 0.3%
- 8:30am: Dec. Cap Goods Orders Nondef Ex Air, est. 0.4%, prior 0%
- 8:30am: Jan. Initial Jobless Claims, est. 265,000, prior 286,000
- 8:30am: Jan. Continuing Claims, est. 1.65m, prior 1.64m
- 10am: Dec. Pending Home Sales YoY, est. -4.0%, prior 0.2%; MoM est. -0.4%, prior -2.2%
- 11am: Jan. Kansas City Fed Manf. Activity, est. 20, prior 24
DB's Jim Reid concludes the overnight wrap
I will be doing a Zoom webinar tomorrow at 14:00 London time on my latest chartbook, called “The Road to the next recession”. The link to register to get details of the webinar is here and the link to the chartbook is here.
The chart book also reiterates two big themes we've been discussing over the last year. Firstly that the Fed is hugely behind the curve and secondly that this is a totally different cycle to the last one and therefore the trends, especially on inflation, should be totally different. These themes came to a head last night after a hawkish Powell press conference that saw a major negative turnaround in equities and rates.
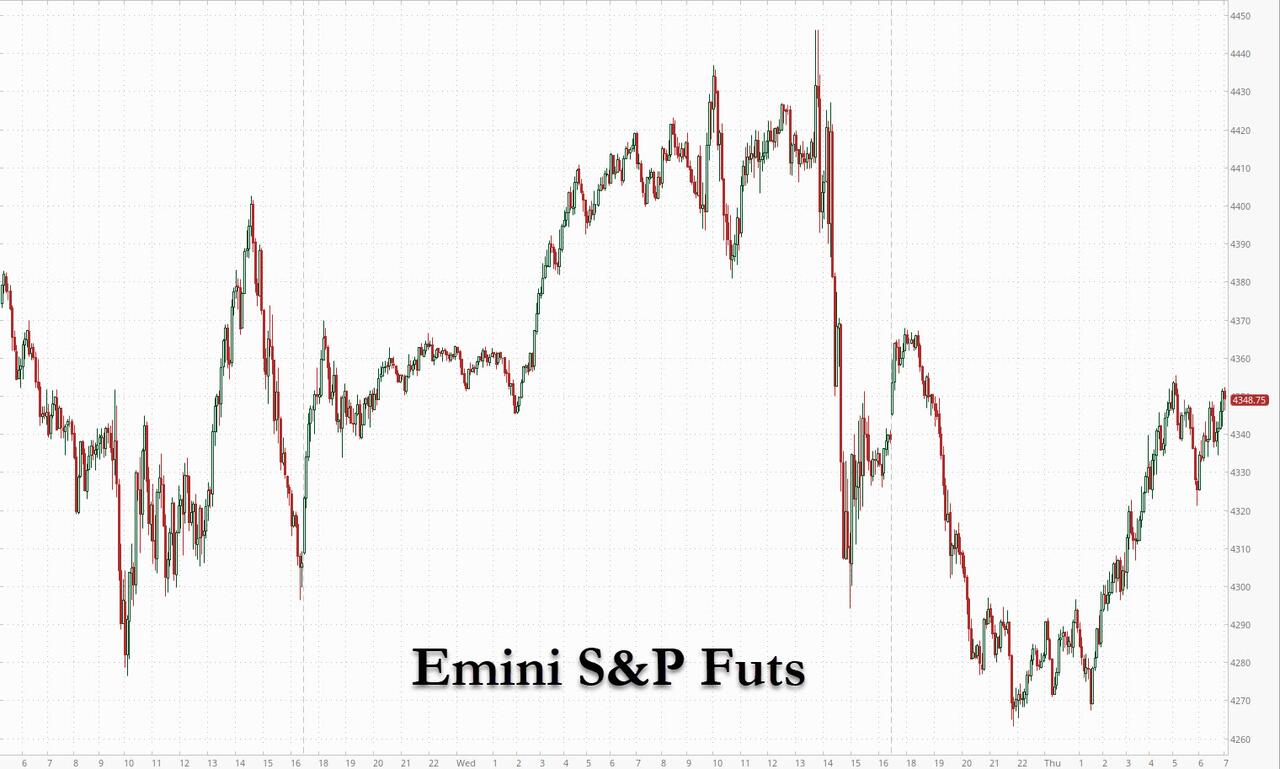
Upon the statement release, yields were little changed and the NASDAQ rallied around +1.0% bringing it +3.38% higher on the day, as some equity investors were enthused that asset sales appeared to be off the table. However the rhetoric towards tighter rate policy during the press conference undid equity gains immediately. The fact that the NASDAQ then dipped into negative territory before closing just +0.02% higher told the story of the presser. The NASDAQ had a 4.36% intraday range, compared with a 2.75% range Tuesday and a 5.96% range Monday. The S&P 500 closed -0.15% lower, erasing a +2.2% gain, led by real estate (-1.66%), materials (-1.02%), and industrials (-0.82%). The VIX increased for the seventh straight day for the first time since October 2020, climbing +0.8pts to 31.96, its highest level since January 2021.
Treasury yields sold off across the curve, with most of the price action taking place during the press conference: 2yr, 5yr, and 10yr yields increased +13.3bps, +13.0bps, and +9.5bps, respectively. With 2yrs seeing the biggest sell-off since the whipsaw market of March 2020. Real yields did most of the work, with real 5yr and 10yr yields increasing +14.7bps and +10.4bps, respectively. As big as the move in real yields was, there were bigger one-day increases earlier this month, which does a lot to explain how the market has evolved this year. When all was said and done, the market prices a +117% chance of a 25bp March rate hike, so a meaningful probability of a 50bp move, and 4.6 25bp hikes through 2022. In Asia 2-year US Treasury yields are +3.3bps higher with 10yr notes dipping around -1.4bps meaning a notable flattening of the yield curve to c.+65.7bp. See the first few pages of the chartbook for how the historical playbook would suggest inversion by early next year.
So what did the FOMC actually say? Well they did leave policy unchanged as expected, while the statement signalled it would soon be appropriate to raise the federal funds rate, in line with market expectations. The FOMC also released principles for reducing the balance sheet, which were more or less identical to the last round of QT. That is, the Fed will gradually decrease the size of its balance sheet by letting securities mature uninvested, not through sales, in line with our house view.
The press conference proved much more interesting though. Our US econ team has their full review here, where they have added a hike for 2022, with the base case now five. The biggest takeaway was the Chair’s emphasis that this cycle was different from the last round of tightening, in that inflation is well-above target, the labour market is historically tight, and growth projections remain above long-run potential. While the Chair demurred when asked what that specially meant for parameters of monetary policy, he did not rule out a faster pace of rate hikes or larger increments, adding that the Fed had plenty of room to tighten given the state of the labour market. This was the catalyst that sent shorter-dated yields higher, driven by real yields, as markets priced in a higher probability of an earlier and steeper policy path. Underscoring the shift towards tighter policy, he noted the Committee still viewed the balance of risk tilted towards higher inflation, and that the inflation picture had probably gotten worse since the Committee last submitted projections for the dot plot, which only contained three hikes this year. Presumably more hikes will be incorporated in the March dots.
Speaking of March, the Chair confirmed liftoff was likely to take place at the March FOMC, flagging the risks that would prevent that from happening including a worse-than-expected impact from Omicron (which he noted should not be persistent), and intimated geopolitical risks could pose an issue. So March, and every subsequent meeting should be treated as live with a 50bp hike at some point an increasing possibility.
On balance sheet policy, the Chair noted no decisions were made, and that conversations would continue at upcoming meetings (plural), implicitly matching our US econ team’s timeline that QT will begin after multiple rate hikes. He re-emphasized the message laid out in the balance sheet principles document that the Fed will set caps and let securities mature at a predictable pace, adjusting parameters as needed, but the Committee would rely on rate policy to control monetary policy.
Away from the Fed, one of yesterday’s biggest headlines was another surge in oil prices, with Brent crude finishing a shade below $90/bbl in trading for the first time since 2014. That came as the benchmark rose +1.77% in yesterday’s session, whilst WTI was also up +2.04% to its own post-2014 high of $87.35/bbl. In addition to hopes of a return to more normal levels of mobility this year following the pandemic, growing geopolitical tensions have also supported prices lately, not least given Russia is one of the world’s biggest exporters of oil. Bear in mind it was only back in October that Brent crude closed above $80/bbl for the first time since 2018, which in turn led to growing questions that we could be heading back into a period of 1970s-style stagflation. So the $90/bbl milestone won’t be welcomed by central banks looking to get inflation back to target, nor by politicians who face growing public concern about rising petrol prices and the cost of living. This time last year it was around $55 so its going to be tough for YoY CPI around the world to normalise very quickly.
European equities rallied sharply ahead of the Fed, with the STOXX 600 (+1.68%) seeing its strongest performance of 2022 so far as the more cyclical sectors and energy led the advance. The risk-on tone meant that sovereign bonds lost ground too, with yields on 10yr bunds (+0.6bps), OATs (+0.5bps) and BTPs (+3.8bps) all rising on the day. Interestingly, the latest movements also saw another widening in peripheral spreads, with the gap between Italian and German 10yr yields widening to 140.2bps, which is their biggest gap in over a year.
Staying with fixed income, credit continues to hold in ok relative to the year’s equity moves. We did a big note yesterday looking at how in the US the relative concentrations of the S&P 500 and US IG credit indices are at extremes (link here). Indeed the top 6 equity names make up 23.4% of the index. The same names make up 2.6% of the US IG index. Indeed JPM and BoA alone make up around 4.1% so if tech leads any US sell-off, credit will be relatively (if not absolutely) insulated. The note also has all the equivalent European numbers. We covered it also in my CoTD where we showed that the last time the US equity market was this concentrated was during the hubris of the “nifty fifty” bluechip valuation bubble of the late 1960s/early 1970s. Please email jim-reid.thematicresearch@db.com if you want to be added to the CoTD.
Tesla was the latest mega-cap to report earnings, beating analyst revenue and earnings expectations, and reporting annual profits two-years running for the first time in the company’s history. The shares initially dropped -6.45% in after-hours trading on fears that production would remain constrained by continued supply chain issues in 2022, but share prices gradually rebounded traded around +0.3% in extended after-hours.
Asian stock markets are sharply lower this morning post the Fed. The losses are being led by the Kospi (-3.14%) as the index heavyweight Samsung electronics (-2.46%) Q4 operating profit (13.87 trillion won) fell short of average analyst estimates (14.85 trillion won). Further, reports of North Korea firing an “unidentified projectile” in the early hours have also weighed. Separately, the Nikkei (-3.02%) and Hang Seng (-2.57%) are lower. Elsewhere, the Shanghai Composite (-0.88%) and CSI (-0.99%) are going the same way after profits at China’s industrial firms grew at a slower pace in December (+4.2% y/y) from +9.0% in November.
Looking forward, equity futures in the DM world are indicating a weak start with the contracts on the S&P 500 (-1.47%) and DAX (-2.47%) trading lower again.
Staying with Asia, Michael Spencer will today host a Zoom webinar on the Economic Outlook for the region in 2022. The call is at 08:30 EST / 13:30 UK Time / 21:30 Hong Kong Time. Please Register Here to get the joining details.
For those wanting something to listen to, DB Research have released their latest podcast (link here) on Industrials, a sector often said to be an economic bellwether, featuring lead analyst for US multi-industry and machinery research, Nicole DeBlase and Luke Templeman from my team. They discuss how the sector will fair this year as the Fed begins to raise interest rates, as well as how companies are dealing with the rampant input cost inflation they are experiencing. They also discuss how infrastructure bills can influence the sector.
On the Ukraine front, the buzz of headlines continues. Yesterday, the US embassy in Kyiv encouraged its citizens to leave the country, while the State Department responded to Russia’s security demands through a written statement that was not made available to the public, but apparently set out a serious diplomatic path forward.
The other central bank decision yesterday came from the Bank of Canada, who kept rates on hold at 0.25%. That said, they signalled that rate hikes could soon begin, with their statement saying that the Governing Council thought that “overall slack in the economy is absorbed”, and thus they ended their commitment to keeping policy rates at the effective lower bound, saying that they expect “interest rates will need to increase.” Investors are pricing a decent chance of that happening at the next meeting in March, with overnight index swaps pointing to a 94% probability of a hike.
There wasn’t much data of note yesterday, though US new home sales rose to an annualised rate of 811k in December (vs. 760k expected), which is their highest level in 9 months.
To the day ahead now, and data releases include the US GDP reading for Q4, along with the weekly initial jobless claims, December’s pending home sales, durable goods orders, core capital goods orders, and January’s Kansas City Fed manufacturing index. Central bank speakers include the ECB’s Scicluna, whilst earnings releases include Apple, Visa, Mastercard, Comcast, Danaher and McDonald’s.
Uncategorized
These Cities Have The Highest (And Lowest) Share Of Unaffordable Neighborhoods In 2024
These Cities Have The Highest (And Lowest) Share Of Unaffordable Neighborhoods In 2024
Authored by Sam Bourgi via CreditNews.com,
Homeownership…
Share this:


Authored by Sam Bourgi via CreditNews.com,
Homeownership is one of the key pillars of the American dream. But for many families, the idyllic fantasy of a picket fence and backyard barbecues remains just that—a fantasy.
Thanks to elevated mortgage rates, sky-high house prices, and scarce inventory, millions of American families have been locked out of the opportunity to buy a home in many cities.
To shed light on America’s housing affordability crisis, Creditnews Research ranked the 50 most populous cities by the percentage of neighborhoods within reach for the typical married-couple household to buy a home in.
The study reveals a stark reality, with many cities completely out of reach for the most affluent household type. Not only that, the unaffordability has radically worsened in recent years.
Comparing how affordability has changed since Covid, Creditnews Research discovered an alarming pattern—indicating consistently more unaffordable housing in all but three cities.
Fortunately, there’s still hope for households seeking to put down roots in more affordable cities—especially for those looking beyond Los Angeles, New York, Boston, San Jone, and Miami.
The typical American family has a hard time putting down roots in many parts of the country. In 11 of the top 50 cities, at least 50% of neighborhoods are out of reach for the average married-couple household. The affordability gap has widened significantly since Covid; in fact, no major city has reported an improvement in affordability post-pandemic.
Sam Bourgi, Senior Analyst at Creditnews
Key findings
-
The most unaffordable cities are Los Angeles, Boston, St. Louis, and San Jose; in each city, 100% of neighborhoods are out of reach for for married-couple households earning a median income;
-
The most affordable cities are Cleveland, Hartford, and Memphis—in these cities, the typical family can afford all neighborhoods;
-
None of the top 50 cities by population saw an improvement in affordable neighborhoods post-pandemic;
-
California recorded the biggest spike in unaffordable neighborhoods since pre-Covid;
-
The share of unaffordable neighborhoods has increased the most since pre-Covid in San Jose (70 percentage points), San Diego (from 57.8 percentage points), and Riverside-San Bernardino (51.9 percentage points);
-
Only three cities have seen no change in housing affordability since pre-Covid: Cleveland, Memphis, and Hartford. They’re also the only cities that had 0% of unaffordable neighborhoods before Covid.
Cities with the highest share of unaffordable neighborhoods
With few exceptions, the most unaffordable cities for married-couple households tend to be located in some of the nation’s most expensive housing markets.
Four cities in the ranking have an unaffordability percentage of 100%—indicating that the median married-couple household couldn’t qualify for an average home in any neighborhood.
The following are the cities ranked from the least affordable to the most:
-
Los Angeles, CA: Housing affordability in Los Angeles has deteriorated over the last five years, as average incomes have failed to keep pace with rising property values and elevated mortgage rates. The median household income of married-couple families in LA is $117,056, but even at that rate, 100% of the city’s neighborhoods are unaffordable.
-
St. Louis, MO: It may be surprising to see St. Louis ranking among the most unaffordable housing markets for married-couple households. But a closer look reveals that the Mound City was unaffordable even before Covid. In 2019, 98% of the city’s neighborhoods were unaffordable—way worse than Los Angeles, Boston, or San Jose.
-
Boston, MA: Boston’s housing affordability challenges began long before Covid but accelerated after the pandemic. Before Covid, married couples earning a median income were priced out of 90.7% of Boston’s neighborhoods. But that figure has since jumped to 100%, despite a comfortable median household income of $172,223.
-
San Jose, CA: Nestled in Silicon Valley, San Jose has long been one of the most expensive cities for housing in America. But things have gotten far worse since Covid, as 100% of its neighborhoods are now out of reach for the average family. Perhaps the most shocking part is that the median household income for married-couple families is $188,403—much higher than the national average.
-
San Diego, CA: Another California city, San Diego, is among the most unaffordable places in the country. Despite boasting a median married-couple household income of $136,297, 95.6% of the city’s neighborhoods are unaffordable.
-
San Francisco, CA: San Francisco is another California city with a high married-couple median income ($211,585) but low affordability. The percentage of unaffordable neighborhoods for these homebuyers stands at 89.2%.
-
New York, NY: As one of the most expensive cities in America, New York is a difficult housing market for married couples with dual income. New York City’s share of unaffordable neighborhoods is 85.9%, marking a 33.4% rise from pre-Covid times.
-
Miami, FL: Partly due to a population boom post-Covid, Miami is now one of the most unaffordable cities for homebuyers. Roughly four out of five (79.4%) of Miami’s neighborhoods are out of reach price-wise for married-couple families. That’s a 34.7% increase from 2019.
-
Nashville, TN: With Nashville’s population growth rebounding to pre-pandemic levels, the city has also seen greater affordability challenges. In the Music City, 73.7% of neighborhoods are considered unaffordable for married-couple households—an increase of 11.9% from pre-Covid levels.
-
Richmond, VA: Rounding out the bottom 10 is Richmond, where 55.9% of the city’s 161 neighborhoods are unaffordable for married-couple households. That’s an 11.9% increase from pre-Covid levels.
Cities with the lowest share of unaffordable neighborhoods
All the cities in our top-10 ranking have less than 10% unaffordable neighborhoods—meaning the average family can qualify for a home in at least 90% of the city.
Interestingly, these cities are also outside the top 15 cities by population, and eight are in the bottom half.
The following are the cities ranked from the most affordable to the least:
-
Hartford, CT: Hartford ranks first with the percentage of unaffordable neighborhoods at 0%, unchanged since pre-Covid times. Married couples earning a median income of $135,612 can afford to live in any of the city’s 16 neighborhoods. Interestingly, Hartford is the smallest city to rank in the top 10.
-
Memphis, TN: Like Hartford, Memphis has 0% unaffordable neighborhoods, meaning any married couple earning a median income of $101,734 can afford an average homes in any of the city’s 12 neighborhoods. The percentage of unaffordable neighborhoods also stood at 0% before Covid.
-
Cleveland, OH: The Midwestern city of Cleveland is also tied for first, with the percentage of unaffordable neighborhoods at 0%. That means households with a median-couple income of $89,066 can qualify for an average home in all of the city’s neighborhoods. Cleveland is also among the three cities that have seen no change in unaffordability compared to 2019.
-
Minneapolis, MN: The largest city in the top 10, Minneapolis’ share of unaffordable neighborhoods stood at 2.41%, up slightly from 2019. Married couples earning the median income ($149,214) have access to the vast majority of the city’s 83 neighborhoods.
-
Baltimore, MD: Married-couple households in Baltimore earn a median income of $141,634. At that rate, they can afford to live in 97.3% of the city’s 222 neighborhoods, making only 2.7% of neighborhoods unaffordable. That’s up from 0% pre-Covid.
-
Louisville, KY: Louisville is a highly competitive market for married households. For married-couple households earning a median wage, only 3.6% of neighborhoods are unaffordable, up 11.9% from pre-Covid times.
-
Cincinnati, OH: The second Ohio city in the top 10 ranks close to Cleveland in population but has a much higher median married-couple household income of $129,324. Only 3.6% of the city’s neighborhoods are unaffordable, up slightly from pre-pandemic levels.
-
Indianapolis, IN: Another competitive Midwestern market, only 4.4% of Indianapolis is unaffordable, making the vast majority of the city’s 92 neighborhoods accessible to the average married couple. Still, the percentage of unaffordable neighborhoods before Covid was less than 1%.
-
Oklahoma City, OK: Before Covid, Oklahoma City had 0% neighborhoods unaffordable for married-couple households earning the median wage. It has since increased to 4.69%, which is still tiny compared to the national average.
-
Kansas City, MO: Kansas City has one of the largest numbers of neighborhoods in the top 50 cities. Its married-couple residents can afford to live in nearly 95% of them, making only 5.6% of neighborhoods out of reach. Like Indiana, Kansas City’s share of unaffordable neighborhoods was less than 1% before Covid.
The biggest COVID losers
What's particularly astonishing about the current housing market is just how quickly affordability has declined since Covid.
Even factoring in the market correction after the 2022 peak, the price of existing homes is still nearly one-third higher than before Covid. Mortgage rates have also more than doubled since early 2022.
Combined, the rising home prices and interest rates led to the worst mortgage affordability in more than 40 years.
Against this backdrop, it’s hardly surprising that unaffordability increased in 47 of the 50 cities studied and remained flat in the other three. No city reported improved affordability in 2024 compared to 2019.
The biggest increases are led by San Jose (70 percentage points), San Diego (57.8 percentage points), Riverside-San Bernardino (51.9 percentage points), Sacramento (43 percentage points), Orlando (37.4 percentage points), Miami (34.7 percentage points), and New York City (33.4 percentage points).
The following cities in our study are ranked by the largest percentage point change in unaffordable neighborhoods since pre-Covid:
Uncategorized
Your financial plan may be riskier without bitcoin
It might actually be riskier to not have bitcoin in your portfolio than it is to have a small allocation.
Share this:


This article originally appeared in the Sound Advisory blog. Sound Advisory provide financial advisory services and are specialize in educating and guiding clients to thrive financially in a bitcoin-powered world. Click here to learn more.
“Belief is a wise wager. Granted that faith cannot be proved, what harm will come to you if you gamble on its truth and it proves false? If you gain, you gain all; if you lose, you lose nothing. Wager, then, without hesitation, that He exists.”
- Blaise Pascal
Blaise Pascal only lived to age 39 but became world-famous for many contributions in the fields of mathematics, physics, and theology. The above quote encapsulates Pascal’s wager—a philosophical argument for the Christian belief in the existence of God.
The argument's conclusion states that a rational person should live as though God exists. Even if the probability is low, the reward is worth the risk.
Pascal’s wager as a justification for bitcoin? Yes, I’m aware of the fallacies: false dichotomy, appeal to emotion, begging the question, etc. That is not the point. The point is that binary outcomes instigate extreme results, and the game theory of money suggests that it’s a winner-take-all game.
The Pascalian investor: A rational approach to bitcoin
Humanity’s adoption of “the best money over time” mimics a series of binary outcomes—A/B tests.
Throughout history, inferior forms of money have faded as better alternatives emerged (see India’s failed transition to a gold standard). And if bitcoin is trying to be the premier money of the future, it will either succeed or it won’t.
“If you ain’t first, you’re last.” -Ricky Bobby, Talladega Nights, on which monies succeed over time.
So, we can look at bitcoin success similarly to Pascal’s wager—let’s call it Satoshi’s wager. The translated points would go something like this:
- If you own bitcoin early and it becomes a globally valuable money, you gain immensely. ????
- If you own bitcoin and it fails, you’ve lost that value. ????
- If you don’t own bitcoin and it goes to zero, no pain and no gain. ????
- If you don’t own bitcoin and it succeeds, you will have missed out on the significant financial revolution of our lifetimes and fall comparatively behind. ????
If bitcoin is successful, it will be worth far more than it is today and have a massive impact on your financial future. If it fails, the losses are only limited to your exposure. The most that you could lose is the money that you invested.
It is hypothetically possible that bitcoin could be worth 100x more than it is today, but it can only possibly lose 1x its value as it goes to zero. The concept we’re discussing here is asymmetric upside - significant gains with relatively limited downside. In other words, the potential rewards of the investment outweigh the potential risks.
Bitcoin offers an asymmetric upside that makes it a wise investment for most portfolios. Even a small allocation provides potential protection against extreme currency debasement.
Salt, gasoline, and insurance

“Don’t over salt your steak, pour too much gas on the fire, or buy too much insurance.”
A little bit goes a long way, and you can easily overdo it. The same applies when looking at bitcoin in the context of a financial plan.
Bitcoin’s asymmetric upside gives it “insurance-like” qualities, and that insurance pays off very well in times of money printing. This was exemplified in 2020 when bitcoin's value increased over 300% in response to pandemic money printing, far outpacing stocks, gold, and bonds.
Bitcoin offers a similar asymmetric upside today. Bitcoin's supply is capped at 21 million coins, making it resistant to inflationary debasement. In contrast, the dollar's purchasing power consistently declines through unrestrained money printing. History has shown that societies prefer money that is hard to inflate.
If recent rampant inflation is uncontainable and the dollar system falters, bitcoin is well-positioned as a successor. This global monetary A/B test is still early, but given their respective sizes, a little bitcoin can go a long way. If it succeeds, early adopters will benefit enormously compared to latecomers. Of course, there are no guarantees, but the potential reward justifies reasonable exposure despite the risks.
Let’s imagine Nervous Nancy, an extremely conservative investor. She wants to invest but also take the least risk possible. She invests 100% of her money in short-term cash equivalents (short-term treasuries, money markets, CDs, maybe some cash in the coffee can). With this investment allocation, she’s nearly certain to get her initial investment back and receive a modest amount of interest as a gain. However, she has no guarantees that the investment returned to her will purchase the same amount as it used to. Inflation and money printing cause each dollar to be able to purchase less and less over time. Depending on the severity of the inflation, it might not buy anything at all. In other words, she didn’t lose any dollars, but the dollar lost purchasing power.
Now, let’s salt her portfolio with bitcoin.
99% short-term treasuries. 1% bitcoin.
With a 1% allocation, if bitcoin goes to zero overnight, she’ll have only lost a penny on the dollar, and her treasury interest will quickly fill the gap. Not at all catastrophic to her financial future.
However, if the hypothetical hyperinflationary scenario from above plays out and bitcoin grows 100x in purchasing power, she’s saved everything. Metaphorically, her entire dollar house burned down, and “bitcoin insurance” made her whole. Powerful. A little bitcoin salt goes a long way.
(When protecting against the existing system, it’s important to remember that you need to get your bitcoin out of the system. Keeping bitcoin on an exchange or with a counterparty will do you no good if that entity fails. If you view bitcoin as insurance, it’s essential to keep your bitcoin in cold storage and hold your keys. Otherwise, it’s someone else’s insurance.)
When all you have a hammer, everything looks like a…

A construction joke:
There are only three rules to construction: 1.) Always use the right tool for the job! 2.) A hammer is always the right tool! 3.) Anything can be a hammer!
Yeah. That’s what I thought, too. Slightly funny and mostly useless.
But if you spend enough time swinging a hammer, you’ll eventually realize it can be more than it first appears. Not everything is a nail. A hammer can tear down walls, break concrete, tap objects into place, and wiggle other things out. A hammer can create and destroy; it builds tall towers and humbles novice fingers. The use cases expand with the skill of the carpenter.
Like hammers, bitcoin is a monetary tool. And a 1-5% allocator to the asset typically sees a “speculative insurance” use case - valid. Bitcoin is speculative insurance, but it is not only speculative insurance. People invest and save in bitcoin for many different reasons.
I’ve seen people use bitcoin to pursue all of the following use cases:
- Hedging against a financial collapse (speculative insurance)
- Saving for family and future (long-term general savings and safety net)
- Growing a downpayment for a house (medium-term specific savings)
- Shooting for the moon in a manner equivalent to winning the lottery (gambling)
- Opting out of government-run, bank-controlled financial systems (financial optionality)
- Making a quick buck (short-term trading)
- Escaping a hostile country (wealth evacuation)
- Locking away wealth that can’t be confiscated (wealth preservation)
- As a means to influence opinions and gain followers (social status)
- Fix the money and fix the world (mission and purpose)
Keep this in mind when taking other people’s financial advice. They are often playing a different game than you. They have different goals, upbringings, worldviews, family dynamics, and circumstances. Even though they might use the same hammer as you, it could be for a completely different job.
Wrapping Up
A massive allocation to bitcoin may seem crazy to some people, yet perfectly reasonable to others. The same goes for having a 1% allocation.
But, given today’s macroeconomic environment and bitcoin’s trajectory, I find very few use cases where 0% bitcoin makes sense. By not owning bitcoin, you implicitly say that you are 100% certain it will fail and go to zero. Given its 14-year history so far, I’d recommend reducing your confidence. Nobody is 100% right forever. A little salt goes a long way. Your financial plan may be riskier without bitcoin. Diversify accordingly.
“We must learn our limits. We are all something, but none of us are everything.” - Blaise Pascal.
bonds pandemic stocks bitcoin link goldContact
Office: (208)-254-0142
Ste. 205
Eagle, ID 83616
Check the background of your financial professional on FINRA's BrokerCheck.The content is developed from sources believed to be providing accurate information. The information in this material is not intended as tax or legal advice. Please consult legal or tax professionals for specific information regarding your individual situation. Some of this material was developed and produced by FMG Suite to provide information on a topic that may be of interest. FMG Suite is not affiliated with the named representative, broker - dealer, state - or SEC - registered investment advisory firm. The opinions expressed and material provided are for general information, and should not be considered a solicitation for the purchase or sale of any security.
We take protecting your data and privacy very seriously. As of January 1, 2020 the California Consumer Privacy Act (CCPA) suggests the following link as an extra measure to safeguard your data: Do not sell my personal information.
Copyright 2024 FMG Suite.
Sound Advisory, LLC (“SA”) is a registered investment advisor offering advisory services in the State of Idaho and in other jurisdictions where exempt. Registration does not imply a certain level of skill or training. The information on this site is not intended as tax, accounting, or legal advice, as an offer or solicitation of an offer to buy or sell, or as an endorsement of any company, security, fund, or other securities or non-securities offering. This information should not be relied upon as the sole factor in an investment-making decision. Past performance is no indication of future results. Investment in securities involves significant risk and has the potential for partial or complete loss of funds invested. It should not be assumed that any recommendations made will be profitable or equal any performance noted on this site.
The information on this site is provided “AS IS” and without warranties of any kind, either express or implied. To the fullest extent permissible pursuant to applicable laws, Sound Advisory LLC disclaims all warranties, express or implied, including, but not limited to, implied warranties of merchantability, non-infringement, and suitability for a particular purpose.
SA does not warrant that the information on this site will be free from error. Your use of the information is at your sole risk. Under no circumstances shall SA be liable for any direct, indirect, special or consequential damages that result from the use of, or the inability to use, the information provided on this site, even if SA or an SA authorized representative has been advised of the possibility of such damages. Information contained on this site should not be considered a solicitation to buy, an offer to sell, or a recommendation of any security in any jurisdiction where such offer, solicitation, or recommendation would be unlawful or unauthorized.
International
Shakira’s net worth
After 12 albums, a tax evasion case, and now a towering bronze idol sculpted in her image, how much is Shakira worth more than 4 decades into her care…
Share this:


Shakira’s considerable net worth is no surprise, given her massive popularity in Latin America, the U.S., and elsewhere.
In fact, the belly-dancing contralto queen is the second-wealthiest Latin-America-born pop singer of all time after Gloria Estefan. (Interestingly, Estefan actually helped a young Shakira translate her breakout album “Laundry Service” into English, hugely propelling her stateside success.)
Since releasing her first record at age 13, Shakira has spent decades recording albums in both Spanish and English and performing all over the world. Over the course of her 40+ year career, she helped thrust Latin pop music into the American mainstream, paving the way for the subsequent success of massively popular modern acts like Karol G and Bad Bunny.
In December 2023, a 21-foot-tall beachside bronze statue of the “Hips Don’t Lie” singer was unveiled in her Colombian hometown of Barranquilla, making her a permanent fixture in the city’s skyline and cementing her legacy as one of Latin America’s most influential entertainers.
After 12 albums, a plethora of film and television appearances, a highly publicized tax evasion case, and now a towering bronze idol sculpted in her image, how much is Shakira worth? What does her income look like? And how does she spend her money?
How much is Shakira worth?
In late 2023, Spanish sports and lifestyle publication Marca reported Shakira’s net worth at $400 million, citing Forbes as the figure’s source (although Forbes’ profile page for Shakira does not list a net worth — and didn’t when that article was published).
Most other sources list the singer’s wealth at an estimated $300 million, and almost all of these point to Celebrity Net Worth — a popular but dubious celebrity wealth estimation site — as the source for the figure.
A $300 million net worth would make Shakira the third-richest Latina pop star after Gloria Estefan ($500 million) and Jennifer Lopez ($400 million), and the second-richest Latin-America-born pop singer after Estefan (JLo is Puerto Rican but was born in New York).
Shakira’s income: How much does she make annually?
Entertainers like Shakira don’t have predictable paychecks like ordinary salaried professionals. Instead, annual take-home earnings vary quite a bit depending on each year’s album sales, royalties, film and television appearances, streaming revenue, and other sources of income. As one might expect, Shakira’s earnings have fluctuated quite a bit over the years.
From June 2018 to June 2019, for instance, Shakira was the 10th highest-earning female musician, grossing $35 million, according to Forbes. This wasn’t her first time gracing the top 10, though — back in 2012, she also landed the #10 spot, bringing in $20 million, according to Billboard.
In 2023, Billboard listed Shakira as the 16th-highest-grossing Latin artist of all time.

How much does Shakira make from her concerts and tours?
A large part of Shakira’s wealth comes from her world tours, during which she sometimes sells out massive stadiums and arenas full of passionate fans eager to see her dance and sing live.
According to a 2020 report by Pollstar, she sold over 2.7 million tickets across 190 shows that grossed over $189 million between 2000 and 2020. This landed her the 19th spot on a list of female musicians ranked by touring revenue during that period. In 2023, Billboard reported a more modest touring revenue figure of $108.1 million across 120 shows.
In 2003, Shakira reportedly generated over $4 million from a single show on Valentine’s Day at Foro Sol in Mexico City. 15 years later, in 2018, Shakira grossed around $76.5 million from her El Dorado World Tour, according to Touring Data.
Related: RuPaul's net worth: Everything to know about the cultural icon and force behind 'Drag Race'
How much has Shakira made from her album sales?
According to a 2023 profile in Variety, Shakira has sold over 100 million records throughout her career. “Laundry Service,” the pop icon’s fifth studio album, was her most successful, selling over 13 million copies worldwide, according to TheRichest.
Exactly how much money Shakira has taken home from her album sales is unclear, but in 2008, it was widely reported that she signed a 10-year contract with LiveNation to the tune of between $70 and $100 million to release her subsequent albums and manage her tours.

How much did Shakira make from her Super Bowl and World Cup performances?
Shakira co-wrote one of her biggest hits, “Waka Waka (This Time for Africa),” after FIFA selected her to create the official anthem for the 2010 World Cup in South Africa. She performed the song, along with several of her existing fan-favorite tracks, during the event’s opening ceremonies. TheThings reported in 2023 that the song generated $1.4 million in revenue, citing Popnable for the figure.
A decade later, 2020’s Superbowl halftime show featured Shakira and Jennifer Lopez as co-headliners with guest performances by Bad Bunny and J Balvin. The 14-minute performance was widely praised as a high-energy celebration of Latin music and dance, but as is typical for Super Bowl shows, neither Shakira nor JLo was compensated beyond expenses and production costs.
The exposure value that comes with performing in the Super Bowl Halftime Show, though, is significant. It is typically the most-watched television event in the U.S. each year, and in 2020, a 30-second Super Bowl ad spot cost between $5 and $6 million.
How much did Shakira make as a coach on “The Voice?”
Shakira served as a team coach on the popular singing competition program “The Voice” during the show’s fourth and sixth seasons. On the show, celebrity musicians coach up-and-coming amateurs in a team-based competition that eventually results in a single winner. In 2012, The Hollywood Reporter wrote that Shakira’s salary as a coach on “The Voice” was $12 million.
Related: John Cena's net worth: The wrestler-turned-actor's investments, businesses, and more
How does Shakira spend her money?
Shakira doesn’t just make a lot of money — she spends it, too. Like many wealthy entertainers, she’s purchased her share of luxuries, but Barranquilla’s barefoot belly dancer is also a prolific philanthropist, having donated tens of millions to charitable causes throughout her career.
Private island
Back in 2006, she teamed up with Roger Waters of Pink Floyd fame and Spanish singer Alejandro Sanz to purchase Bonds Cay, a 550-acre island in the Bahamas, which was listed for $16 million at the time.
Along with her two partners in the purchase, Shakira planned to develop the island to feature housing, hotels, and an artists’ retreat designed to host a revolving cast of artists-in-residence. This plan didn’t come to fruition, though, and as of this article’s last update, the island was once again for sale on Vladi Private Islands.
Real estate and vehicles
Like most wealthy celebs, Shakira’s portfolio of high-end playthings also features an array of luxury properties and vehicles, including a home in Barcelona, a villa in Cyprus, a Miami mansion, and a rotating cast of Mercedes-Benz vehicles.
Philanthropy and charity
Shakira doesn’t just spend her massive wealth on herself; the “Queen of Latin Music” is also a dedicated philanthropist and regularly donates portions of her earnings to the Fundación Pies Descalzos, or “Barefoot Foundation,” a charity she founded in 1997 to “improve the education and social development of children in Colombia, which has suffered decades of conflict.” The foundation focuses on providing meals for children and building and improving educational infrastructure in Shakira’s hometown of Barranquilla as well as four other Colombian communities.
In addition to her efforts with the Fundación Pies Descalzos, Shakira has made a number of other notable donations over the years. In 2007, she diverted a whopping $40 million of her wealth to help rebuild community infrastructure in Peru and Nicaragua in the wake of a devastating 8.0 magnitude earthquake. Later, during the COVID-19 pandemic in 2020, Shakira donated a large supply of N95 masks for healthcare workers and ventilators for hospital patients to her hometown of Barranquilla.
Back in 2010, the UN honored Shakira with a medal to recognize her dedication to social justice, at which time the Director General of the International Labour Organization described her as a “true ambassador for children and young people.”

Shakira’s tax fraud scandal: How much did she pay?
In 2018, prosecutors in Spain initiated a tax evasion case against Shakira, alleging she lived primarily in Spain from 2012 to 2014 and therefore failed to pay around $14.4 million in taxes to the Spanish government. Spanish law requires anyone who is “domiciled” (i.e., living primarily) in Spain for more than half of the year to pay income taxes.
During the period in question, Shakira listed the Bahamas as her primary residence but did spend some time in Spain, as she was dating Gerard Piqué, a professional footballer and Spanish citizen. The couple’s first son, Milan, was also born in Barcelona during this period.
Shakira maintained that she spent far fewer than 183 days per year in Spain during each of the years in question. In an interview with Elle Magazine, the pop star opined that “Spanish tax authorities saw that I was dating a Spanish citizen and started to salivate. It's clear they wanted to go after that money no matter what."
Prosecutors in the case sought a fine of almost $26 million and a possible eight-year prison stint, but in November of 2023, Shakira took a deal to close the case, accepting a fine of around $8 million and a three-year suspended sentence to avoid going to trial. In reference to her decision to take the deal, Shakira stated, "While I was determined to defend my innocence in a trial that my lawyers were confident would have ruled in my favour [had the trial proceeded], I have made the decision to finally resolve this matter with the best interest of my kids at heart who do not want to see their mom sacrifice her personal well-being in this fight."
How much did the Shakira statue in Barranquilla cost?
In late 2023, a 21-foot-tall bronze likeness of Shakira was unveiled on a waterfront promenade in Barranquilla. The city’s then-mayor, Jaime Pumarejo, commissioned Colombian sculptor Yino Márquez to create the statue of the city’s treasured pop icon, along with a sculpture of the city’s coat of arms.
According to the New York Times, the two sculptures cost the city the equivalent of around $180,000. A plaque at the statue’s base reads, “A heart that composes, hips that don’t lie, an unmatched talent, a voice that moves the masses and bare feet that march for the good of children and humanity.”
Related: Taylor Swift net worth: The most successful entertainer joins the billionaire's club
bonds pandemic covid-19 real estate africa mexico spain

IFM’s Hat Trick and Reflections On Option-To-Buy M&A


Q4 Update: Delinquencies, Foreclosures and REO


Net Zero, The Digital Panopticon, & The Future Of Food


Pharma industry reputation remains steady at a ‘new normal’ after Covid, Harris Poll finds


These Cities Have The Highest (And Lowest) Share Of Unaffordable Neighborhoods In 2024


For-profit nursing homes are cutting corners on safety and draining resources with financial shenanigans − especially at midsize chains that dodge public scrutiny


Part 1: Current State of the Housing Market; Overview for mid-March 2024


The Question You Should Ask Whenever You’re Wrong


Trump nearly derailed democracy once − here’s what to watch out for in reelection campaign


Riley Gaines Explains How Women’s Sports Are Rigged To Promote The Trans Agenda
-

 Uncategorized3 weeks ago
All Of The Elements Are In Place For An Economic Crisis Of Staggering Proportions
-

 International6 days ago
EyePoint poaches medical chief from Apellis; Sandoz CFO, longtime BioNTech exec to retire
-

 Uncategorized4 weeks ago
California Counties Could Be Forced To Pay $300 Million To Cover COVID-Era Program
-

 Uncategorized3 weeks ago
Apparel Retailer Express Moving Toward Bankruptcy
-

 Uncategorized4 weeks ago
Industrial Production Decreased 0.1% in January
-

 International6 days ago
Walmart launches clever answer to Target’s new membership program
-

 Uncategorized4 weeks ago
RFK Jr: The Wuhan Cover-Up & The Rise Of The Biowarfare-Industrial Complex
-

 Uncategorized3 weeks ago
GOP Efforts To Shore Up Election Security In Swing States Face Challenges