In February 2023, we wrote Janet Yellen Should Focus On HOPE. The article walks through Michael Kantrowitz’s HOPE model. HOPE, or Housing, New Orders (ISM), Corporate Profits, and Employment, provides a handy acronym to track parts of the economy that are interest rate sensitive and tend to be leading recession indicators.
As we wrote in the article:
These sectors often serve as leading economic indicators. As interest rates dampen economic activity in interest rate-sensitive sectors, other sectors and facets of the economy begin to feel the impact of higher rates. HOPE illustrates the various lags or the time it takes for rate hikes to affect economic activity fully.
Over the last year, many H, O, and P measures indicate a recession is likely. E, employment, has been the lone holdout. However, there are recent signs employment trends are starting to change. Given rising unemployment may be the straw that breaks the back of the economic recovery, let’s look at some leading employment indicators to see what they indicate.
If a recession is on the horizon, these employment indicators should provide a warning. However, as you look at our graphs and read our commentary, consider that weakening labor statistics may reflect the normalization of labor conditions and not necessarily an imminent recession as they may have in the past.
Construction Employment
The H in HOPE is housing. Given the economic significance of new and used home sales and the construction of single and multifamily homes, we review the housing construction labor market and its prospects.
As is to be expected, with mortgage rates near 8%, housing activity has ground to a halt. The only sign of life is from new home sales. Homebuilders offer buyers mortgage rates 3% or so below current rates to sell homes. While successful, homebuilder sentiment is waning and is now at 7-month lows. The following comes from our September 20, 2023 Daily Commentary:
“Higher mortgage rates are resulting in a shortage of inventory of used homes and a surge in new homebuilding. Recent data shows a third of all homes for sale are new homes. That is almost three times the average ratio. While homebuilders have been taking advantage of the low inventory situation by offering home buyers reduced mortgage rates and other discounts, it appears they are starting to have concerns. The most recent NAHB builder confidence survey fell to 45. A reading below 50 means there are more homebuilders with negative sentiment than positive sentiment.”
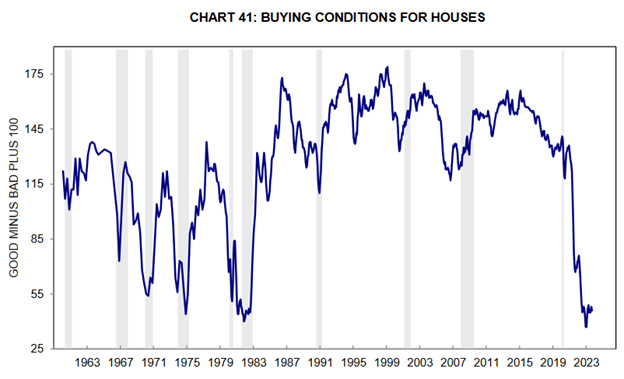
The chart below from the University of Michigan Consumer Sentiment Survey shows that consumers think buying conditions are among the worst since 1960.
Housing starts, a good leading indicator for housing construction employment, peaked in April 2022 at 1,803 units. Since then, it has fallen by about 30% to 1,269 units. Multifamily (five or more units) starts topped simultaneously and has decreased by 54%. Residential construction employment has been unchanged since January. Still, it is likely to fall as construction on existing projects will soon finish, and there will be fewer new construction projects for the current laborers.
As shown below, construction employment trends with the number of housing units under construction. Currently, the number of units under construction and construction employment are at record highs. However, the number of permits and newly started projects is falling.
The black line shows the ratio of units under construction to permits (but not started). The ratio is rising as there are fewer newly permitted projects than current ones. As we saw in 1990 and 2008, that may bode poorly for construction employment.
Temporary Help Employees And Teens
Temporary workers and the youth are typically the most expendable employees. Further, they often have little allegiance to the company and are financially the cheapest to let go. Further, they usually work in the most economically sensitive sectors.
The graph below shows the number of temporary workers commonly declines as the unemployment rate rises. Temporary employment generally peaks before recessions and declines during them. It increases consistently during periods of growth.
The number of temporary workers has been falling since March 2022. In the prior thirty years, there were very few instances where the number of temporary workers declined in a growth cycle. Those that did occur were very short-lived. This instance stands out like a sore thumb and may likely be a precursor to a higher unemployment rate.
The following graph, courtesy of Florian Kronawitter’s article Will It Hold, shows that youth unemployment is rising rapidly, albeit the current level is still amongst the lowest since 1970.
Initial and Continuing Jobless Claims
The Department of Labor provides initial and continuing jobless claims data. Unlike the monthly Bureau of Labor Statistics (BLS) employment report based on corporate and individual surveys, claims data is based on actual state filings by newly unemployed people. Accordingly, the data is more reliable. Further, it is reported weekly, making it timelier.
Initial jobless claims are hovering at a historically low level. However, continuing claims, measuring how long people who previously filed jobless claims remain unemployed, reached their highest level of the past three months at 1.834 million. Continuing Claims have been rising since September 2022, but, like most data we share in this article, the number of continuing claims is low. The duration of the current increase is not typical in non-recessionary periods. The data implies jobs are becoming more challenging to find.
Unemployment Rate
In April, the unemployment rate stood at 3.4%, the lowest in over fifty years. Since then, it has slowly turned higher, standing today at 3.9%. The unemployment rate always turns up as a recession gets underway. Therefore, we need to pay attention as there have been no instances since 1948 when the unemployment rate rose by half a percent, and the economy was not in a recession or entering one within months.
To help us better track the unemployment rate, we combine the Sahm Rule and a chart one of our clients sent in.
In one of our recent daily Commentaries, we wrote the following about the Sahm Rule:
There is an economic rule of thumb called the Sahm Rule, which has a 100% track record predicting recessions. The rule’s premise states that if the three-month moving average of the unemployment rate increases by 0.5% above the 12-month unemployment low, a recession is not only likely but has probably started already. The Bloomberg graph below shows the current Sahm measure alert has not been triggered. Last Friday, the BLS reported the unemployment rate rose to 3.9% from a low of 3.4% in April. While the difference is +0.5%, the Sahm rule uses the three-month moving average, which is 3.83%. A reading of 4% or higher in the next month’s unemployment rate would trigger the alert, as would two consecutive months of 3.9%.
After the last unemployment report, one of our astute clients sent us a graph comparing the unemployment rate to its 12-month moving average. He discovers that when the unemployment rate rises above its moving average, it starts rising rapidly, and a recession ensues.
We combine his moving average calculation and a more precise version of the Sahm Rule. Our warning occurs if the unemployment rate crosses above its 12-month moving average and the unemployment rate has risen by .3% or more over the last six months.
We highlight these instances in yellow below. Since 1948, our tool signaled every recession with only a few false signals. Other than the false alarm in 1996, the other signals occurred slightly before a recession or in the aftermath of one.
Multiple Job Holders and Part Time Workers
The following two graphs highlight the financial health of individuals. During the early part of an economic growth cycle, the number of people needing multiple jobs declines as full-time jobs become more plentiful. As the cycle gets extended and the job market tightens, some people are forced to take on multiple jobs. Currently, the number of multiple job holders is at a record high. More telling, as a percentage of the total number of employees, it is the highest since the financial crisis.
The second graph shows the strong correlation between those working part-time for economic reasons and the unemployment rate. The number of part-time workers has steadily risen over the last year.
The BLS JOLTs Report
The BLS publishes a monthly report entitled the Job Openings and Labor Turnover Report, aka JOLTs. Two good leading indicators within this report help appreciate whether the labor market is expanding or contracting.
During economic expansion, job openings tend to increase as companies expand. Accordingly, because of increased hiring, companies find it harder to hire qualified employees.
The quit rate, measuring the number of people who recently quit their jobs to the total number of employees, helps us gauge how emboldened workers are about finding a new job. A higher quit rate occurs when individuals feel the labor market is sufficiently tight, whereas they can quit and easily find a better or higher-paying job.
The graph below shows the job openings rate is still well above pre-pandemic levels but has been trending lower for a year and a half. The quit rate is now back to pre-pandemic levels. Neither indicator points to a weak job market, but their trends indicate a deteriorating job market if they continue.
Summary
Economic deterioration or normalization? That question best defines the quandary the employment market presents us.
The labor market is undoubtedly deteriorating and sending signals that have been historically valuable warnings that a recession is coming. However, the massive fiscal stimulus and odd behavioral changes occurring since 2020 should make us consider this time may be different.
It’s tough to tell if the labor market is warning of a recession or just normalizing to a more sustainable level of employment.
Time will tell, and you now have some data to watch closely to help you answer our question.
BUFFALO, NY- March 11, 2024 – Impact Journals publishes scholarly journals in the biomedical sciences with a focus on all areas of cancer and aging research. Aging is one of the most prominent journals published by Impact Journals.
Credit: Impact Journals
BUFFALO, NY- March 11, 2024 – Impact Journals publishes scholarly journals in the biomedical sciences with a focus on all areas of cancer and aging research. Aging is one of the most prominent journals published by Impact Journals.
Impact Journals will be participating as an exhibitor at the American Association for Cancer Research (AACR) Annual Meeting 2024 from April 5-10 at the San Diego Convention Center in San Diego, California. This year, the AACR meeting theme is “Inspiring Science • Fueling Progress • Revolutionizing Care.”
Visit booth #4159 at the AACR Annual Meeting 2024 to connect with members of the Agingteam.
About Aging-US:
Agingpublishes research papers in all fields of aging research including but not limited, aging from yeast to mammals, cellular senescence, age-related diseases such as cancer and Alzheimer’s diseases and their prevention and treatment, anti-aging strategies and drug development and especially the role of signal transduction pathways such as mTOR in aging and potential approaches to modulate these signaling pathways to extend lifespan. The journal aims to promote treatment of age-related diseases by slowing down aging, validation of anti-aging drugs by treating age-related diseases, prevention of cancer by inhibiting aging. Cancer and COVID-19 are age-related diseases.
Agingis indexed and archived byPubMed/Medline (abbreviated as “Aging (Albany NY)”), PubMed Central, Web of Science: Science Citation Index Expanded (abbreviated as “Aging‐US” and listed in the Cell Biology and Geriatrics & Gerontology categories), Scopus (abbreviated as “Aging” and listed in the Cell Biology and Aging categories), Biological Abstracts, BIOSIS Previews, EMBASE, META (Chan Zuckerberg Initiative) (2018-2022), and Dimensions (Digital Science).
Please visit our website at www.Aging-US.com and connect with us:
NY Fed Finds Medium, Long-Term Inflation Expectations Jump Amid Surge In Stock Market Optimism
One month after the inflation outlook tracked by the NY Fed Consumer Survey extended their late 2023 slide, with 3Y inflation expectations in January sliding to a record low 2.4% (from 2.6% in December), even as 1 and 5Y inflation forecasts remained flat, moments ago the NY Fed reported that in February there was a sharp rebound in longer-term inflation expectations, rising to 2.7% from 2.4% at the three-year ahead horizon, and jumping to 2.9% from 2.5% at the five-year ahead horizon, while the 1Y inflation outlook was flat for the 3rd month in a row, stuck at 3.0%.
The increases in both the three-year ahead and five-year ahead measures were most pronounced for respondents with at most high school degrees (in other words, the "really smart folks" are expecting deflation soon). The survey’s measure of disagreement across respondents (the difference between the 75th and 25th percentile of inflation expectations) decreased at all horizons, while the median inflation uncertainty—or the uncertainty expressed regarding future inflation outcomes—declined at the one- and three-year ahead horizons and remained unchanged at the five-year ahead horizon.
Going down the survey, we find that the median year-ahead expected price changes increased by 0.1 percentage point to 4.3% for gas; decreased by 1.8 percentage points to 6.8% for the cost of medical care (its lowest reading since September 2020); decreased by 0.1 percentage point to 5.8% for the cost of a college education; and surprisingly decreased by 0.3 percentage point for rent to 6.1% (its lowest reading since December 2020), and remained flat for food at 4.9%.
We find the rent expectations surprising because it is happening just asking rents are rising across the country.
At the same time as consumers erroneously saw sharply lower rents, median home price growth expectations remained unchanged for the fifth consecutive month at 3.0%.
Turning to the labor market, the survey found that the average perceived likelihood of voluntary and involuntary job separations increased, while the perceived likelihood of finding a job (in the event of a job loss) declined. "The mean probability of leaving one’s job voluntarily in the next 12 months also increased, by 1.8 percentage points to 19.5%."
Mean unemployment expectations - or the mean probability that the U.S. unemployment rate will be higher one year from now - decreased by 1.1 percentage points to 36.1%, the lowest reading since February 2022. Additionally, the median one-year-ahead expected earnings growth was unchanged at 2.8%, remaining slightly below its 12-month trailing average of 2.9%.
Turning to household finance, we find the following:
The median expected growth in household income remained unchanged at 3.1%. The series has been moving within a narrow range of 2.9% to 3.3% since January 2023, and remains above the February 2020 pre-pandemic level of 2.7%.
Median household spending growth expectations increased by 0.2 percentage point to 5.2%. The increase was driven by respondents with a high school degree or less.
Median year-ahead expected growth in government debt increased to 9.3% from 8.9%.
The mean perceived probability that the average interest rate on saving accounts will be higher in 12 months increased by 0.6 percentage point to 26.1%, remaining below its 12-month trailing average of 30%.
Perceptions about households’ current financial situations deteriorated somewhat with fewer respondents reporting being better off than a year ago. Year-ahead expectations also deteriorated marginally with a smaller share of respondents expecting to be better off and a slightly larger share of respondents expecting to be worse off a year from now.
The mean perceived probability that U.S. stock prices will be higher 12 months from now increased by 1.4 percentage point to 38.9%.
At the same time, perceptions and expectations about credit access turned less optimistic: "Perceptions of credit access compared to a year ago deteriorated with a larger share of respondents reporting tighter conditions and a smaller share reporting looser conditions compared to a year ago."
Also, a smaller percentage of consumers, 11.45% vs 12.14% in prior month, expect to not be able to make minimum debt payment over the next three months
Last, and perhaps most humorous, is the now traditional cognitive dissonance one observes with these polls, because at a time when long-term inflation expectations jumped, which clearly suggests that financial conditions will need to be tightened, the number of respondents expecting higher stock prices one year from today jumped to the highest since November 2021... which incidentally is just when the market topped out during the last cycle before suffering a painful bear market.
Homes listed for sale in early June sell for $7,700 more
New Zillow research suggests the spring home shopping season may see a second wave this summer if mortgage rates fall
The post Homes listed for sale in…
A Zillow analysis of 2023 home sales finds homes listed in the first two weeks of June sold for 2.3% more.
The best time to list a home for sale is a month later than it was in 2019, likely driven by mortgage rates.
The best time to list can be as early as the second half of February in San Francisco, and as late as the first half of July in New York and Philadelphia.
Spring home sellers looking to maximize their sale price may want to wait it out and list their home for sale in the first half of June. A new Zillow® analysis of 2023 sales found that homes listed in the first two weeks of June sold for 2.3% more, a $7,700 boost on a typical U.S. home.
The best time to list consistently had been early May in the years leading up to the pandemic. The shift to June suggests mortgage rates are strongly influencing demand on top of the usual seasonality that brings buyers to the market in the spring. This home-shopping season is poised to follow a similar pattern as that in 2023, with the potential for a second wave if the Federal Reserve lowers interest rates midyear or later.
The 2.3% sale price premium registered last June followed the first spring in more than 15 years with mortgage rates over 6% on a 30-year fixed-rate loan. The high rates put home buyers on the back foot, and as rates continued upward through May, they were still reassessing and less likely to bid boldly. In June, however, rates pulled back a little from 6.79% to 6.67%, which likely presented an opportunity for determined buyers heading into summer. More buyers understood their market position and could afford to transact, boosting competition and sale prices.
The old logic was that sellers could earn a premium by listing in late spring, when search activity hit its peak. Now, with persistently low inventory, mortgage rate fluctuations make their own seasonality. First-time home buyers who are on the edge of qualifying for a home loan may dip in and out of the market, depending on what’s happening with rates. It is almost certain the Federal Reserve will push back any interest-rate cuts to mid-2024 at the earliest. If mortgage rates follow, that could bring another surge of buyers later this year.
Mortgage rates have been impacting affordability and sale prices since they began rising rapidly two years ago. In 2022, sellers nationwide saw the highest sale premium when they listed their home in late March, right before rates barreled past 5% and continued climbing.
Zillow’s research finds the best time to list can vary widely by metropolitan area. In 2023, it was as early as the second half of February in San Francisco, and as late as the first half of July in New York. Thirty of the top 35 largest metro areas saw for-sale listings command the highest sale prices between May and early July last year.
Zillow also found a wide range in the sale price premiums associated with homes listed during those peak periods. At the hottest time of the year in San Jose, homes sold for 5.5% more, a $88,000 boost on a typical home. Meanwhile, homes in San Antonio sold for 1.9% more during that same time period.
We use cookies on our website to give you the most relevant experience by remembering your preferences and repeat visits. By clicking “Accept”, you consent to the use of ALL the cookies.
This website uses cookies to improve your experience while you navigate through the website. Out of these, the cookies that are categorized as necessary are stored on your browser as they are essential for the working of basic functionalities of the website. We also use third-party cookies that help us analyze and understand how you use this website. These cookies will be stored in your browser only with your consent. You also have the option to opt-out of these cookies. But opting out of some of these cookies may affect your browsing experience.
Necessary cookies are absolutely essential for the website to function properly. These cookies ensure basic functionalities and security features of the website, anonymously.
Cookie
Duration
Description
cookielawinfo-checbox-analytics
11 months
This cookie is set by GDPR Cookie Consent plugin. The cookie is used to store the user consent for the cookies in the category "Analytics".
cookielawinfo-checbox-functional
11 months
The cookie is set by GDPR cookie consent to record the user consent for the cookies in the category "Functional".
cookielawinfo-checbox-others
11 months
This cookie is set by GDPR Cookie Consent plugin. The cookie is used to store the user consent for the cookies in the category "Other.
cookielawinfo-checkbox-necessary
11 months
This cookie is set by GDPR Cookie Consent plugin. The cookies is used to store the user consent for the cookies in the category "Necessary".
cookielawinfo-checkbox-performance
11 months
This cookie is set by GDPR Cookie Consent plugin. The cookie is used to store the user consent for the cookies in the category "Performance".
viewed_cookie_policy
11 months
The cookie is set by the GDPR Cookie Consent plugin and is used to store whether or not user has consented to the use of cookies. It does not store any personal data.
Functional cookies help to perform certain functionalities like sharing the content of the website on social media platforms, collect feedbacks, and other third-party features.
Performance cookies are used to understand and analyze the key performance indexes of the website which helps in delivering a better user experience for the visitors.
Analytical cookies are used to understand how visitors interact with the website. These cookies help provide information on metrics the number of visitors, bounce rate, traffic source, etc.
Advertisement cookies are used to provide visitors with relevant ads and marketing campaigns. These cookies track visitors across websites and collect information to provide customized ads.


