Uncategorized
E-scooter market size to grow by 4261.82 thousand units from 2022 to 2027: A descriptive analysis of customer landscape, vendor assessment, and market dynamics – Technavio
E-scooter market size to grow by 4261.82 thousand units from 2022 to 2027: A descriptive analysis of customer landscape, vendor assessment, and market dynamics – Technavio
PR Newswire
NEW YORK, Jan. 18, 2023
NEW YORK, Jan. 18, 2023 /PRNewswire/ — …
Share this:

E-scooter market size to grow by 4261.82 thousand units from 2022 to 2027: A descriptive analysis of customer landscape, vendor assessment, and market dynamics - Technavio
PR Newswire
NEW YORK, Jan. 18, 2023
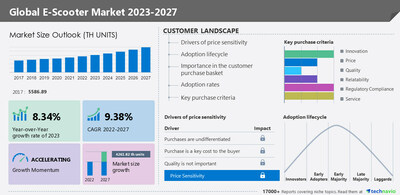
NEW YORK, Jan. 18, 2023 /PRNewswire/ -- The global e-scooter market size is estimated to increase by 4261.82 thousand units from 2022 to 2027. The market's growth momentum will accelerate at a CAGR of 9.38% during the forecast period, according to Technavio - Request a sample report
Global e-scooter market – Vendor analysis
Vendor offerings -
- Bajaj Auto Ltd. - The company offers e-scooters such as Chetak.
- BMW AG - The company offers e-scooters such as CE 04.
- Bodo Vehicle Group Co. Ltd. - The company offers e-scooters such as Panther, Rank, and Cyclone.
- Electrotherm Ltd - The company offers e-scooters such as Electrotherm Yo Style ER and Yo Spark.
- For details on vendors and their offerings – Buy the report!
Vendor landscape –
The global e-scooter market is fragmented, with the presence of several vendors. A few prominent vendors that offer e-scooter in the market are Ather Energy Pvt. Ltd., Bajaj Auto Ltd., BMW AG, Bodo Vehicle Group Co. Ltd., Electrotherm Ltd, GOVECS AG, Greaves Cotton Ltd., Hero Electric Vehicles Pvt. Ltd, Honda Motor Co. Ltd, KWANG YANG MOTOR Co. Ltd., Mahindra and Mahindra Ltd., Niu Technologies, Okinawa Autotech Pvt. Ltd., Piaggio and C. Spa, Songguo New Energy Automobile Co Ltd, TVS Motor Co. Ltd., Vmoto Ltd., Yadea Group Holdings Ltd, Z Electric Vehicle Corp, and Zhejiang Luyuan Electric Vehicle Co Ltd and others.
Awareness about reducing vehicular emissions, along with the rising demand for two-wheelers, is increasing the demand for electric scooters. This is encouraging several scooter manufacturers across the world to enter the market through acquisitions, partnerships, and joint ventures. Moreover, government regulations for the adoption of EVs will encourage vendors to innovate and develop e-scooters during the forecast period, which will drive market growth. Such factors will intensify competition in the market, especially among major players.
Global e-scooter market - Customer landscape
To help companies evaluate and develop growth strategies, the report outlines –
- Key purchase criteria
- Adoption rates
- Adoption lifecycle
- Drivers of price sensitivity
Global e-scooter market - Segmentation assessment
Segment overview
Technavio has segmented the market based on product (retro, standing/self-balancing, and folding) and battery type (sealed lead acid batteries and lithium-ion batteries)
- The sealed lead acid batteries segment will grow at a significant rate during the forecast period. SLA batteries can combine hydrogen and oxygen to produce water and prevent water loss. This segment mainly caters to price-sensitive customer segments. Hence, the growth of this segment is driven by the low cost and availability of SLA batteries.
Geography overview
Based on geography, the global e-scooter market is segmented into APAC, North America, Europe, South America, and Middle East and Africa. The report provides actionable insights and estimates the contribution of all regions to the growth of the global e-scooter market.
- APAC is estimated to account for 81% of the growth of the global market during the forecast period. Environmental concerns and the focus on reducing vehicular emissions are increasing the adoption of e-scooters. The adoption of e-scooters in Asian countries, including China, India, Indonesia, Thailand, and Vietnam, is growing. Manufacturers are launching e-scooters with advanced features, such as a smartphone connectivity suite. In addition, many governments provide subsidies and incentives for the purchase of e-scooters. These factors will drive the market's growth in APAC during the forecast period.
Global e-scooter market – Market dynamics
Leading drivers - The declining prices of Li-ion batteries are driving the market's growth. The growth of the market depends significantly on the use of Li-ion batteries in vehicles. Over the past decade, the manufacturing cost of Li-ion batteries has declined rapidly, which is expected to have a positive impact on the demand for Li-ion batteries. Moreover, with increasing production scale and improvements in manufacturing efficiency, the cost of Li-ion batteries is declining, which will increase the adoption of Li-ion batteries in electric two-wheelers. These factors will fuel the market's growth during the forecast period.
Key trends - The development of high-performance e-scooters is a key trend in the market. The decline in battery prices, low operating and maintenance costs, subsidies and incentives offered by governments, and increasing awareness about vehicular emissions are increasing the adoption of e-scooters. Two-wheeler manufacturers are investing in high-performance electric motorcycles. Mentioned below are a few initiatives by motorcycle manufacturers to develop high-performance electric motorcycles. The growing demand for e-motorcycles has propelled the above-mentioned manufacturers to invest in high-performance e-scooters.
Major challenges - The high costs and maintenance complexities of e-scooters will challenge the global e-scooter market growth. Most e-scooters have in-wheel motors, wherein the motor is fitted to the hub of the wheel. The motor, braking components, and wheel are clubbed into a single unit. This makes wheel replacement and repairs difficult, as the motor has to be removed completely while replacing the wheel or tire. Though the design of in-wheel motors is not complex, there is a high probability of potential damage to in-wheel motors while replacing the tire. In addition, there are a limited number of service centers and skilled technicians for electric two-wheelers when compared to conventional IC engine-based two-wheelers. Hence, maintenance complexities limit the adoption of electric two-wheelers with in-wheel motors. These factors will impede the growth of the global e-scooter market during the forecast period.
What are the key data covered in this e-scooter market report?
- CAGR of the market during the forecast period
- Detailed information on factors that will drive the growth of the e-scooter market between 2023 and 2027
- Precise estimation of the size of the E-scooter market and its contribution to the parent market
- Accurate predictions about upcoming trends and changes in consumer behavior
- Growth of the E-scooter market across APAC, North America, Europe, South America, and Middle East and Africa
- A thorough analysis of the market's competitive landscape and detailed information about vendors
- Comprehensive analysis of factors that will challenge the growth of e-scooter market vendors
Gain instant access to 17,000+ market research reports.
Technavio's SUBSCRIPTION platform
Related Reports:
The electric kick scooter market size is expected to increase by USD 1.51 billion from 2021 to 2026, and the market's growth momentum will accelerate at a CAGR of 10.23%. This report extensively covers segmentation by variant (25V to 50V, less than 25V, and more than 50V) and geography (Europe, North America, APAC, South America, and Middle East and Africa).
The one-wheel electric scooter market size is expected to increase by USD 35.42 million from 2021 to 2026, and the market's growth momentum will accelerate at a CAGR of 5.6%. This report extensively covers segmentation by distribution channel (offline and online) and geography (Europe, North America, APAC, the Middle East and Africa, and South America).
E-Scooter Market Scope | |
Report Coverage | Details |
Page number | 165 |
Base year | 2022 |
Historic period | 2017-2021 |
Forecast period | 2023-2027 |
Growth momentum & CAGR | Accelerate at a CAGR of 9.38% |
Market growth 2023-2027 | 4261.82 thousand units |
Market structure | Fragmented |
YoY growth 2022-2023 (%) | 8.34 |
Regional analysis | APAC, North America, Europe, South America, and Middle East and Africa |
Performing market contribution | APAC at 81% |
Key countries | US, China, Japan, Taiwan, and France |
Competitive landscape | Leading vendors, market positioning of vendors, competitive strategies, and industry risks |
Key companies profiled | Ather Energy Pvt. Ltd., Bajaj Auto Ltd., BMW AG, Bodo Vehicle Group Co. Ltd., Electrotherm Ltd, GOVECS AG, Greaves Cotton Ltd., Hero Electric Vehicles Pvt. Ltd, Honda Motor Co. Ltd, KWANG YANG MOTOR Co. Ltd., Mahindra and Mahindra Ltd., Niu Technologies, Okinawa Autotech Pvt. Ltd., Piaggio and C. Spa, Songguo New Energy Automobile Co Ltd, TVS Motor Co. Ltd., Vmoto Ltd., Yadea Group Holdings Ltd, Z Electric Vehicle Corp, and Zhejiang Luyuan Electric Vehicle Co Ltd |
Market dynamics | Parent market analysis, market growth inducers and obstacles, fast-growing and slow-growing segment analysis, COVID-19 impact and recovery analysis and future consumer dynamics, and market condition analysis for the forecast period. |
Customization purview | If our report has not included the data that you are looking for, you can reach out to our analysts and get segments customized. |
Customization purview | If our report has not included the data that you are looking for, you can reach out to our analysts and get segments customized. |
Browse for Technavio's consumer discretionary market reports
Table of contents
1 Executive Summary
- 1.1 Market overview
- Exhibit 01: Executive Summary – Chart on Market Overview
- Exhibit 02: Executive Summary – Data Table on Market Overview
- Exhibit 03: Executive Summary – Chart on Global Market Characteristics
- Exhibit 04: Executive Summary – Chart on Market by Geography
- Exhibit 05: Executive Summary – Chart on Market Segmentation by Battery Type
- Exhibit 06: Executive Summary – Chart on Market Segmentation by Product
- Exhibit 07: Executive Summary – Chart on Incremental Growth
- Exhibit 08: Executive Summary – Data Table on Incremental Growth
- Exhibit 09: Executive Summary – Chart on Vendor Market Positioning
2 Market Landscape
- 2.1 Market ecosystem
- Exhibit 10: Parent market
- Exhibit 11: Market Characteristics
3 Market Sizing
- 3.1 Market definition
- Exhibit 12: Offerings of vendors included in the market definition
- 3.2 Market segment analysis
- Exhibit 13: Market segments
- 3.3 Market size 2022
- 3.4 Market outlook: Forecast for 2022-2027
- Exhibit 14: Chart on Global - Market size and forecast 2022-2027 (thousand units)
- Exhibit 15: Data Table on Global - Market size and forecast 2022-2027 (thousand units)
- Exhibit 16: Chart on Global Market- Year-over-year growth 2022-2027 (%)
- Exhibit 17: Data Table on Global Market- Year-over-year growth 2022-2027 (%)
4 Historic Market Size
- 4.1 Global e-scooter market 2017 - 2021
- Exhibit 18: Historic Market Size – Data Table on Global e-scooter market 2017 - 2021 (thousand units)
- 4.2 Battery type Segment Analysis 2017 - 2021
- Exhibit 19: Historic Market Size – Battery type Segment 2017 - 2021 (thousand units)
- 4.3 Product Segment Analysis 2017 - 2021
- Exhibit 20: Historic Market Size – Product Segment 2017 - 2021 (thousand units)
- 4.4 Geography Segment Analysis 2017 - 2021
- Exhibit 21: Historic Market Size – Geography Segment 2017 - 2021 (thousand units)
- 4.5 Country Segment Analysis 2017 - 2021
- Exhibit 22: Historic Market Size – Country Segment 2017 - 2021 (thousand units)
5 Five Forces Analysis
- 5.1 Five forces summary
- Exhibit 23: Five forces analysis - Comparison between 2022 and 2027
- 5.2 Bargaining power of buyers
- Exhibit 24: Chart on Bargaining power of buyers – Impact of key factors 2022 and 2027
- 5.3 Bargaining power of suppliers
- Exhibit 25: Bargaining power of suppliers – Impact of key factors in 2022 and 2027
- 5.4 Threat of new entrants
- Exhibit 26: Threat of new entrants – Impact of key factors in 2022 and 2027
- 5.5 Threat of substitutes
- Exhibit 27: Threat of substitutes – Impact of key factors in 2022 and 2027
- 5.6 Threat of rivalry
- Exhibit 28: Threat of rivalry – Impact of key factors in 2022 and 2027
- 5.7 Market condition
- Exhibit 29: Chart on Market condition - Five forces 2022 and 2027
6 Market Segmentation by Battery Type
- 6.1 Market segments
- Exhibit 30: Chart on Battery Type - Market share 2022-2027 (%)
- Exhibit 31: Data Table on Battery Type - Market share 2022-2027 (%)
- 6.2 Comparison by Battery Type
- Exhibit 32: Chart on Comparison by Battery Type
- Exhibit 33: Data Table on Comparison by Battery Type
- 6.3 Sealed lead acid batteries - Market size and forecast 2022-2027
- Exhibit 34: Chart on Sealed lead acid batteries - Market size and forecast 2022-2027 (thousand units)
- Exhibit 35: Data Table on Sealed lead acid batteries - Market size and forecast 2022-2027 (thousand units)
- Exhibit 36: Chart on Sealed lead acid batteries - Year-over-year growth 2022-2027 (%)
- Exhibit 37: Data Table on Sealed lead acid batteries - Year-over-year growth 2022-2027 (%)
- 6.4 Lithium-ion batteries - Market size and forecast 2022-2027
- Exhibit 38: Chart on Lithium-ion batteries - Market size and forecast 2022-2027 (thousand units)
- Exhibit 39: Data Table on Lithium-ion batteries - Market size and forecast 2022-2027 (thousand units)
- Exhibit 40: Chart on Lithium-ion batteries - Year-over-year growth 2022-2027 (%)
- Exhibit 41: Data Table on Lithium-ion batteries - Year-over-year growth 2022-2027 (%)
- 6.5 Market opportunity by Battery Type
- Exhibit 42: Market opportunity by Battery Type (thousand units)
7 Market Segmentation by Product
- 7.1 Market segments
- Exhibit 43: Chart on Product - Market share 2022-2027 (%)
- Exhibit 44: Data Table on Product - Market share 2022-2027 (%)
- 7.2 Comparison by Product
- Exhibit 45: Chart on Comparison by Product
- Exhibit 46: Data Table on Comparison by Product
- 7.3 Retro - Market size and forecast 2022-2027
- Exhibit 47: Chart on Retro - Market size and forecast 2022-2027 (thousand units)
- Exhibit 48: Data Table on Retro - Market size and forecast 2022-2027 (thousand units)
- Exhibit 49: Chart on Retro - Year-over-year growth 2022-2027 (%)
- Exhibit 50: Data Table on Retro - Year-over-year growth 2022-2027 (%)
- 7.4 Standing/self-balancing - Market size and forecast 2022-2027
- Exhibit 51: Chart on Standing/self-balancing - Market size and forecast 2022-2027 (thousand units)
- Exhibit 52: Data Table on Standing/self-balancing - Market size and forecast 2022-2027 (thousand units)
- Exhibit 53: Chart on Standing/self-balancing - Year-over-year growth 2022-2027 (%)
- Exhibit 54: Data Table on Standing/self-balancing - Year-over-year growth 2022-2027 (%)
- 7.5 Folding - Market size and forecast 2022-2027
- Exhibit 55: Chart on Folding - Market size and forecast 2022-2027 (thousand units)
- Exhibit 56: Data Table on Folding - Market size and forecast 2022-2027 (thousand units)
- Exhibit 57: Chart on Folding - Year-over-year growth 2022-2027 (%)
- Exhibit 58: Data Table on Folding - Year-over-year growth 2022-2027 (%)
- 7.6 Market opportunity by Product
- Exhibit 59: Market opportunity by Product (thousand units)
8 Customer Landscape
- 8.1 Customer landscape overview
- Exhibit 60: Analysis of price sensitivity, lifecycle, customer purchase basket, adoption rates, and purchase criteria
9 Geographic Landscape
- 9.1 Geographic segmentation
- Exhibit 61: Chart on Market share by geography 2022-2027 (%)
- Exhibit 62: Data Table on Market share by geography 2022-2027 (%)
- 9.2 Geographic comparison
- Exhibit 63: Chart on Geographic comparison
- Exhibit 64: Data Table on Geographic comparison
- 9.3 APAC - Market size and forecast 2022-2027
- Exhibit 65: Chart on APAC - Market size and forecast 2022-2027 (thousand units)
- Exhibit 66: Data Table on APAC - Market size and forecast 2022-2027 (thousand units)
- Exhibit 67: Chart on APAC - Year-over-year growth 2022-2027 (%)
- Exhibit 68: Data Table on APAC - Year-over-year growth 2022-2027 (%)
- 9.4 North America - Market size and forecast 2022-2027
- Exhibit 69: Chart on North America - Market size and forecast 2022-2027 (thousand units)
- Exhibit 70: Data Table on North America - Market size and forecast 2022-2027 (thousand units)
- Exhibit 71: Chart on North America - Year-over-year growth 2022-2027 (%)
- Exhibit 72: Data Table on North America - Year-over-year growth 2022-2027 (%)
- 9.5 Europe - Market size and forecast 2022-2027
- Exhibit 73: Chart on Europe - Market size and forecast 2022-2027 (thousand units)
- Exhibit 74: Data Table on Europe - Market size and forecast 2022-2027 (thousand units)
- Exhibit 75: Chart on Europe - Year-over-year growth 2022-2027 (%)
- Exhibit 76: Data Table on Europe - Year-over-year growth 2022-2027 (%)
- 9.6 South America - Market size and forecast 2022-2027
- Exhibit 77: Chart on South America - Market size and forecast 2022-2027 (thousand units)
- Exhibit 78: Data Table on South America - Market size and forecast 2022-2027 (thousand units)
- Exhibit 79: Chart on South America - Year-over-year growth 2022-2027 (%)
- Exhibit 80: Data Table on South America - Year-over-year growth 2022-2027 (%)
- 9.7 Middle East and Africa - Market size and forecast 2022-2027
- Exhibit 81: Chart on Middle East and Africa - Market size and forecast 2022-2027 (thousand units)
- Exhibit 82: Data Table on Middle East and Africa - Market size and forecast 2022-2027 (thousand units)
- Exhibit 83: Chart on Middle East and Africa - Year-over-year growth 2022-2027 (%)
- Exhibit 84: Data Table on Middle East and Africa - Year-over-year growth 2022-2027 (%)
- 9.8 China - Market size and forecast 2022-2027
- Exhibit 85: Chart on China - Market size and forecast 2022-2027 (thousand units)
- Exhibit 86: Data Table on China - Market size and forecast 2022-2027 (thousand units)
- Exhibit 87: Chart on China - Year-over-year growth 2022-2027 (%)
- Exhibit 88: Data Table on China - Year-over-year growth 2022-2027 (%)
- 9.9 Japan - Market size and forecast 2022-2027
- Exhibit 89: Chart on Japan - Market size and forecast 2022-2027 (thousand units)
- Exhibit 90: Data Table on Japan - Market size and forecast 2022-2027 (thousand units)
- Exhibit 91: Chart on Japan - Year-over-year growth 2022-2027 (%)
- Exhibit 92: Data Table on Japan - Year-over-year growth 2022-2027 (%)
- 9.10 Taiwan - Market size and forecast 2022-2027
- Exhibit 93: Chart on Taiwan - Market size and forecast 2022-2027 (thousand units)
- Exhibit 94: Data Table on Taiwan - Market size and forecast 2022-2027 (thousand units)
- Exhibit 95: Chart on Taiwan - Year-over-year growth 2022-2027 (%)
- Exhibit 96: Data Table on Taiwan - Year-over-year growth 2022-2027 (%)
- 9.11 US - Market size and forecast 2022-2027
- Exhibit 97: Chart on US - Market size and forecast 2022-2027 (thousand units)
- Exhibit 98: Data Table on US - Market size and forecast 2022-2027 (thousand units)
- Exhibit 99: Chart on US - Year-over-year growth 2022-2027 (%)
- Exhibit 100: Data Table on US - Year-over-year growth 2022-2027 (%)
- 9.12 France - Market size and forecast 2022-2027
- Exhibit 101: Chart on France - Market size and forecast 2022-2027 (thousand units)
- Exhibit 102: Data Table on France - Market size and forecast 2022-2027 (thousand units)
- Exhibit 103: Chart on France - Year-over-year growth 2022-2027 (%)
- Exhibit 104: Data Table on France - Year-over-year growth 2022-2027 (%)
- 9.13 Market opportunity by geography
- Exhibit 105: Market opportunity by geography (thousand units)
10 Drivers, Challenges, and Trends
- 10.1 Market drivers
- 10.2 Market challenges
- 10.3 Impact of drivers and challenges
- Exhibit 106: Impact of drivers and challenges in 2022 and 2027
- 10.4 Market trends
11 Vendor Landscape
- 11.1 Overview
- 11.2 Vendor landscape
- Exhibit 107: Overview on Criticality of inputs and Factors of differentiation
- 11.3 Landscape disruption
- Exhibit 108: Overview on factors of disruption
- 11.4 Industry risks
- Exhibit 109: Impact of key risks on business
12 Vendor Analysis
- 12.1 Vendors covered
- Exhibit 110: Vendors covered
- 12.2 Market positioning of vendors
- Exhibit 111: Matrix on vendor position and classification
- 12.3 Bajaj Auto Ltd.
- Exhibit 112: Bajaj Auto Ltd. - Overview
- Exhibit 113: Bajaj Auto Ltd. - Business segments
- Exhibit 114: Bajaj Auto Ltd. - Key offerings
- Exhibit 115: Bajaj Auto Ltd. - Segment focus
- 12.4 BMW AG
- Exhibit 116: BMW AG - Overview
- Exhibit 117: BMW AG - Business segments
- Exhibit 118: BMW AG - Key offerings
- Exhibit 119: BMW AG - Segment focus
- 12.5 Bodo Vehicle Group Co. Ltd.
- Exhibit 120: Bodo Vehicle Group Co. Ltd. - Overview
- Exhibit 121: Bodo Vehicle Group Co. Ltd. - Product / Service
- Exhibit 122: Bodo Vehicle Group Co. Ltd. - Key offerings
- 12.6 Electrotherm Ltd
- Exhibit 123: Electrotherm Ltd - Overview
- Exhibit 124: Electrotherm Ltd - Business segments
- Exhibit 125: Electrotherm Ltd - Key offerings
- Exhibit 126: Electrotherm Ltd - Segment focus
- 12.7 Greaves Cotton Ltd.
- Exhibit 127: Greaves Cotton Ltd. - Overview
- Exhibit 128: Greaves Cotton Ltd. - Business segments
- Exhibit 129: Greaves Cotton Ltd. - Key news
- Exhibit 130: Greaves Cotton Ltd. - Key offerings
- Exhibit 131: Greaves Cotton Ltd. - Segment focus
- 12.8 Hero Electric Vehicles Pvt. Ltd
- Exhibit 132: Hero Electric Vehicles Pvt. Ltd - Overview
- Exhibit 133: Hero Electric Vehicles Pvt. Ltd - Business segments
- Exhibit 134: Hero Electric Vehicles Pvt. Ltd - Key offerings
- Exhibit 135: Hero Electric Vehicles Pvt. Ltd - Segment focus
- 12.9 Honda Motor Co. Ltd
- Exhibit 136: Honda Motor Co. Ltd - Overview
- Exhibit 137: Honda Motor Co. Ltd - Business segments
- Exhibit 138: Honda Motor Co. Ltd - Key news
- Exhibit 139: Honda Motor Co. Ltd - Key offerings
- Exhibit 140: Honda Motor Co. Ltd - Segment focus
- 12.10 Mahindra and Mahindra Ltd.
- Exhibit 141: Mahindra and Mahindra Ltd. - Overview
- Exhibit 142: Mahindra and Mahindra Ltd. - Business segments
- Exhibit 143: Mahindra and Mahindra Ltd. - Key news
- Exhibit 144: Mahindra and Mahindra Ltd. - Key offerings
- Exhibit 145: Mahindra and Mahindra Ltd. - Segment focus
- 12.11 Niu Technologies
- Exhibit 146: Niu Technologies - Overview
- Exhibit 147: Niu Technologies - Product / Service
- Exhibit 148: Niu Technologies - Key offerings
- 12.12 Piaggio and C. Spa
- Exhibit 149: Piaggio and C. Spa - Overview
- Exhibit 150: Piaggio and C. Spa - Business segments
- Exhibit 151: Piaggio and C. Spa - Key offerings
- Exhibit 152: Piaggio and C. Spa - Segment focus
- 12.13 Songguo New Energy Automobile Co Ltd
- Exhibit 153: Songguo New Energy Automobile Co Ltd - Overview
- Exhibit 154: Songguo New Energy Automobile Co Ltd - Product / Service
- Exhibit 155: Songguo New Energy Automobile Co Ltd - Key offerings
- 12.14 TVS Motor Co. Ltd.
- Exhibit 156: TVS Motor Co. Ltd. - Overview
- Exhibit 157: TVS Motor Co. Ltd. - Business segments
- Exhibit 158: TVS Motor Co. Ltd. - Key news
- Exhibit 159: TVS Motor Co. Ltd. - Key offerings
- Exhibit 160: TVS Motor Co. Ltd. - Segment focus
- 12.15 Yadea Group Holdings Ltd
- Exhibit 161: Yadea Group Holdings Ltd - Overview
- Exhibit 162: Yadea Group Holdings Ltd - Product / Service
- Exhibit 163: Yadea Group Holdings Ltd - Key offerings
- 12.16 Z Electric Vehicle Corp
- Exhibit 164: Z Electric Vehicle Corp - Overview
- Exhibit 165: Z Electric Vehicle Corp - Product / Service
- Exhibit 166: Z Electric Vehicle Corp - Key offerings
- 12.17 Zhejiang Luyuan Electric Vehicle Co Ltd
- Exhibit 167: Zhejiang Luyuan Electric Vehicle Co Ltd - Overview
- Exhibit 168: Zhejiang Luyuan Electric Vehicle Co Ltd - Product / Service
- Exhibit 169: Zhejiang Luyuan Electric Vehicle Co Ltd - Key offerings
13 Appendix
- 13.1 Scope of the report
- 13.2 Inclusions and exclusions checklist
- Exhibit 170: Inclusions checklist
- Exhibit 171: Exclusions checklist
- 13.3 Currency conversion rates for US$
- Exhibit 172: Currency conversion rates for US$
- 13.4 Research methodology
- Exhibit 173: Research methodology
- Exhibit 174: Validation techniques employed for market sizing
- Exhibit 175: Information sources
- 13.5 List of abbreviations
- Exhibit 176: List of abbreviations
Technavio is a leading global technology research and advisory company. Their research and analysis focus on emerging market trends and provide actionable insights to help businesses identify market opportunities and develop effective strategies to optimize their market positions. With over 500 specialized analysts, Technavio's report library consists of more than 17,000 reports and counting, covering 800 technologies, spanning across 50 countries. Their client base consists of enterprises of all sizes, including more than 100 Fortune 500 companies. This growing client base relies on Technavio's comprehensive coverage, extensive research, and actionable market insights to identify opportunities in existing and potential markets and assess their competitive positions within changing market scenarios.
Contact
Technavio Research
Jesse Maida
Media & Marketing Executive
US: +1 844 364 1100
UK: +44 203 893 3200
Email: media@technavio.com
Website: www.technavio.com/

View original content to download multimedia:https://www.prnewswire.com/news-releases/e-scooter-market-size-to-grow-by-4261-82-thousand-units-from-2022-to-2027-a-descriptive-analysis-of-customer-landscape-vendor-assessment-and-market-dynamics---technavio-301723075.html
SOURCE Technavio
Uncategorized
Key shipping company files for Chapter 11 bankruptcy
The Illinois-based general freight trucking company filed for Chapter 11 bankruptcy to reorganize.
Share this:


The U.S. trucking industry has had a difficult beginning of the year for 2024 with several logistics companies filing for bankruptcy to seek either a Chapter 7 liquidation or Chapter 11 reorganization.
The Covid-19 pandemic caused a lot of supply chain issues for logistics companies and also created a shortage of truck drivers as many left the business for other occupations. Shipping companies, in the meantime, have had extreme difficulty recruiting new drivers for thousands of unfilled jobs.
Related: Tesla rival’s filing reveals Chapter 11 bankruptcy is possible
Freight forwarder company Boateng Logistics joined a growing list of shipping companies that permanently shuttered their businesses as the firm on Feb. 22 filed for Chapter 7 bankruptcy with plans to liquidate.
The Carlsbad, Calif., logistics company filed its petition in the U.S. Bankruptcy Court for the Southern District of California listing assets up to $50,000 and and $1 million to $10 million in liabilities. Court papers said it owed millions of dollars in liabilities to trucking, logistics and factoring companies. The company filed bankruptcy before any creditors could take legal action.
Lawsuits force companies to liquidate in bankruptcy
Lawsuits, however, can force companies to file bankruptcy, which was the case for J.J. & Sons Logistics of Clint, Texas, which on Jan. 22 filed for Chapter 7 liquidation in the U.S. Bankruptcy Court for the Western District of Texas. The company filed bankruptcy four days before the scheduled start of a trial for a wrongful death lawsuit filed by the family of a former company truck driver who had died from drowning in 2016.
California-based logistics company Wise Choice Trans Corp. shut down operations and filed for Chapter 7 liquidation on Jan. 4 in the U.S. Bankruptcy Court for the Northern District of California, listing $1 million to $10 million in assets and liabilities.
The Hayward, Calif., third-party logistics company, founded in 2009, provided final mile, less-than-truckload and full truckload services, as well as warehouse and fulfillment services in the San Francisco Bay Area.
The Chapter 7 filing also implemented an automatic stay against all legal proceedings, as the company listed its involvement in four legal actions that were ongoing or concluded. Court papers reportedly did not list amounts for damages.
In some cases, debtors don't have to take a drastic action, such as a liquidation, and can instead file a Chapter 11 reorganization.
Shutterstock
Nationwide Cargo seeks to reorganize its business
Nationwide Cargo Inc., a general freight trucking company that also hauls fresh produce and meat, filed for Chapter 11 bankruptcy protection in the U.S. Bankruptcy Court for the Northern District of Illinois with plans to reorganize its business.
The East Dundee, Ill., shipping company listed $1 million to $10 million in assets and $10 million to $50 million in liabilities in its petition and said funds will not be available to pay unsecured creditors. The company operates with 183 trucks and 171 drivers, FreightWaves reported.
Nationwide Cargo's three largest secured creditors in the petition were Equify Financial LLC (owed about $3.5 million,) Commercial Credit Group (owed about $1.8 million) and Continental Bank NA (owed about $676,000.)
The shipping company reported gross revenue of about $34 million in 2022 and about $40 million in 2023. From Jan. 1 until its petition date, the company generated $9.3 million in gross revenue.
Related: Veteran fund manager picks favorite stocks for 2024
bankruptcy pandemic covid-19 stocksUncategorized
Key shipping company files Chapter 11 bankruptcy
The Illinois-based general freight trucking company filed for Chapter 11 bankruptcy to reorganize.
Share this:

The U.S. trucking industry has had a difficult beginning of the year for 2024 with several logistics companies filing for bankruptcy to seek either a Chapter 7 liquidation or Chapter 11 reorganization.
The Covid-19 pandemic caused a lot of supply chain issues for logistics companies and also created a shortage of truck drivers as many left the business for other occupations. Shipping companies, in the meantime, have had extreme difficulty recruiting new drivers for thousands of unfilled jobs.
Related: Tesla rival’s filing reveals Chapter 11 bankruptcy is possible
Freight forwarder company Boateng Logistics joined a growing list of shipping companies that permanently shuttered their businesses as the firm on Feb. 22 filed for Chapter 7 bankruptcy with plans to liquidate.
The Carlsbad, Calif., logistics company filed its petition in the U.S. Bankruptcy Court for the Southern District of California listing assets up to $50,000 and and $1 million to $10 million in liabilities. Court papers said it owed millions of dollars in liabilities to trucking, logistics and factoring companies. The company filed bankruptcy before any creditors could take legal action.
Lawsuits force companies to liquidate in bankruptcy
Lawsuits, however, can force companies to file bankruptcy, which was the case for J.J. & Sons Logistics of Clint, Texas, which on Jan. 22 filed for Chapter 7 liquidation in the U.S. Bankruptcy Court for the Western District of Texas. The company filed bankruptcy four days before the scheduled start of a trial for a wrongful death lawsuit filed by the family of a former company truck driver who had died from drowning in 2016.
California-based logistics company Wise Choice Trans Corp. shut down operations and filed for Chapter 7 liquidation on Jan. 4 in the U.S. Bankruptcy Court for the Northern District of California, listing $1 million to $10 million in assets and liabilities.
The Hayward, Calif., third-party logistics company, founded in 2009, provided final mile, less-than-truckload and full truckload services, as well as warehouse and fulfillment services in the San Francisco Bay Area.
The Chapter 7 filing also implemented an automatic stay against all legal proceedings, as the company listed its involvement in four legal actions that were ongoing or concluded. Court papers reportedly did not list amounts for damages.
In some cases, debtors don't have to take a drastic action, such as a liquidation, and can instead file a Chapter 11 reorganization.
Shutterstock
Nationwide Cargo seeks to reorganize its business
Nationwide Cargo Inc., a general freight trucking company that also hauls fresh produce and meat, filed for Chapter 11 bankruptcy protection in the U.S. Bankruptcy Court for the Northern District of Illinois with plans to reorganize its business.
The East Dundee, Ill., shipping company listed $1 million to $10 million in assets and $10 million to $50 million in liabilities in its petition and said funds will not be available to pay unsecured creditors. The company operates with 183 trucks and 171 drivers, FreightWaves reported.
Nationwide Cargo's three largest secured creditors in the petition were Equify Financial LLC (owed about $3.5 million,) Commercial Credit Group (owed about $1.8 million) and Continental Bank NA (owed about $676,000.)
The shipping company reported gross revenue of about $34 million in 2022 and about $40 million in 2023. From Jan. 1 until its petition date, the company generated $9.3 million in gross revenue.
Related: Veteran fund manager picks favorite stocks for 2024
bankruptcy pandemic covid-19 stocksUncategorized
Tight inventory and frustrated buyers challenge agents in Virginia
With inventory a little more than half of what it was pre-pandemic, agents are struggling to find homes for clients in Virginia.
Share this:

No matter where you are in the state, real estate agents in Virginia are facing low inventory conditions that are creating frustrating scenarios for their buyers.
“I think people are getting used to the interest rates where they are now, but there is just a huge lack of inventory,” said Chelsea Newcomb, a RE/MAX Realty Specialists agent based in Charlottesville. “I have buyers that are looking, but to find a house that you love enough to pay a high price for — and to be at over a 6.5% interest rate — it’s just a little bit harder to find something.”
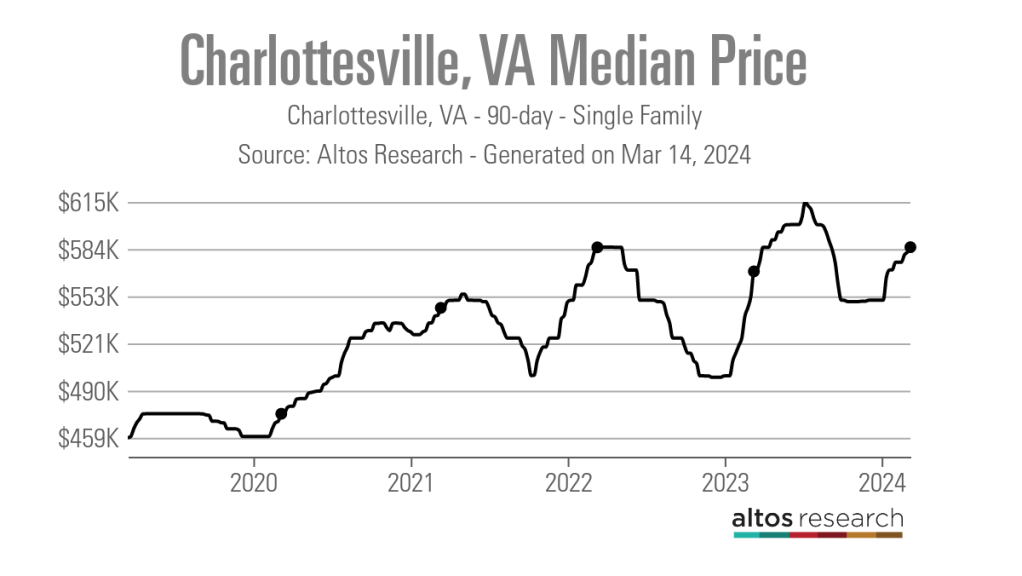
Newcomb said that interest rates and higher prices, which have risen by more than $100,000 since March 2020, according to data from Altos Research, have caused her clients to be pickier when selecting a home.
“When rates and prices were lower, people were more willing to compromise,” Newcomb said.
Out in Wise, Virginia, near the westernmost tip of the state, RE/MAX Cavaliers agent Brett Tiller and his clients are also struggling to find suitable properties.
“The thing that really stands out, especially compared to two years ago, is the lack of quality listings,” Tiller said. “The slightly more upscale single-family listings for move-up buyers with children looking for their forever home just aren’t coming on the market right now, and demand is still very high.”
Statewide, Virginia had a 90-day average of 8,068 active single-family listings as of March 8, 2024, down from 14,471 single-family listings in early March 2020 at the onset of the COVID-19 pandemic, according to Altos Research. That represents a decrease of 44%.

In Newcomb’s base metro area of Charlottesville, there were an average of only 277 active single-family listings during the same recent 90-day period, compared to 892 at the onset of the pandemic. In Wise County, there were only 56 listings.
Due to the demand from move-up buyers in Tiller’s area, the average days on market for homes with a median price of roughly $190,000 was just 17 days as of early March 2024.
“For the right home, which is rare to find right now, we are still seeing multiple offers,” Tiller said. “The demand is the same right now as it was during the heart of the pandemic.”
According to Tiller, the tight inventory has caused homebuyers to spend up to six months searching for their new property, roughly double the time it took prior to the pandemic.
For Matt Salway in the Virginia Beach metro area, the tight inventory conditions are creating a rather hot market.
“Depending on where you are in the area, your listing could have 15 offers in two days,” the agent for Iron Valley Real Estate Hampton Roads | Virginia Beach said. “It has been crazy competition for most of Virginia Beach, and Norfolk is pretty hot too, especially for anything under $400,000.”
According to Altos Research, the Virginia Beach-Norfolk-Newport News housing market had a seven-day average Market Action Index score of 52.44 as of March 14, making it the seventh hottest housing market in the country. Altos considers any Market Action Index score above 30 to be indicative of a seller’s market.

Further up the coastline on the vacation destination of Chincoteague Island, Long & Foster agent Meghan O. Clarkson is also seeing a decent amount of competition despite higher prices and interest rates.
“People are taking their time to actually come see things now instead of buying site unseen, and occasionally we see some seller concessions, but the traffic and the demand is still there; you might just work a little longer with people because we don’t have anything for sale,” Clarkson said.
“I’m busy and constantly have appointments, but the underlying frenzy from the height of the pandemic has gone away, but I think it is because we have just gotten used to it.”
While much of the demand that Clarkson’s market faces is for vacation homes and from retirees looking for a scenic spot to retire, a large portion of the demand in Salway’s market comes from military personnel and civilians working under government contracts.
“We have over a dozen military bases here, plus a bunch of shipyards, so the closer you get to all of those bases, the easier it is to sell a home and the faster the sale happens,” Salway said.
Due to this, Salway said that existing-home inventory typically does not come on the market unless an employment contract ends or the owner is reassigned to a different base, which is currently contributing to the tight inventory situation in his market.
Things are a bit different for Tiller and Newcomb, who are seeing a decent number of buyers from other, more expensive parts of the state.
“One of the crazy things about Louisa and Goochland, which are kind of like suburbs on the western side of Richmond, is that they are growing like crazy,” Newcomb said. “A lot of people are coming in from Northern Virginia because they can work remotely now.”
With a Market Action Index score of 50, it is easy to see why people are leaving the Washington-Arlington-Alexandria market for the Charlottesville market, which has an index score of 41.
In addition, the 90-day average median list price in Charlottesville is $585,000 compared to $729,900 in the D.C. area, which Newcomb said is also luring many Virginia homebuyers to move further south.

“They are very accustomed to higher prices, so they are super impressed with the prices we offer here in the central Virginia area,” Newcomb said.
For local buyers, Newcomb said this means they are frequently being outbid or outpriced.
“A couple who is local to the area and has been here their whole life, they are just now starting to get their mind wrapped around the fact that you can’t get a house for $200,000 anymore,” Newcomb said.
As the year heads closer to spring, triggering the start of the prime homebuying season, agents in Virginia feel optimistic about the market.
“We are seeing seasonal trends like we did up through 2019,” Clarkson said. “The market kind of soft launched around President’s Day and it is still building, but I expect it to pick right back up and be in full swing by Easter like it always used to.”
But while they are confident in demand, questions still remain about whether there will be enough inventory to support even more homebuyers entering the market.
“I have a lot of buyers starting to come off the sidelines, but in my office, I also have a lot of people who are going to list their house in the next two to three weeks now that the weather is starting to break,” Newcomb said. “I think we are going to have a good spring and summer.”
real estate housing market pandemic covid-19 interest rates

Q4 Update: Delinquencies, Foreclosures and REO


Pharma industry reputation remains steady at a ‘new normal’ after Covid, Harris Poll finds


These Cities Have The Highest (And Lowest) Share Of Unaffordable Neighborhoods In 2024


Part 1: Current State of the Housing Market; Overview for mid-March 2024


The Question You Should Ask Whenever You’re Wrong


Tight inventory and frustrated buyers challenge agents in Virginia


Walmart and Target make key self-checkout changes to fight theft


Key shipping company files Chapter 11 bankruptcy


The best real estate coaching programs for 2024


Your financial plan may be riskier without bitcoin
-

 Uncategorized3 weeks ago
All Of The Elements Are In Place For An Economic Crisis Of Staggering Proportions
-

 International7 days ago
EyePoint poaches medical chief from Apellis; Sandoz CFO, longtime BioNTech exec to retire
-

 Uncategorized4 weeks ago
California Counties Could Be Forced To Pay $300 Million To Cover COVID-Era Program
-

 Uncategorized3 weeks ago
Apparel Retailer Express Moving Toward Bankruptcy
-

 Uncategorized4 weeks ago
Industrial Production Decreased 0.1% in January
-

 International6 days ago
Walmart launches clever answer to Target’s new membership program
-

 Uncategorized4 weeks ago
RFK Jr: The Wuhan Cover-Up & The Rise Of The Biowarfare-Industrial Complex
-

 Uncategorized3 weeks ago
GOP Efforts To Shore Up Election Security In Swing States Face Challenges