Uncategorized
E-invoicing market to grow by 21.43% Y-O-Y from 2022 to 2023: Customer-centered solutions will drive growth -Technavio
E-invoicing market to grow by 21.43% Y-O-Y from 2022 to 2023: Customer-centered solutions will drive growth -Technavio
PR Newswire
NEW YORK, Dec. 20, 2022
NEW YORK, Dec. 20, 2022 /PRNewswire/ — E-invoicing market insights –
…
Share this:

E-invoicing market to grow by 21.43% Y-O-Y from 2022 to 2023: Customer-centered solutions will drive growth -Technavio
PR Newswire
NEW YORK, Dec. 20, 2022
NEW YORK, Dec. 20, 2022 /PRNewswire/ -- E-invoicing market insights -
- Vendors: 15+, Including Basware Corp., Cegedim SA., Comarch SA., Coupa Software Inc., Esker SA., International Business Machines Corp., iPayables Inc., Kofax Inc., Nipendo Ltd., PaySimple Inc., Sage Group Plc, SAP SE, Taulia Inc., Tipalti Inc., TradeShift Inc., Transcepta LLC., Visma Solutions Oy, Webtel Electrosoft. Pvt. Ltd., Xero Ltd., Zoho Corp. Pvt. Ltd., among others
- Coverage: Parent market analysis; key drivers, major trends, and challenges; customer and vendor landscape; vendor product insights and recent developments; key vendors; and market positioning of vendors
- Segments: End-user (B2B and B2C), Deployment (Cloud-based and On-premises), and Geography (Europe, APAC, North America, South America, and Middle East and Africa)
To understand more about the e-invoicing market, request a sample report
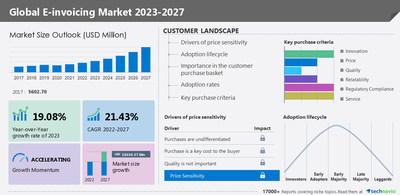
In 2017, the e-invoicing market was valued at USD 5,602.70 million. From a regional perspective, Europe held the largest market share, valued at USD 2,715.63 million. The e-invoicing market size is estimated to grow by USD 15,330.37 million from 2022 to 2027 at a CAGR of 21.43% according to Technavio.
E-invoicing market - Customer landscape
To help companies evaluate and develop growth strategies, the report outlines –
- Key purchase criteria
- Adoption rates
- Adoption lifecycle
- Drivers of price sensitivity
- For highlights on customer landscape analysis, download a sample!
Global E-invoicing market - Vendor insights
The growing competition in the market is compelling vendors to adopt various growth strategies such as promotional activities and spending on advertisements to improve the visibility of their services. Technavio report analyzes the market's competitive landscape and offers information on several market vendors including -
- TradeShift Inc. - The company offers E-invoicing such as a B2B marketplace for E-procurement and AP automation & E-invoicing solution.
- Taulia Inc - The company offers E-invoicing such as supply chain finance, cash forecasting, and invoice automation.
- SAP SE - The company offers E-invoicing such as ERP and finance, database and data management, Analytics, CRM, and customer experience.
Global E-invoicing Market – Market Dynamics
Major drivers
Convenience and easy accessibility of mobile payment systems
Need to adhere to regulatory guidelines and ensure compliance
Shift from capital expenditure model to operational expenditure model
Key challenges
Threat of cyber-attacks and data privacy
Dependence on the internet and software
Inaccuracies in invoicing
Drivers and challenges have an impact on market dynamics, which can impact businesses. Find some insights from a sample report!
The e-invoicing market report provides critical information and factual data, with a qualitative and quantitative study of the market based on market drivers and limitations as well as future prospects.
Why Buy?
- Add credibility to strategy
- Analyzes competitor's offerings
- Get a holistic view of the market
Grow your profit margin with Technavio- Buy the Report
What are the key data covered in this E-invoicing market report?
- CAGR of the market during the forecast period
- Detailed information on factors that will drive the growth of the e-invoicing market between 2023 and 2027
- Precise estimation of the e-invoicing market size and its contribution to the market in focus on the parent market
- Accurate predictions about upcoming trends and changes in consumer behavior
- Growth of the e-invoicing industry across Europe, APAC, North America, South America, and Middle East and Africa
- A thorough analysis of the market's competitive landscape and detailed information about vendors
- Comprehensive analysis of factors that will challenge the growth of e-invoicing market vendors
Gain instant access to 17,000+ market research reports.
Technavio's SUBSCRIPTION platform
Related Reports:
Simulation and Analysis Software Market by Deployment, End-user, and Geography - Forecast and Analysis 2022-2026: The simulation and analysis software market share is expected to increase by USD 7.98 billion from 2021 to 2026, and the market's growth momentum will accelerate at a CAGR of 13.36%. Furthermore, this report extensively covers simulation and analysis software market segmentation by deployment (on-premise and cloud), end-user (automotive, aerospace and defense, industrial manufacturing, and others), and geography (North America, Europe, APAC, South America, and the Middle East and Africa).
Software Testing Services Market by Product, End-user, and Geography - Forecast and Analysis 2021-2025: The Software Testing Services Market is poised to grow by USD 55.76 billion during 2022-2026, accelerating at a CAGR of 15.07% during the forecast period. Furthermore, the market research report extensively covers market segmentation by product (application testing and product testing), end-user (BFSI, telecom and media, manufacturing, retail, and others), and geography (North America, Europe, APAC, and South America).
E-invoicing Market Scope | |
Report Coverage | Details |
Page number | 160 |
Base year | 2022 |
Historic period | 2017-2021 |
Forecast period | 2023-2027 |
Growth momentum & CAGR | Accelerate at a CAGR of 21.43% |
Market growth 2023-2027 | USD 15,330.37 million |
Market structure | Fragmented |
YoY growth 2022-2023 (%) | 19.08 |
Regional analysis | Europe, APAC, North America, South America, and Middle East and Africa |
Performing market contribution | APAC at 35% |
Key countries | US, China, UK, Germany, and Denmark |
Competitive landscape | Leading Vendors, Market Positioning of Vendors, Competitive Strategies, and Industry Risks |
Key companies profiled | Basware Corp., Cegedim SA., Comarch SA., Coupa Software Inc., Esker SA., International Business Machines Corp., iPayables Inc., Kofax Inc., Nipendo Ltd., PaySimple Inc., Sage Group Plc, SAP SE, Taulia Inc., Tipalti Inc., TradeShift Inc., Transcepta LLC., Visma Solutions Oy, Webtel Electrosoft. Pvt. Ltd., Xero Ltd, and Zoho Corp. Pvt. Ltd. |
Market dynamics | Parent market analysis, Market growth inducers and obstacles, Fast-growing and slow-growing segment analysis, COVID-19 impact and recovery analysis and future consumer dynamics, and Market condition analysis for the forecast period. |
Customization purview | If our report has not included the data that you are looking for, you can reach out to our analysts and get segments customized. |
Customization purview | If our report has not included the data that you are looking for, you can reach out to our analysts and get segments customized. |
Browse for Technavio's information technology market reports
Table of Contents:
1 Executive Summary
- 1.1 Market Overview
- Exhibit 01: Executive Summary – Chart on Market Overview
- Exhibit 02: Executive Summary – Data Table on Market Overview
- Exhibit 03: Executive Summary – Chart on Global Market Characteristics
- Exhibit 04: Executive Summary – Chart on Market by Geography
- Exhibit 05: Executive Summary – Chart on Market Segmentation by End-user
- Exhibit 06: Executive Summary – Chart on Market Segmentation by Deployment
- Exhibit 07: Executive Summary – Chart on Incremental Growth
- Exhibit 08: Executive Summary – Data Table on Incremental Growth
- Exhibit 09: Executive Summary – Chart on Vendor Market Positioning
2 Market Landscape
- 2.1 Market ecosystem
- Exhibit 10: Parent market
- Exhibit 11: Market Characteristics
3 Market Sizing
- 3.1 Market Definition
- Exhibit 12: Offerings of vendors included in the market definition
- 3.2 Market segment analysis
- Exhibit 13: Market segments
- 3.3 Market size 2022
- 3.4 Market outlook: Forecast for 2022-2027
- Exhibit 14: Chart on Global - Market size and forecast 2022-2027 ($ million)
- Exhibit 15: Data Table on Global - Market size and forecast 2022-2027 ($ million)
- Exhibit 16: Chart on Global Market: Year-over-year growth 2022-2027 (%)
- Exhibit 17: Data Table on Global Market: Year-over-year growth 2022-2027 (%)
4 Historic Market Size
- 4.1 Global e-invoicing market 2017 - 2021
- Exhibit 18: Historic Market Size – Data Table on Global e-invoicing market 2017 - 2021 ($ million)
- 4.2 Geography Segment Analysis 2017 - 2021
- Exhibit 19: Historic Market Size – Geography Segment 2017 - 2021 ($ million)
- 4.3 End-user Segment Analysis 2017 - 2021
- Exhibit 20: Historic Market Size – End-user Segment 2017 - 2021 ($ million)
- 4.4 Deployment type Segment Analysis 2017 - 2021
- Exhibit 21: Historic Market Size – Deployment type Segment 2017 - 2021 ($ million)
- 4.5 Country Segment Analysis 2017 - 2021
- Exhibit 22: Historic Market Size – Country Segment 2017 - 2021 ($ million)
5 Five Forces Analysis
- 5.1 Five forces summary
- Exhibit 23: Five forces analysis - Comparison between 2022 and 2027
- 5.2 Bargaining power of buyers
- Exhibit 24: Chart on Bargaining power of buyers – Impact of key factors 2022 and 2027
- 5.3 Bargaining power of suppliers
- Exhibit 25: Bargaining power of suppliers – Impact of key factors in 2022 and 2027
- 5.4 Threat of new entrants
- Exhibit 26: Threat of new entrants – Impact of key factors in 2022 and 2027
- 5.5 Threat of substitutes
- Exhibit 27: Threat of substitutes – Impact of key factors in 2022 and 2027
- 5.6 Threat of rivalry
- Exhibit 28: Threat of rivalry – Impact of key factors in 2022 and 2027
- 5.7 Market condition
- Exhibit 29: Chart on Market condition - Five forces 2022 and 2027
6 Market Segmentation by End-user
- 6.1 Market segments
- Exhibit 30: Chart on End-user - Market share 2022-2027 (%)
- Exhibit 31: Data Table on End-user - Market share 2022-2027 (%)
- 6.2 Comparison by End-user
- Exhibit 32: Chart on Comparison by End-user
- Exhibit 33: Data Table on Comparison by End-user
- 6.3 B2B - Market size and forecast 2022-2027
- Exhibit 34: Chart on B2B - Market size and forecast 2022-2027 ($ million)
- Exhibit 35: Data Table on B2B - Market size and forecast 2022-2027 ($ million)
- Exhibit 36: Chart on B2B - Year-over-year growth 2022-2027 (%)
- Exhibit 37: Data Table on B2B - Year-over-year growth 2022-2027 (%)
- 6.4 B2C - Market size and forecast 2022-2027
- Exhibit 38: Chart on B2C - Market size and forecast 2022-2027 ($ million)
- Exhibit 39: Data Table on B2C - Market size and forecast 2022-2027 ($ million)
- Exhibit 40: Chart on B2C - Year-over-year growth 2022-2027 (%)
- Exhibit 41: Data Table on B2C - Year-over-year growth 2022-2027 (%)
- 6.5 Market opportunity by End-user
- Exhibit 42: Market opportunity by End-user ($ million)
7 Market Segmentation by Deployment
- 7.1 Market segments
- Exhibit 43: Chart on Deployment - Market share 2022-2027 (%)
- Exhibit 44: Data Table on Deployment - Market share 2022-2027 (%)
- 7.2 Comparison by Deployment
- Exhibit 45: Chart on Comparison by Deployment
- Exhibit 46: Data Table on Comparison by Deployment
- 7.3 Cloud-based - Market size and forecast 2022-2027
- Exhibit 47: Chart on Cloud-based - Market size and forecast 2022-2027 ($ million)
- Exhibit 48: Data Table on Cloud-based - Market size and forecast 2022-2027 ($ million)
- Exhibit 49: Chart on Cloud-based - Year-over-year growth 2022-2027 (%)
- Exhibit 50: Data Table on Cloud-based - Year-over-year growth 2022-2027 (%)
- 7.4 On-premises - Market size and forecast 2022-2027
- Exhibit 51: Chart on On-premises - Market size and forecast 2022-2027 ($ million)
- Exhibit 52: Data Table on On-premises - Market size and forecast 2022-2027 ($ million)
- Exhibit 53: Chart on On-premises - Year-over-year growth 2022-2027 (%)
- Exhibit 54: Data Table on On-premises - Year-over-year growth 2022-2027 (%)
- 7.5 Market opportunity by Deployment
- Exhibit 55: Market opportunity by Deployment ($ million)
8 Customer Landscape
- 8.1 Customer landscape overview
- Exhibit 56: Analysis of price sensitivity, lifecycle, customer purchase basket, adoption rates, and purchase criteria
9 Geographic Landscape
- 9.1 Geographic segmentation
- Exhibit 57: Chart on Market share by geography 2022-2027 (%)
- Exhibit 58: Data Table on Market share by geography 2022-2027 (%)
- 9.2 Geographic comparison
- Exhibit 59: Chart on Geographic comparison
- Exhibit 60: Data Table on Geographic comparison
- 9.3 Europe - Market size and forecast 2022-2027
- Exhibit 61: Chart on Europe - Market size and forecast 2022-2027 ($ million)
- Exhibit 62: Data Table on Europe - Market size and forecast 2022-2027 ($ million)
- Exhibit 63: Chart on Europe - Year-over-year growth 2022-2027 (%)
- Exhibit 64: Data Table on Europe - Year-over-year growth 2022-2027 (%)
- 9.4 APAC - Market size and forecast 2022-2027
- Exhibit 65: Chart on APAC - Market size and forecast 2022-2027 ($ million)
- Exhibit 66: Data Table on APAC - Market size and forecast 2022-2027 ($ million)
- Exhibit 67: Chart on APAC - Year-over-year growth 2022-2027 (%)
- Exhibit 68: Data Table on APAC - Year-over-year growth 2022-2027 (%)
- 9.5 North America - Market size and forecast 2022-2027
- Exhibit 69: Chart on North America - Market size and forecast 2022-2027 ($ million)
- Exhibit 70: Data Table on North America - Market size and forecast 2022-2027 ($ million)
- Exhibit 71: Chart on North America - Year-over-year growth 2022-2027 (%)
- Exhibit 72: Data Table on North America - Year-over-year growth 2022-2027 (%)
- 9.6 South America - Market size and forecast 2022-2027
- Exhibit 73: Chart on South America - Market size and forecast 2022-2027 ($ million)
- Exhibit 74: Data Table on South America - Market size and forecast 2022-2027 ($ million)
- Exhibit 75: Chart on South America - Year-over-year growth 2022-2027 (%)
- Exhibit 76: Data Table on South America - Year-over-year growth 2022-2027 (%)
- 9.7 Middle East and Africa - Market size and forecast 2022-2027
- Exhibit 77: Chart on Middle East and Africa - Market size and forecast 2022-2027 ($ million)
- Exhibit 78: Data Table on Middle East and Africa - Market size and forecast 2022-2027 ($ million)
- Exhibit 79: Chart on Middle East and Africa - Year-over-year growth 2022-2027 (%)
- Exhibit 80: Data Table on Middle East and Africa - Year-over-year growth 2022-2027 (%)
- 9.8 US - Market size and forecast 2022-2027
- Exhibit 81: Chart on US - Market size and forecast 2022-2027 ($ million)
- Exhibit 82: Data Table on US - Market size and forecast 2022-2027 ($ million)
- Exhibit 83: Chart on US - Year-over-year growth 2022-2027 (%)
- Exhibit 84: Data Table on US - Year-over-year growth 2022-2027 (%)
- 9.9 UK - Market size and forecast 2022-2027
- Exhibit 85: Chart on UK - Market size and forecast 2022-2027 ($ million)
- Exhibit 86: Data Table on UK - Market size and forecast 2022-2027 ($ million)
- Exhibit 87: Chart on UK - Year-over-year growth 2022-2027 (%)
- Exhibit 88: Data Table on UK - Year-over-year growth 2022-2027 (%)
- 9.10 China - Market size and forecast 2022-2027
- Exhibit 89: Chart on China - Market size and forecast 2022-2027 ($ million)
- Exhibit 90: Data Table on China - Market size and forecast 2022-2027 ($ million)
- Exhibit 91: Chart on China - Year-over-year growth 2022-2027 (%)
- Exhibit 92: Data Table on China - Year-over-year growth 2022-2027 (%)
- 9.11 Germany - Market size and forecast 2022-2027
- Exhibit 93: Chart on Germany - Market size and forecast 2022-2027 ($ million)
- Exhibit 94: Data Table on Germany - Market size and forecast 2022-2027 ($ million)
- Exhibit 95: Chart on Germany - Year-over-year growth 2022-2027 (%)
- Exhibit 96: Data Table on Germany - Year-over-year growth 2022-2027 (%)
- 9.12 Denmark - Market size and forecast 2022-2027
- Exhibit 97: Chart on Denmark - Market size and forecast 2022-2027 ($ million)
- Exhibit 98: Data Table on Denmark - Market size and forecast 2022-2027 ($ million)
- Exhibit 99: Chart on Denmark - Year-over-year growth 2022-2027 (%)
- Exhibit 100: Data Table on Denmark - Year-over-year growth 2022-2027 (%)
- 9.13 Market opportunity by geography
- Exhibit 101: Market opportunity by geography ($ million)
10 Drivers, Challenges, and Trends
- 10.1 Market drivers
- 10.2 Market challenges
- 10.3 Impact of drivers and challenges
- Exhibit 102: Impact of drivers and challenges in 2022 and 2027
- 10.4 Market trends
11 Vendor Landscape
- 11.1 Overview
- 11.2 Vendor landscape
- Exhibit 103: Overview on Criticality of inputs and Factors of differentiation
- 11.3 Landscape disruption
- Exhibit 104: Overview on factors of disruption
- 11.4 Industry risks
- Exhibit 105: Impact of key risks on business
12 Vendor Analysis
- 12.1 Vendors covered
- Exhibit 106: Vendors covered
- 12.2 Market positioning of vendors
- Exhibit 107: Matrix on vendor position and classification
- 12.3 Basware Corp.
- Exhibit 108: Basware Corp. - Overview
- Exhibit 109: Basware Corp. - Product / Service
- Exhibit 110: Basware Corp. - Key news
- Exhibit 111: Basware Corp. - Key offerings
- 12.4 Cegedim SA.
- Exhibit 112: Cegedim SA. - Overview
- Exhibit 113: Cegedim SA. - Business segments
- Exhibit 114: Cegedim SA. - Key offerings
- Exhibit 115: Cegedim SA. - Segment focus
- 12.5 Comarch SA.
- Exhibit 116: Comarch SA. - Overview
- Exhibit 117: Comarch SA. - Product / Service
- Exhibit 118: Comarch SA. - Key offerings
- 12.6 Coupa Software Inc.
- Exhibit 119: Coupa Software Inc. - Overview
- Exhibit 120: Coupa Software Inc. - Product / Service
- Exhibit 121: Coupa Software Inc. - Key offerings
- 12.7 Esker SA.
- Exhibit 122: Esker SA. - Overview
- Exhibit 123: Esker SA. - Product / Service
- Exhibit 124: Esker SA. - Key offerings
- 12.8 International Business Machines Corp.
- Exhibit 125: International Business Machines Corp. - Overview
- Exhibit 126: International Business Machines Corp. - Business segments
- Exhibit 127: International Business Machines Corp. - Key news
- Exhibit 128: International Business Machines Corp. - Key offerings
- Exhibit 129: International Business Machines Corp. - Segment focus
- 12.9 iPayables Inc.
- Exhibit 130: iPayables Inc. - Overview
- Exhibit 131: iPayables Inc. - Product / Service
- Exhibit 132: iPayables Inc. - Key offerings
- 12.10 Kofax Inc.
- Exhibit 133: Kofax Inc. - Overview
- Exhibit 134: Kofax Inc. - Product / Service
- Exhibit 135: Kofax Inc. - Key offerings
- 12.11 Nipendo Ltd.
- Exhibit 136: Nipendo Ltd. - Overview
- Exhibit 137: Nipendo Ltd. - Product / Service
- Exhibit 138: Nipendo Ltd. - Key offerings
- 12.12 PaySimple Inc.
- Exhibit 139: PaySimple Inc. - Overview
- Exhibit 140: PaySimple Inc. - Product / Service
- Exhibit 141: PaySimple Inc. - Key offerings
- 12.13 Sage Group Plc
- Exhibit 142: Sage Group Plc - Overview
- Exhibit 143: Sage Group Plc - Business segments
- Exhibit 144: Sage Group Plc - Key news
- Exhibit 145: Sage Group Plc - Key offerings
- Exhibit 146: Sage Group Plc - Segment focus
- 12.14 SAP SE
- Exhibit 147: SAP SE - Overview
- Exhibit 148: SAP SE - Business segments
- Exhibit 149: SAP SE - Key news
- Exhibit 150: SAP SE - Key offerings
- Exhibit 151: SAP SE - Segment focus
- 12.15 Taulia Inc.
- Exhibit 152: Taulia Inc. - Overview
- Exhibit 153: Taulia Inc. - Product / Service
- Exhibit 154: Taulia Inc. - Key offerings
- 12.16 TradeShift Inc.
- Exhibit 155: TradeShift Inc. - Overview
- Exhibit 156: TradeShift Inc. - Product / Service
- Exhibit 157: TradeShift Inc. - Key offerings
- 12.17 Transcepta LLC.
- Exhibit 158: Transcepta LLC. - Overview
- Exhibit 159: Transcepta LLC. - Product / Service
- Exhibit 160: Transcepta LLC. - Key offerings
13 Appendix
- 13.1 Scope of the report
- 13.2 Inclusions and exclusions checklist
- Exhibit 161: Inclusions checklist
- Exhibit 162: Exclusions checklist
- 13.3 Currency conversion rates for US$
- Exhibit 163: Currency conversion rates for US$
- 13.4 Research methodology
- Exhibit 164: Research methodology
- Exhibit 165: Validation techniques employed for market sizing
- Exhibit 166: Information sources
- 13.5 List of abbreviations
- Exhibit 167: List of abbreviations
Technavio is a leading global technology research and advisory company. Their research and analysis focus on emerging market trends and provide actionable insights to help businesses identify market opportunities and develop effective strategies to optimize their market positions. With over 500 specialized analysts, Technavio's report library consists of more than 17,000 reports and counting, covering 800 technologies, spanning 50 countries. Their client base consists of enterprises of all sizes, including more than 100 Fortune 500 companies. This growing client base relies on Technavio's comprehensive coverage, extensive research, and actionable market insights to identify opportunities in existing and potential markets and assess their competitive positions within changing market scenarios.
Contact
Technavio Research
Jesse Maida
Media & Marketing Executive
US: +1 844 364 1100
UK: +44 203 893 3200
Email: media@technavio.com
Website: www.technavio.com/

View original content to download multimedia:https://www.prnewswire.com/news-releases/e-invoicing-market-to-grow-by-21-43-y-o-y-from-2022-to-2023-customer-centered-solutions-will-drive-growth--technavio-301706931.html
SOURCE Technavio
Uncategorized
Key shipping company files Chapter 11 bankruptcy
The Illinois-based general freight trucking company filed for Chapter 11 bankruptcy to reorganize.
Share this:


The U.S. trucking industry has had a difficult beginning of the year for 2024 with several logistics companies filing for bankruptcy to seek either a Chapter 7 liquidation or Chapter 11 reorganization.
The Covid-19 pandemic caused a lot of supply chain issues for logistics companies and also created a shortage of truck drivers as many left the business for other occupations. Shipping companies, in the meantime, have had extreme difficulty recruiting new drivers for thousands of unfilled jobs.
Related: Tesla rival’s filing reveals Chapter 11 bankruptcy is possible
Freight forwarder company Boateng Logistics joined a growing list of shipping companies that permanently shuttered their businesses as the firm on Feb. 22 filed for Chapter 7 bankruptcy with plans to liquidate.
The Carlsbad, Calif., logistics company filed its petition in the U.S. Bankruptcy Court for the Southern District of California listing assets up to $50,000 and and $1 million to $10 million in liabilities. Court papers said it owed millions of dollars in liabilities to trucking, logistics and factoring companies. The company filed bankruptcy before any creditors could take legal action.
Lawsuits force companies to liquidate in bankruptcy
Lawsuits, however, can force companies to file bankruptcy, which was the case for J.J. & Sons Logistics of Clint, Texas, which on Jan. 22 filed for Chapter 7 liquidation in the U.S. Bankruptcy Court for the Western District of Texas. The company filed bankruptcy four days before the scheduled start of a trial for a wrongful death lawsuit filed by the family of a former company truck driver who had died from drowning in 2016.
California-based logistics company Wise Choice Trans Corp. shut down operations and filed for Chapter 7 liquidation on Jan. 4 in the U.S. Bankruptcy Court for the Northern District of California, listing $1 million to $10 million in assets and liabilities.
The Hayward, Calif., third-party logistics company, founded in 2009, provided final mile, less-than-truckload and full truckload services, as well as warehouse and fulfillment services in the San Francisco Bay Area.
The Chapter 7 filing also implemented an automatic stay against all legal proceedings, as the company listed its involvement in four legal actions that were ongoing or concluded. Court papers reportedly did not list amounts for damages.
In some cases, debtors don't have to take a drastic action, such as a liquidation, and can instead file a Chapter 11 reorganization.
Shutterstock
Nationwide Cargo seeks to reorganize its business
Nationwide Cargo Inc., a general freight trucking company that also hauls fresh produce and meat, filed for Chapter 11 bankruptcy protection in the U.S. Bankruptcy Court for the Northern District of Illinois with plans to reorganize its business.
The East Dundee, Ill., shipping company listed $1 million to $10 million in assets and $10 million to $50 million in liabilities in its petition and said funds will not be available to pay unsecured creditors. The company operates with 183 trucks and 171 drivers, FreightWaves reported.
Nationwide Cargo's three largest secured creditors in the petition were Equify Financial LLC (owed about $3.5 million,) Commercial Credit Group (owed about $1.8 million) and Continental Bank NA (owed about $676,000.)
The shipping company reported gross revenue of about $34 million in 2022 and about $40 million in 2023. From Jan. 1 until its petition date, the company generated $9.3 million in gross revenue.
Related: Veteran fund manager picks favorite stocks for 2024
bankruptcy pandemic covid-19 stocksUncategorized
Tight inventory and frustrated buyers challenge agents in Virginia
With inventory a little more than half of what it was pre-pandemic, agents are struggling to find homes for clients in Virginia.
Share this:

No matter where you are in the state, real estate agents in Virginia are facing low inventory conditions that are creating frustrating scenarios for their buyers.
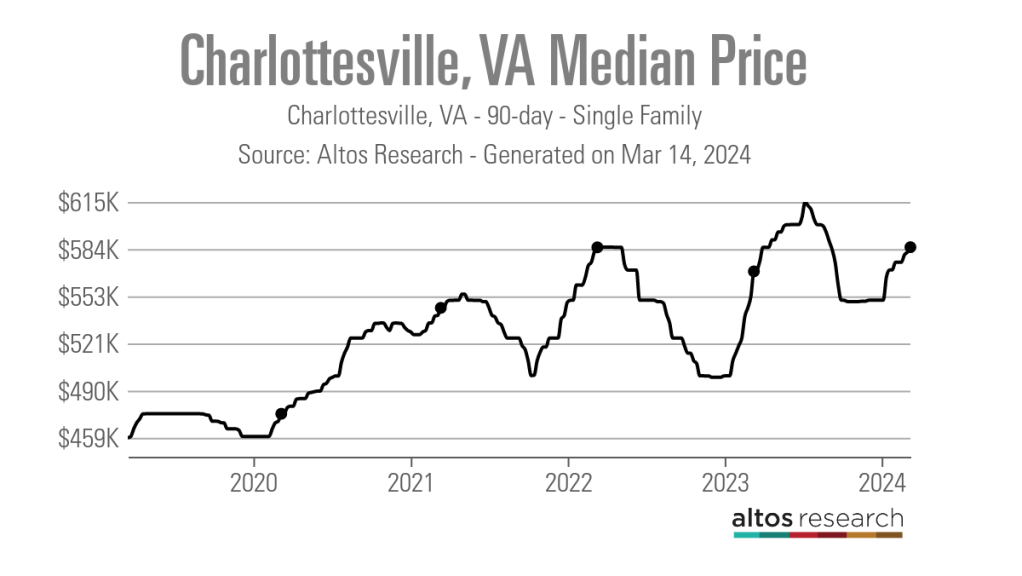
“I think people are getting used to the interest rates where they are now, but there is just a huge lack of inventory,” said Chelsea Newcomb, a RE/MAX Realty Specialists agent based in Charlottesville. “I have buyers that are looking, but to find a house that you love enough to pay a high price for — and to be at over a 6.5% interest rate — it’s just a little bit harder to find something.”
Newcomb said that interest rates and higher prices, which have risen by more than $100,000 since March 2020, according to data from Altos Research, have caused her clients to be pickier when selecting a home.
“When rates and prices were lower, people were more willing to compromise,” Newcomb said.
Out in Wise, Virginia, near the westernmost tip of the state, RE/MAX Cavaliers agent Brett Tiller and his clients are also struggling to find suitable properties.
“The thing that really stands out, especially compared to two years ago, is the lack of quality listings,” Tiller said. “The slightly more upscale single-family listings for move-up buyers with children looking for their forever home just aren’t coming on the market right now, and demand is still very high.”
Statewide, Virginia had a 90-day average of 8,068 active single-family listings as of March 8, 2024, down from 14,471 single-family listings in early March 2020 at the onset of the COVID-19 pandemic, according to Altos Research. That represents a decrease of 44%.

In Newcomb’s base metro area of Charlottesville, there were an average of only 277 active single-family listings during the same recent 90-day period, compared to 892 at the onset of the pandemic. In Wise County, there were only 56 listings.
Due to the demand from move-up buyers in Tiller’s area, the average days on market for homes with a median price of roughly $190,000 was just 17 days as of early March 2024.
“For the right home, which is rare to find right now, we are still seeing multiple offers,” Tiller said. “The demand is the same right now as it was during the heart of the pandemic.”
According to Tiller, the tight inventory has caused homebuyers to spend up to six months searching for their new property, roughly double the time it took prior to the pandemic.
For Matt Salway in the Virginia Beach metro area, the tight inventory conditions are creating a rather hot market.
“Depending on where you are in the area, your listing could have 15 offers in two days,” the agent for Iron Valley Real Estate Hampton Roads | Virginia Beach said. “It has been crazy competition for most of Virginia Beach, and Norfolk is pretty hot too, especially for anything under $400,000.”
According to Altos Research, the Virginia Beach-Norfolk-Newport News housing market had a seven-day average Market Action Index score of 52.44 as of March 14, making it the seventh hottest housing market in the country. Altos considers any Market Action Index score above 30 to be indicative of a seller’s market.

Further up the coastline on the vacation destination of Chincoteague Island, Long & Foster agent Meghan O. Clarkson is also seeing a decent amount of competition despite higher prices and interest rates.
“People are taking their time to actually come see things now instead of buying site unseen, and occasionally we see some seller concessions, but the traffic and the demand is still there; you might just work a little longer with people because we don’t have anything for sale,” Clarkson said.
“I’m busy and constantly have appointments, but the underlying frenzy from the height of the pandemic has gone away, but I think it is because we have just gotten used to it.”
While much of the demand that Clarkson’s market faces is for vacation homes and from retirees looking for a scenic spot to retire, a large portion of the demand in Salway’s market comes from military personnel and civilians working under government contracts.
“We have over a dozen military bases here, plus a bunch of shipyards, so the closer you get to all of those bases, the easier it is to sell a home and the faster the sale happens,” Salway said.
Due to this, Salway said that existing-home inventory typically does not come on the market unless an employment contract ends or the owner is reassigned to a different base, which is currently contributing to the tight inventory situation in his market.
Things are a bit different for Tiller and Newcomb, who are seeing a decent number of buyers from other, more expensive parts of the state.
“One of the crazy things about Louisa and Goochland, which are kind of like suburbs on the western side of Richmond, is that they are growing like crazy,” Newcomb said. “A lot of people are coming in from Northern Virginia because they can work remotely now.”
With a Market Action Index score of 50, it is easy to see why people are leaving the Washington-Arlington-Alexandria market for the Charlottesville market, which has an index score of 41.
In addition, the 90-day average median list price in Charlottesville is $585,000 compared to $729,900 in the D.C. area, which Newcomb said is also luring many Virginia homebuyers to move further south.

“They are very accustomed to higher prices, so they are super impressed with the prices we offer here in the central Virginia area,” Newcomb said.
For local buyers, Newcomb said this means they are frequently being outbid or outpriced.
“A couple who is local to the area and has been here their whole life, they are just now starting to get their mind wrapped around the fact that you can’t get a house for $200,000 anymore,” Newcomb said.
As the year heads closer to spring, triggering the start of the prime homebuying season, agents in Virginia feel optimistic about the market.
“We are seeing seasonal trends like we did up through 2019,” Clarkson said. “The market kind of soft launched around President’s Day and it is still building, but I expect it to pick right back up and be in full swing by Easter like it always used to.”
But while they are confident in demand, questions still remain about whether there will be enough inventory to support even more homebuyers entering the market.
“I have a lot of buyers starting to come off the sidelines, but in my office, I also have a lot of people who are going to list their house in the next two to three weeks now that the weather is starting to break,” Newcomb said. “I think we are going to have a good spring and summer.”
real estate housing market pandemic covid-19 interest ratesUncategorized
These Cities Have The Highest (And Lowest) Share Of Unaffordable Neighborhoods In 2024
These Cities Have The Highest (And Lowest) Share Of Unaffordable Neighborhoods In 2024
Authored by Sam Bourgi via CreditNews.com,
Homeownership…
Share this:


Authored by Sam Bourgi via CreditNews.com,
Homeownership is one of the key pillars of the American dream. But for many families, the idyllic fantasy of a picket fence and backyard barbecues remains just that—a fantasy.
Thanks to elevated mortgage rates, sky-high house prices, and scarce inventory, millions of American families have been locked out of the opportunity to buy a home in many cities.
To shed light on America’s housing affordability crisis, Creditnews Research ranked the 50 most populous cities by the percentage of neighborhoods within reach for the typical married-couple household to buy a home in.
The study reveals a stark reality, with many cities completely out of reach for the most affluent household type. Not only that, the unaffordability has radically worsened in recent years.
Comparing how affordability has changed since Covid, Creditnews Research discovered an alarming pattern—indicating consistently more unaffordable housing in all but three cities.
Fortunately, there’s still hope for households seeking to put down roots in more affordable cities—especially for those looking beyond Los Angeles, New York, Boston, San Jone, and Miami.
The typical American family has a hard time putting down roots in many parts of the country. In 11 of the top 50 cities, at least 50% of neighborhoods are out of reach for the average married-couple household. The affordability gap has widened significantly since Covid; in fact, no major city has reported an improvement in affordability post-pandemic.
Sam Bourgi, Senior Analyst at Creditnews
Key findings
-
The most unaffordable cities are Los Angeles, Boston, St. Louis, and San Jose; in each city, 100% of neighborhoods are out of reach for for married-couple households earning a median income;
-
The most affordable cities are Cleveland, Hartford, and Memphis—in these cities, the typical family can afford all neighborhoods;
-
None of the top 50 cities by population saw an improvement in affordable neighborhoods post-pandemic;
-
California recorded the biggest spike in unaffordable neighborhoods since pre-Covid;
-
The share of unaffordable neighborhoods has increased the most since pre-Covid in San Jose (70 percentage points), San Diego (from 57.8 percentage points), and Riverside-San Bernardino (51.9 percentage points);
-
Only three cities have seen no change in housing affordability since pre-Covid: Cleveland, Memphis, and Hartford. They’re also the only cities that had 0% of unaffordable neighborhoods before Covid.
Cities with the highest share of unaffordable neighborhoods
With few exceptions, the most unaffordable cities for married-couple households tend to be located in some of the nation’s most expensive housing markets.
Four cities in the ranking have an unaffordability percentage of 100%—indicating that the median married-couple household couldn’t qualify for an average home in any neighborhood.
The following are the cities ranked from the least affordable to the most:
-
Los Angeles, CA: Housing affordability in Los Angeles has deteriorated over the last five years, as average incomes have failed to keep pace with rising property values and elevated mortgage rates. The median household income of married-couple families in LA is $117,056, but even at that rate, 100% of the city’s neighborhoods are unaffordable.
-
St. Louis, MO: It may be surprising to see St. Louis ranking among the most unaffordable housing markets for married-couple households. But a closer look reveals that the Mound City was unaffordable even before Covid. In 2019, 98% of the city’s neighborhoods were unaffordable—way worse than Los Angeles, Boston, or San Jose.
-
Boston, MA: Boston’s housing affordability challenges began long before Covid but accelerated after the pandemic. Before Covid, married couples earning a median income were priced out of 90.7% of Boston’s neighborhoods. But that figure has since jumped to 100%, despite a comfortable median household income of $172,223.
-
San Jose, CA: Nestled in Silicon Valley, San Jose has long been one of the most expensive cities for housing in America. But things have gotten far worse since Covid, as 100% of its neighborhoods are now out of reach for the average family. Perhaps the most shocking part is that the median household income for married-couple families is $188,403—much higher than the national average.
-
San Diego, CA: Another California city, San Diego, is among the most unaffordable places in the country. Despite boasting a median married-couple household income of $136,297, 95.6% of the city’s neighborhoods are unaffordable.
-
San Francisco, CA: San Francisco is another California city with a high married-couple median income ($211,585) but low affordability. The percentage of unaffordable neighborhoods for these homebuyers stands at 89.2%.
-
New York, NY: As one of the most expensive cities in America, New York is a difficult housing market for married couples with dual income. New York City’s share of unaffordable neighborhoods is 85.9%, marking a 33.4% rise from pre-Covid times.
-
Miami, FL: Partly due to a population boom post-Covid, Miami is now one of the most unaffordable cities for homebuyers. Roughly four out of five (79.4%) of Miami’s neighborhoods are out of reach price-wise for married-couple families. That’s a 34.7% increase from 2019.
-
Nashville, TN: With Nashville’s population growth rebounding to pre-pandemic levels, the city has also seen greater affordability challenges. In the Music City, 73.7% of neighborhoods are considered unaffordable for married-couple households—an increase of 11.9% from pre-Covid levels.
-
Richmond, VA: Rounding out the bottom 10 is Richmond, where 55.9% of the city’s 161 neighborhoods are unaffordable for married-couple households. That’s an 11.9% increase from pre-Covid levels.
Cities with the lowest share of unaffordable neighborhoods
All the cities in our top-10 ranking have less than 10% unaffordable neighborhoods—meaning the average family can qualify for a home in at least 90% of the city.
Interestingly, these cities are also outside the top 15 cities by population, and eight are in the bottom half.
The following are the cities ranked from the most affordable to the least:
-
Hartford, CT: Hartford ranks first with the percentage of unaffordable neighborhoods at 0%, unchanged since pre-Covid times. Married couples earning a median income of $135,612 can afford to live in any of the city’s 16 neighborhoods. Interestingly, Hartford is the smallest city to rank in the top 10.
-
Memphis, TN: Like Hartford, Memphis has 0% unaffordable neighborhoods, meaning any married couple earning a median income of $101,734 can afford an average homes in any of the city’s 12 neighborhoods. The percentage of unaffordable neighborhoods also stood at 0% before Covid.
-
Cleveland, OH: The Midwestern city of Cleveland is also tied for first, with the percentage of unaffordable neighborhoods at 0%. That means households with a median-couple income of $89,066 can qualify for an average home in all of the city’s neighborhoods. Cleveland is also among the three cities that have seen no change in unaffordability compared to 2019.
-
Minneapolis, MN: The largest city in the top 10, Minneapolis’ share of unaffordable neighborhoods stood at 2.41%, up slightly from 2019. Married couples earning the median income ($149,214) have access to the vast majority of the city’s 83 neighborhoods.
-
Baltimore, MD: Married-couple households in Baltimore earn a median income of $141,634. At that rate, they can afford to live in 97.3% of the city’s 222 neighborhoods, making only 2.7% of neighborhoods unaffordable. That’s up from 0% pre-Covid.
-
Louisville, KY: Louisville is a highly competitive market for married households. For married-couple households earning a median wage, only 3.6% of neighborhoods are unaffordable, up 11.9% from pre-Covid times.
-
Cincinnati, OH: The second Ohio city in the top 10 ranks close to Cleveland in population but has a much higher median married-couple household income of $129,324. Only 3.6% of the city’s neighborhoods are unaffordable, up slightly from pre-pandemic levels.
-
Indianapolis, IN: Another competitive Midwestern market, only 4.4% of Indianapolis is unaffordable, making the vast majority of the city’s 92 neighborhoods accessible to the average married couple. Still, the percentage of unaffordable neighborhoods before Covid was less than 1%.
-
Oklahoma City, OK: Before Covid, Oklahoma City had 0% neighborhoods unaffordable for married-couple households earning the median wage. It has since increased to 4.69%, which is still tiny compared to the national average.
-
Kansas City, MO: Kansas City has one of the largest numbers of neighborhoods in the top 50 cities. Its married-couple residents can afford to live in nearly 95% of them, making only 5.6% of neighborhoods out of reach. Like Indiana, Kansas City’s share of unaffordable neighborhoods was less than 1% before Covid.
The biggest COVID losers
What's particularly astonishing about the current housing market is just how quickly affordability has declined since Covid.
Even factoring in the market correction after the 2022 peak, the price of existing homes is still nearly one-third higher than before Covid. Mortgage rates have also more than doubled since early 2022.
Combined, the rising home prices and interest rates led to the worst mortgage affordability in more than 40 years.
Against this backdrop, it’s hardly surprising that unaffordability increased in 47 of the 50 cities studied and remained flat in the other three. No city reported improved affordability in 2024 compared to 2019.
The biggest increases are led by San Jose (70 percentage points), San Diego (57.8 percentage points), Riverside-San Bernardino (51.9 percentage points), Sacramento (43 percentage points), Orlando (37.4 percentage points), Miami (34.7 percentage points), and New York City (33.4 percentage points).
The following cities in our study are ranked by the largest percentage point change in unaffordable neighborhoods since pre-Covid:


Q4 Update: Delinquencies, Foreclosures and REO


Pharma industry reputation remains steady at a ‘new normal’ after Covid, Harris Poll finds


These Cities Have The Highest (And Lowest) Share Of Unaffordable Neighborhoods In 2024


Tight inventory and frustrated buyers challenge agents in Virginia


Part 1: Current State of the Housing Market; Overview for mid-March 2024


The Question You Should Ask Whenever You’re Wrong


Walmart and Target make key self-checkout changes to fight theft


The best real estate coaching programs for 2024


Your financial plan may be riskier without bitcoin


Key shipping company files Chapter 11 bankruptcy
-

 Uncategorized3 weeks ago
All Of The Elements Are In Place For An Economic Crisis Of Staggering Proportions
-

 International7 days ago
EyePoint poaches medical chief from Apellis; Sandoz CFO, longtime BioNTech exec to retire
-

 Uncategorized4 weeks ago
California Counties Could Be Forced To Pay $300 Million To Cover COVID-Era Program
-

 Uncategorized3 weeks ago
Apparel Retailer Express Moving Toward Bankruptcy
-

 Uncategorized4 weeks ago
Industrial Production Decreased 0.1% in January
-

 International6 days ago
Walmart launches clever answer to Target’s new membership program
-

 Uncategorized4 weeks ago
RFK Jr: The Wuhan Cover-Up & The Rise Of The Biowarfare-Industrial Complex
-

 Uncategorized3 weeks ago
GOP Efforts To Shore Up Election Security In Swing States Face Challenges