Don’t overreact to inflation data this spring
In the last few months, inflation has been a hotter topic than in recent memory. Google trends search intensity for the word “inflation” hit an all-time high (for the last 16 years since it was measured) and is roughly twice as high as it has…
Share this:

By Jay Shambaugh
In the last few months, inflation has been a hotter topic than in recent memory. Google trends search intensity for the word “inflation” hit an all-time high (for the last 16 years since it was measured) and is roughly twice as high as it has been in normal weeks in the last five years.
A number of economists have suggested that recent fiscal policy stimulus will lead to overheating and inflation, while others have argued just as vociferously it will not (see for example). This suggests that over the next few months, each inflation reading will draw increased scrutiny. There are a number of reasons to use caution when reading the data, though.
Bouncy data in the next few months
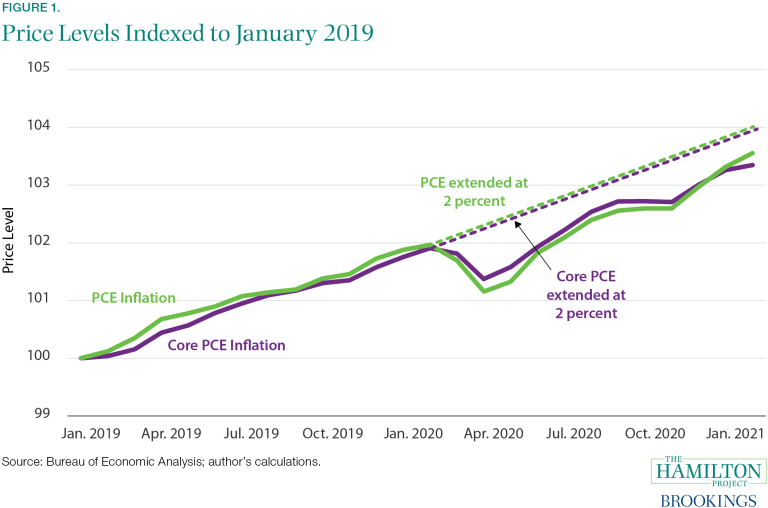
The COVID-19 pandemic cost hundreds of thousands of lives in the United States and unleashed a sharp recession. In addition to loss of employment and income, the shock caused the steepest three–month drop in the core personal consumption expenditures (PCE) price index since data exists in 1959 (the PCE is the preferred price index of the Federal Reserve and “core” means it excludes volatile food and energy prices). This dip is shown in the figure below which shows both headline (overall prices) and core prices over the last few years along with a line showing what the price level would have been had prices grown at 2 percent. This highlights that prices are still well below what a simple 2 percent trend would have generated.

The drop last year will soon be important once again because inflation is typically reported as the change in prices over a 12–month period. Monthly changes are often volatile, so focusing on a 12–month change can smooth those bounces. Since prices fell from February to March in 2020, the comparison or “base” month will fall when March 2021 data are reported. If we focus on the rebound in prices since then without appreciating that it was just partially returning prices to their prior level, it may seem like inflation is rising out of control. Even if prices remained perfectly flat over the next few months, it would look like inflation is rising as the 12–month–ago base comparison is actually going down.
The next figure shows what inflation will be if PCE prices grow at exactly 2 percent over the next year. As the figure shows, due to the huge dip a year ago, it will seem like inflation is rising rapidly, even though prices are simply moving up at a 2 percent annual rate month after month. Once the unusual low of last spring’s prices are no longer the base period, 12–month inflation dips back down.

Headline (or overall) PCE inflation will rise from 1.6 percent over the twelve months ending in February to 2.7 percent by April even if prices just move along at a simple 2 percent rate. This will look like accelerating inflation but would not be due to faster price growth this spring, but rather because the 12–month window no longer includes the price drops from February to April 2020 but does include the bounceback after the price drop. The impact on core PCE inflation will be less severe, but it will still pick up from 1.4 percent in February to 2.3 percent in April. If 12–month inflation rises in the next few months, it may be just because of the odd moves in prices a year ago.
One could look past the bumps in 2020 by focusing instead on the annual rate of inflation over shorter horizons, but these are often quite noisy. Another choice would be to compare prices to their level two years ago. Doing so would highlight both the need for the Federal Reserve to make up for low inflation last year and prevent odd base year effects. The next figure shows inflation over the last two years.

Looking at inflation over a two–year horizon will not show an odd bump due to base–year effects. The period included in the calculation includes both the dip and the bounceback, so they cancel out. If prices grow at 2 percent for the next year, we will see two-year inflation below 2 percent because inflation was low in 2020 (just 1.4 percent core inflation and 1.2 percent headline inflation in the twelve months of 2020).
What inflation rate does the Federal Reserve want?
It is also important to remember the actual inflation target. The Federal Reserve targets an average of 2 percent inflation over the medium term for prices as measured by the personal consumption expenditures (PCE) price index. The Fed will normally focus on the “core” PCE price index (one that omits food and energy) to avoid wide fluctuations caused by swings up or down in commodity prices. The PCE price index, though, has typically tracked below the widely reported consumer price index (CPI). Over the last decade, core PCE inflation has been an average of 0.3 percentage points lower than core CPI inflation.

Over the last decade, core CPI inflation has occasionally gone above 2 percent, but core PCE inflation has tended to be below the 2 percent target (meaning average inflation has been below target over time). If CPI inflation gets over 2 percent, core PCE inflation may still be well below it.
Second, as the figure shows, inflation has been well below 2 percent for the last two years, especially since the global pandemic struck. This means if the Fed wants to have “average inflation over time” at 2 percent, it will need to make up for the lower inflation recently. This is also visible in the first figure as the price level remains below a 2 percent projected trend. The Federal Reserve recently released a new framework for monetary policy that promises to make up for periods of low inflation. The Federal Reserve is likely looking for inflation (measured by PCE) in the range of 2.5 percent for the next year to make up for the last low year. That is, PCE inflation at 2.5 percent (or CPI inflation at 2.8 percent) would not be a sign the Fed has let inflation climb too high. It would be a sign the Fed is trying to hit its target of an average of 2 percent over time.
Conclusion
Inflation will be in the news frequently over the next few months. Some prices will rise (as gasoline prices have done in the last six months), and others may fall. The best way to gauge inflation is always looking at a broad basket. There are reasons to think inflation will rise, most notably recent fiscal and monetary policy stimulus. There are more reasons to think it will not likely get out of control over the next year, including a still very large gap in employment (over 10 million fewer jobs than prior trend leaving extensive slack in the economy now), a lack of inflation in recent decades anchoring expectations, and a low responsiveness of prices to periods of strong employment growth (limiting price pressure once employment has recovered more). Given the competing narratives, there will be a temptation to overinterpret each data release.
Remembering which basket is the Fed’s target (PCE), avoiding swings up or down from volatile prices (by looking at core inflation), and avoiding odd base month effects (by looking over a longer horizon) will all help cut through the noise of what will certainly be a loudly discussed topic.
recession pandemic covid-19 stimulus monetary policy fed federal reserve stimulusInternational
There will soon be one million seats on this popular Amtrak route
“More people are taking the train than ever before,” says Amtrak’s Executive Vice President.
Share this:

While the size of the United States makes it hard for it to compete with the inter-city train access available in places like Japan and many European countries, Amtrak trains are a very popular transportation option in certain pockets of the country — so much so that the country’s national railway company is expanding its Northeast Corridor by more than one million seats.
Related: This is what it's like to take a 19-hour train from New York to Chicago
Running from Boston all the way south to Washington, D.C., the route is one of the most popular as it passes through the most densely populated part of the country and serves as a commuter train for those who need to go between East Coast cities such as New York and Philadelphia for business.
Veronika Bondarenko
Amtrak launches new routes, promises travelers ‘additional travel options’
Earlier this month, Amtrak announced that it was adding four additional Northeastern routes to its schedule — two more routes between New York’s Penn Station and Union Station in Washington, D.C. on the weekend, a new early-morning weekday route between New York and Philadelphia’s William H. Gray III 30th Street Station and a weekend route between Philadelphia and Boston’s South Station.
More Travel:
- A new travel term is taking over the internet (and reaching airlines and hotels)
- The 10 best airline stocks to buy now
- Airlines see a new kind of traveler at the front of the plane
According to Amtrak, these additions will increase Northeast Corridor’s service by 20% on the weekdays and 10% on the weekends for a total of one million additional seats when counted by how many will ride the corridor over the year.
“More people are taking the train than ever before and we’re proud to offer our customers additional travel options when they ride with us on the Northeast Regional,” Amtrak Executive Vice President and Chief Commercial Officer Eliot Hamlisch said in a statement on the new routes. “The Northeast Regional gets you where you want to go comfortably, conveniently and sustainably as you breeze past traffic on I-95 for a more enjoyable travel experience.”
Here are some of the other Amtrak changes you can expect to see
Amtrak also said that, in the 2023 financial year, the Northeast Corridor had nearly 9.2 million riders — 8% more than it had pre-pandemic and a 29% increase from 2022. The higher demand, particularly during both off-peak hours and the time when many business travelers use to get to work, is pushing Amtrak to invest into this corridor in particular.
To reach more customers, Amtrak has also made several changes to both its routes and pricing system. In the fall of 2023, it introduced a type of new “Night Owl Fare” — if traveling during very late or very early hours, one can go between cities like New York and Philadelphia or Philadelphia and Washington. D.C. for $5 to $15.
As travel on the same routes during peak hours can reach as much as $300, this was a deliberate move to reach those who have the flexibility of time and might have otherwise preferred more affordable methods of transportation such as the bus. After seeing strong uptake, Amtrak added this type of fare to more Boston routes.
The largest distances, such as the ones between Boston and New York or New York and Washington, are available at the lowest rate for $20.
stocks pandemic japan europeanInternational
The next pandemic? It’s already here for Earth’s wildlife
Bird flu is decimating species already threatened by climate change and habitat loss.
Share this:


I am a conservation biologist who studies emerging infectious diseases. When people ask me what I think the next pandemic will be I often say that we are in the midst of one – it’s just afflicting a great many species more than ours.
I am referring to the highly pathogenic strain of avian influenza H5N1 (HPAI H5N1), otherwise known as bird flu, which has killed millions of birds and unknown numbers of mammals, particularly during the past three years.
This is the strain that emerged in domestic geese in China in 1997 and quickly jumped to humans in south-east Asia with a mortality rate of around 40-50%. My research group encountered the virus when it killed a mammal, an endangered Owston’s palm civet, in a captive breeding programme in Cuc Phuong National Park Vietnam in 2005.
How these animals caught bird flu was never confirmed. Their diet is mainly earthworms, so they had not been infected by eating diseased poultry like many captive tigers in the region.
This discovery prompted us to collate all confirmed reports of fatal infection with bird flu to assess just how broad a threat to wildlife this virus might pose.
This is how a newly discovered virus in Chinese poultry came to threaten so much of the world’s biodiversity.
The first signs
Until December 2005, most confirmed infections had been found in a few zoos and rescue centres in Thailand and Cambodia. Our analysis in 2006 showed that nearly half (48%) of all the different groups of birds (known to taxonomists as “orders”) contained a species in which a fatal infection of bird flu had been reported. These 13 orders comprised 84% of all bird species.
We reasoned 20 years ago that the strains of H5N1 circulating were probably highly pathogenic to all bird orders. We also showed that the list of confirmed infected species included those that were globally threatened and that important habitats, such as Vietnam’s Mekong delta, lay close to reported poultry outbreaks.
Mammals known to be susceptible to bird flu during the early 2000s included primates, rodents, pigs and rabbits. Large carnivores such as Bengal tigers and clouded leopards were reported to have been killed, as well as domestic cats.
Our 2006 paper showed the ease with which this virus crossed species barriers and suggested it might one day produce a pandemic-scale threat to global biodiversity.
Unfortunately, our warnings were correct.
A roving sickness
Two decades on, bird flu is killing species from the high Arctic to mainland Antarctica.
In the past couple of years, bird flu has spread rapidly across Europe and infiltrated North and South America, killing millions of poultry and a variety of bird and mammal species. A recent paper found that 26 countries have reported at least 48 mammal species that have died from the virus since 2020, when the latest increase in reported infections started.
Not even the ocean is safe. Since 2020, 13 species of aquatic mammal have succumbed, including American sea lions, porpoises and dolphins, often dying in their thousands in South America. A wide range of scavenging and predatory mammals that live on land are now also confirmed to be susceptible, including mountain lions, lynx, brown, black and polar bears.
The UK alone has lost over 75% of its great skuas and seen a 25% decline in northern gannets. Recent declines in sandwich terns (35%) and common terns (42%) were also largely driven by the virus.
Scientists haven’t managed to completely sequence the virus in all affected species. Research and continuous surveillance could tell us how adaptable it ultimately becomes, and whether it can jump to even more species. We know it can already infect humans – one or more genetic mutations may make it more infectious.
At the crossroads
Between January 1 2003 and December 21 2023, 882 cases of human infection with the H5N1 virus were reported from 23 countries, of which 461 (52%) were fatal.
Of these fatal cases, more than half were in Vietnam, China, Cambodia and Laos. Poultry-to-human infections were first recorded in Cambodia in December 2003. Intermittent cases were reported until 2014, followed by a gap until 2023, yielding 41 deaths from 64 cases. The subtype of H5N1 virus responsible has been detected in poultry in Cambodia since 2014. In the early 2000s, the H5N1 virus circulating had a high human mortality rate, so it is worrying that we are now starting to see people dying after contact with poultry again.
It’s not just H5 subtypes of bird flu that concern humans. The H10N1 virus was originally isolated from wild birds in South Korea, but has also been reported in samples from China and Mongolia.
Recent research found that these particular virus subtypes may be able to jump to humans after they were found to be pathogenic in laboratory mice and ferrets. The first person who was confirmed to be infected with H10N5 died in China on January 27 2024, but this patient was also suffering from seasonal flu (H3N2). They had been exposed to live poultry which also tested positive for H10N5.
Species already threatened with extinction are among those which have died due to bird flu in the past three years. The first deaths from the virus in mainland Antarctica have just been confirmed in skuas, highlighting a looming threat to penguin colonies whose eggs and chicks skuas prey on. Humboldt penguins have already been killed by the virus in Chile.

How can we stem this tsunami of H5N1 and other avian influenzas? Completely overhaul poultry production on a global scale. Make farms self-sufficient in rearing eggs and chicks instead of exporting them internationally. The trend towards megafarms containing over a million birds must be stopped in its tracks.
To prevent the worst outcomes for this virus, we must revisit its primary source: the incubator of intensive poultry farms.
Diana Bell does not work for, consult, own shares in or receive funding from any company or organisation that would benefit from this article, and has disclosed no relevant affiliations beyond their academic appointment.
genetic pandemic mortality spread deaths south korea south america europe uk chinaUncategorized
NY Fed Finds Medium, Long-Term Inflation Expectations Jump Amid Surge In Stock Market Optimism
NY Fed Finds Medium, Long-Term Inflation Expectations Jump Amid Surge In Stock Market Optimism
One month after the inflation outlook tracked…
Share this:


One month after the inflation outlook tracked by the NY Fed Consumer Survey extended their late 2023 slide, with 3Y inflation expectations in January sliding to a record low 2.4% (from 2.6% in December), even as 1 and 5Y inflation forecasts remained flat, moments ago the NY Fed reported that in February there was a sharp rebound in longer-term inflation expectations, rising to 2.7% from 2.4% at the three-year ahead horizon, and jumping to 2.9% from 2.5% at the five-year ahead horizon, while the 1Y inflation outlook was flat for the 3rd month in a row, stuck at 3.0%.
The increases in both the three-year ahead and five-year ahead measures were most pronounced for respondents with at most high school degrees (in other words, the "really smart folks" are expecting deflation soon). The survey’s measure of disagreement across respondents (the difference between the 75th and 25th percentile of inflation expectations) decreased at all horizons, while the median inflation uncertainty—or the uncertainty expressed regarding future inflation outcomes—declined at the one- and three-year ahead horizons and remained unchanged at the five-year ahead horizon.
Going down the survey, we find that the median year-ahead expected price changes increased by 0.1 percentage point to 4.3% for gas; decreased by 1.8 percentage points to 6.8% for the cost of medical care (its lowest reading since September 2020); decreased by 0.1 percentage point to 5.8% for the cost of a college education; and surprisingly decreased by 0.3 percentage point for rent to 6.1% (its lowest reading since December 2020), and remained flat for food at 4.9%.

We find the rent expectations surprising because it is happening just asking rents are rising across the country.

At the same time as consumers erroneously saw sharply lower rents, median home price growth expectations remained unchanged for the fifth consecutive month at 3.0%.
Turning to the labor market, the survey found that the average perceived likelihood of voluntary and involuntary job separations increased, while the perceived likelihood of finding a job (in the event of a job loss) declined. "The mean probability of leaving one’s job voluntarily in the next 12 months also increased, by 1.8 percentage points to 19.5%."

Mean unemployment expectations - or the mean probability that the U.S. unemployment rate will be higher one year from now - decreased by 1.1 percentage points to 36.1%, the lowest reading since February 2022. Additionally, the median one-year-ahead expected earnings growth was unchanged at 2.8%, remaining slightly below its 12-month trailing average of 2.9%.
Turning to household finance, we find the following:
- The median expected growth in household income remained unchanged at 3.1%. The series has been moving within a narrow range of 2.9% to 3.3% since January 2023, and remains above the February 2020 pre-pandemic level of 2.7%.
- Median household spending growth expectations increased by 0.2 percentage point to 5.2%. The increase was driven by respondents with a high school degree or less.
- Median year-ahead expected growth in government debt increased to 9.3% from 8.9%.
- The mean perceived probability that the average interest rate on saving accounts will be higher in 12 months increased by 0.6 percentage point to 26.1%, remaining below its 12-month trailing average of 30%.
- Perceptions about households’ current financial situations deteriorated somewhat with fewer respondents reporting being better off than a year ago. Year-ahead expectations also deteriorated marginally with a smaller share of respondents expecting to be better off and a slightly larger share of respondents expecting to be worse off a year from now.
- The mean perceived probability that U.S. stock prices will be higher 12 months from now increased by 1.4 percentage point to 38.9%.
- At the same time, perceptions and expectations about credit access turned less optimistic: "Perceptions of credit access compared to a year ago deteriorated with a larger share of respondents reporting tighter conditions and a smaller share reporting looser conditions compared to a year ago."

Also, a smaller percentage of consumers, 11.45% vs 12.14% in prior month, expect to not be able to make minimum debt payment over the next three months

Last, and perhaps most humorous, is the now traditional cognitive dissonance one observes with these polls, because at a time when long-term inflation expectations jumped, which clearly suggests that financial conditions will need to be tightened, the number of respondents expecting higher stock prices one year from today jumped to the highest since November 2021... which incidentally is just when the market topped out during the last cycle before suffering a painful bear market.


Veterans Affairs Kept COVID-19 Vaccine Mandate In Place Without Evidence


The Coming Of The Police State In America


‘I couldn’t stand the pain’: the Turkish holiday resort that’s become an emergency dental centre for Britons who can’t get treated at home


Beloved mall retailer files Chapter 7 bankruptcy, will liquidate


Is the National Guard a solution to school violence?


Rand Paul Teases Senate GOP Leader Run – Musk Says “I Would Support”


The next pandemic? It’s already here for Earth’s wildlife


Are Voters Recoiling Against Disorder?


The Great Replacement Loophole: Illegal Immigrants Score 5-Year Work Benefit While “Waiting” For Deporation, Asylum


Vaccine-skeptical mothers say bad health care experiences made them distrust the medical system
-

 Uncategorized3 weeks ago
All Of The Elements Are In Place For An Economic Crisis Of Staggering Proportions
-

 Uncategorized1 month ago
Cathie Wood sells a major tech stock (again)
-

 Uncategorized3 weeks ago
California Counties Could Be Forced To Pay $300 Million To Cover COVID-Era Program
-

 Uncategorized2 weeks ago
Apparel Retailer Express Moving Toward Bankruptcy
-

 Uncategorized4 weeks ago
Industrial Production Decreased 0.1% in January
-

 International3 days ago
EyePoint poaches medical chief from Apellis; Sandoz CFO, longtime BioNTech exec to retire
-

 International3 days ago
Walmart launches clever answer to Target’s new membership program
-

 Uncategorized3 weeks ago
RFK Jr: The Wuhan Cover-Up & The Rise Of The Biowarfare-Industrial Complex