Deloitte: Business Travel Steers Toward Slow, Yet Steady Ascent
Deloitte: Business Travel Steers Toward Slow, Yet Steady Ascent
PR Newswire
NEW YORK, April 18, 2022
Companies rethink when and why employees should travel, with a commitment to workplace flexibility, sustainability and ROI
NEW YORK, April 18, 202…
Share this:

Deloitte: Business Travel Steers Toward Slow, Yet Steady Ascent
PR Newswire
NEW YORK, April 18, 2022
Companies rethink when and why employees should travel, with a commitment to workplace flexibility, sustainability and ROI
NEW YORK, April 18, 2022 /PRNewswire/ --
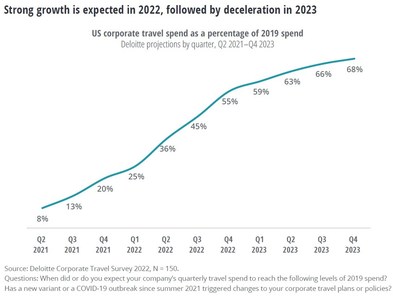
- Corporate travel did not meet most companies' expectations in the second half of 2021 as the Delta and Omicron variants hindered plans. While one-third of travel managers surveyed in June 2021 expected to reach half of 2019 spend by the end of the year, only 8% reached that mark.
- Business travel spend is at least two years from reaching pre-pandemic levels: It is projected to reach 36% of 2019 levels in Q2 2022, and 55% by the end of the year.
- The increase in companies offering flexible work arrangements will have an ongoing impact on business travel. One-quarter of companies say that working from home will lead to more travel to headquarters, but is likely to result in less travel overall. Office-dominant companies are twice as likely to reach 2019 travel spending levels by the end of 2023.
- For international travel, 1 in 4 respondents expect frequency of travel to Europe to near or exceed pre-pandemic levels this year. Asia and Latin America remain far behind in recovery expectations.
- Three in 10 companies expect sustainability goals to result in an 11-25% reduction in travel budgets by 2025.
- While in-person attendance is on the rise, conferences and events face another challenging year. These events offer valuable networking opportunities, but travel managers also rate content delivery more dependent on in-person participation than they did in 2021.
Even as COVID-19 health concerns and travel restrictions subside, corporate travel faces a complex prognosis. Many companies are now implementing the return to office plans they delayed last fall, and an increase in corporate travel is likely to accompany this shift. However, according to Deloitte's new report, "Reshaping the Landscape: Corporate Travel in 2022 and Beyond," a recovery to 2019 spending levels is not expected this year or next. While uncertainty around international relations and additional COVID-19 variants will continue to affect corporate travel, the scope of why and when employees are expected to travel for business is becoming clearer.
The study is based on a survey of 150 U.S.-based executives with travel budget oversight, fielded between Feb. 10 and Feb. 18, 2022.
Deloitte fielded its first corporate travel survey in June 2021, when a rebound appeared to be aligned with return to office plans initially set for the fall. However, as Delta was named a variant of concern a month later, many big companies pushed back their initiatives. Now, many of these same companies are reevaluating their overall approach to travel, driving travel managers to reduce their expectations while seeking opportunities to further increase the financial savings and environmentally friendly practices realized from two years of limited travel.
- One-third (34%) of corporate travel managers surveyed in June 2021 expected to reach half of their 2019 travel spend by the end of 2021; however, only 8% achieved this milestone.
- While 17% of travel managers anticipate a full recovery by the end of 2022, this is down significantly from the 54% who expected the same last summer.
- Overall, strong growth is expected in 2022, but corporate travel spend is not expected to recover to pre-pandemic levels this year or next. Travel spend is expected to reach 36% of 2019 levels by the end of Q2 2022, increasing to 55% by the end of the year, and 68% by the end of 2023.
- COVID-19 variants are a main consideration for this downward revision: Two-thirds of respondents (66%) say the Delta and Omicron variants caused them to push back travel timelines; 1 in 7 (15%) reported a significant rethink.
- Travel restrictions and employee unwillingness to travel continue to be the largest deterrents for a full return; however, the influence of each is down 18% from 2021. Concerns about increased travel prices remain a persistent concern, yet increasing only slightly (1%) compared to summer 2021.
- The return of live industry events is now among the top-five reasons for business travel. When considering the triggers for business travel, sustained low infection rates remain at the top of the list, followed by clients and employees returning to the office, and easing of quarantine requirements.
Despite the easing of restrictions for some destinations, international travel for business still presents many challenges including testing requirements, quarantines and generally unpredictable regulations. Among those surveyed, international travel accounts for one-quarter of 2019 spend, and projections remain more conservative than for domestic travel. Geopolitical developments may further curtail plans for international travel, particularly to Europe.
- Over half (54%) of respondents expect international travel to Europe to resume, but remain below pre-pandemic levels.
- Sales visits (43%), leadership meetings (32%) and client project work (31%) are the top drivers of international corporate travel.
- Europe leads destinations for U.S.-based travelers, with nearly 1 in 4 companies (24%) saying frequency will approach or exceed pre-pandemic levels by the end of 2022, followed by Asia (15%) and Latin America (12%).
- More than half of companies with reasons to visit Africa (70%), the Middle East (54%) or Australia/Oceania (52%) expect no or very little travel to those regions this year.
"Business travel seemed to be ready for takeoff last summer, but the emergence of COVID-19 variants quickly grounded plans — as a result, leaders are more conservative in their estimates for business travel's recovery. While many of us are eager to see our co-workers, clients and associates in person, technology platforms have made it possible for most businesses to not just continue their operations from afar, but thrive in doing so. Combined with workplace flexibility that shows no signs of going away, businesses are reassessing and reprioritizing when and why employees travel — which can create a suitcase full of new opportunities for organizations to evolve and grow."
— Mike Daher, vice chair, Deloitte LLP and U.S. transportation, hospitality and services non-attest leader
Many employers implemented flexible workplace policies over the last two years, and travel managers expect the future work from home rate to be 2.5 times higher than before the pandemic. This will continue to impact how and when employees travel for both work-from-home dominant companies (where the average employee comes to the office zero to two days per week in Q2 of 2022) and office-dominant companies (where the average employee comes to the office at least three days per week in Q2 of 2022).
- For companies that are work-from-home dominant in Q2 of 2022, 36% expect their corporate travel spend to recover to pre-pandemic levels by the end of 2023.
- Conversely, 71% of office-dominant companies say their travel spend will recover by the end of 2023.
- As a result of flexible work arrangements, 1 in 4 respondents expect more trips to company headquarters, despite less frequent travel overall.
- For employees who relocated during the pandemic, two-thirds of companies will reimburse for trips to headquarters. However, nearly one-third (29%) of companies leave employees to shoulder the cost themselves.
- Additionally, private rentals, which offered travelers more space to distance from others during the pandemic, have not become a mainstay of corporate travel programs. Only 1 in 10 companies include non-traditional lodging in their corporate booking tools, and about half (49%) of companies do not reimburse employees for non-hotel lodging.
The severe decline in corporate travel throughout the pandemic helped companies realize significant gains toward their sustainability goals — and their bottom line. As a result, when determining which trips employees should take, business leaders are weighing the expense and carbon emissions involved, along with the ability of technology to replace the need to meet in person.
- One-third of travel managers (35%) surveyed say their companies have pledged to reduce carbon emissions by a specific amount within a certain time period, affecting when and how employees travel.
- Most respondents expect sustainability to reduce their 2025 travel spend by 10% or less. However, nearly 3 in 10 expect a reduction of 11-25%.
- The rise in travel prices grew slightly as a concern from 2021 to 2022. Nearly 3 in 4 companies say they will seek to control costs by limiting the number of trips taken this year.
- Nearly 1 in 3 travel suppliers are looking for guidance from travel management companies on how to reduce their carbon footprint. Further, one-quarter of travel managers say they will prioritize travel suppliers that invest in sustainability.
"As the pandemic situation continues to improve, business leaders have new factors to consider when determining which trips justify the time, expense and carbon emissions involved. Bottom-line and environmental priorities will be supported by technology and behavior changes brought on by two years of mostly virtual meetings and events. Tech platforms will continue to void the need for some trips long after the public health crisis abates."
— Eileen Crowley, vice chair, Deloitte & Touche LLP and U.S. transportation, hospitality and services attest leader
Connect with us on Twitter at @DeloitteCB or on LinkedIn: @MikeDaher and @EileenCrowley.
Deloitte provides industry-leading audit, consulting, tax and advisory services to many of the world's most admired brands, including nearly 90% of the Fortune 500® and more than 7,000 private companies. Our people come together for the greater good and work across the industry sectors that drive and shape today's marketplace — delivering measurable and lasting results that help reinforce public trust in our capital markets, inspire clients to see challenges as opportunities to transform and thrive, and help lead the way toward a stronger economy and a healthier society. Deloitte is proud to be part of the largest global professional services network serving our clients in the markets that are most important to them. Building on more than 175 years of service, our network of member firms spans more than 150 countries and territories. Learn how Deloitte's more than 345,000 people worldwide connect for impact at www.deloitte.com.
Deloitte refers to one or more of Deloitte Touche Tohmatsu Limited, a UK private company limited by guarantee ("DTTL"), its network of member firms, and their related entities. DTTL and each of its member firms are legally separate and independent entities. DTTL (also referred to as "Deloitte Global") does not provide services to clients. In the United States, Deloitte refers to one or more of the US member firms of DTTL, their related entities that operate using the "Deloitte" name in the United States and their respective affiliates. Certain services may not be available to attest clients under the rules and regulations of public accounting. Please see www.deloitte.com/about to learn more about our global network of member firms.

")
View original content to download multimedia:https://www.prnewswire.com/news-releases/deloitte-business-travel-steers-toward-slow-yet-steady-ascent-301526604.html
SOURCE Deloitte
Uncategorized
Tight inventory and frustrated buyers challenge agents in Virginia
With inventory a little more than half of what it was pre-pandemic, agents are struggling to find homes for clients in Virginia.
Share this:

No matter where you are in the state, real estate agents in Virginia are facing low inventory conditions that are creating frustrating scenarios for their buyers.
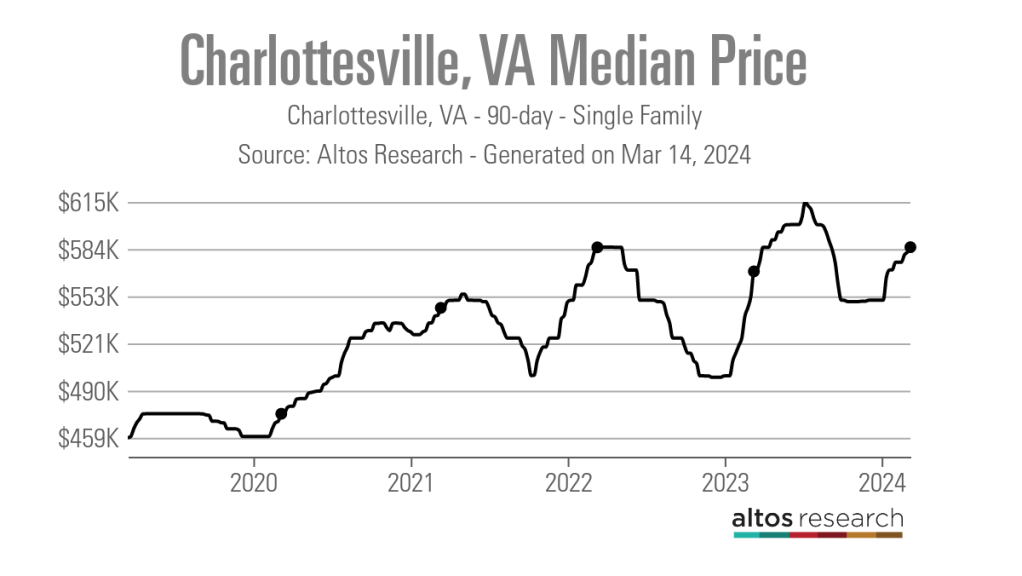
“I think people are getting used to the interest rates where they are now, but there is just a huge lack of inventory,” said Chelsea Newcomb, a RE/MAX Realty Specialists agent based in Charlottesville. “I have buyers that are looking, but to find a house that you love enough to pay a high price for — and to be at over a 6.5% interest rate — it’s just a little bit harder to find something.”
Newcomb said that interest rates and higher prices, which have risen by more than $100,000 since March 2020, according to data from Altos Research, have caused her clients to be pickier when selecting a home.
“When rates and prices were lower, people were more willing to compromise,” Newcomb said.
Out in Wise, Virginia, near the westernmost tip of the state, RE/MAX Cavaliers agent Brett Tiller and his clients are also struggling to find suitable properties.
“The thing that really stands out, especially compared to two years ago, is the lack of quality listings,” Tiller said. “The slightly more upscale single-family listings for move-up buyers with children looking for their forever home just aren’t coming on the market right now, and demand is still very high.”
Statewide, Virginia had a 90-day average of 8,068 active single-family listings as of March 8, 2024, down from 14,471 single-family listings in early March 2020 at the onset of the COVID-19 pandemic, according to Altos Research. That represents a decrease of 44%.

In Newcomb’s base metro area of Charlottesville, there were an average of only 277 active single-family listings during the same recent 90-day period, compared to 892 at the onset of the pandemic. In Wise County, there were only 56 listings.
Due to the demand from move-up buyers in Tiller’s area, the average days on market for homes with a median price of roughly $190,000 was just 17 days as of early March 2024.
“For the right home, which is rare to find right now, we are still seeing multiple offers,” Tiller said. “The demand is the same right now as it was during the heart of the pandemic.”
According to Tiller, the tight inventory has caused homebuyers to spend up to six months searching for their new property, roughly double the time it took prior to the pandemic.
For Matt Salway in the Virginia Beach metro area, the tight inventory conditions are creating a rather hot market.
“Depending on where you are in the area, your listing could have 15 offers in two days,” the agent for Iron Valley Real Estate Hampton Roads | Virginia Beach said. “It has been crazy competition for most of Virginia Beach, and Norfolk is pretty hot too, especially for anything under $400,000.”
According to Altos Research, the Virginia Beach-Norfolk-Newport News housing market had a seven-day average Market Action Index score of 52.44 as of March 14, making it the seventh hottest housing market in the country. Altos considers any Market Action Index score above 30 to be indicative of a seller’s market.

Further up the coastline on the vacation destination of Chincoteague Island, Long & Foster agent Meghan O. Clarkson is also seeing a decent amount of competition despite higher prices and interest rates.
“People are taking their time to actually come see things now instead of buying site unseen, and occasionally we see some seller concessions, but the traffic and the demand is still there; you might just work a little longer with people because we don’t have anything for sale,” Clarkson said.
“I’m busy and constantly have appointments, but the underlying frenzy from the height of the pandemic has gone away, but I think it is because we have just gotten used to it.”
While much of the demand that Clarkson’s market faces is for vacation homes and from retirees looking for a scenic spot to retire, a large portion of the demand in Salway’s market comes from military personnel and civilians working under government contracts.
“We have over a dozen military bases here, plus a bunch of shipyards, so the closer you get to all of those bases, the easier it is to sell a home and the faster the sale happens,” Salway said.
Due to this, Salway said that existing-home inventory typically does not come on the market unless an employment contract ends or the owner is reassigned to a different base, which is currently contributing to the tight inventory situation in his market.
Things are a bit different for Tiller and Newcomb, who are seeing a decent number of buyers from other, more expensive parts of the state.
“One of the crazy things about Louisa and Goochland, which are kind of like suburbs on the western side of Richmond, is that they are growing like crazy,” Newcomb said. “A lot of people are coming in from Northern Virginia because they can work remotely now.”
With a Market Action Index score of 50, it is easy to see why people are leaving the Washington-Arlington-Alexandria market for the Charlottesville market, which has an index score of 41.
In addition, the 90-day average median list price in Charlottesville is $585,000 compared to $729,900 in the D.C. area, which Newcomb said is also luring many Virginia homebuyers to move further south.

“They are very accustomed to higher prices, so they are super impressed with the prices we offer here in the central Virginia area,” Newcomb said.
For local buyers, Newcomb said this means they are frequently being outbid or outpriced.
“A couple who is local to the area and has been here their whole life, they are just now starting to get their mind wrapped around the fact that you can’t get a house for $200,000 anymore,” Newcomb said.
As the year heads closer to spring, triggering the start of the prime homebuying season, agents in Virginia feel optimistic about the market.
“We are seeing seasonal trends like we did up through 2019,” Clarkson said. “The market kind of soft launched around President’s Day and it is still building, but I expect it to pick right back up and be in full swing by Easter like it always used to.”
But while they are confident in demand, questions still remain about whether there will be enough inventory to support even more homebuyers entering the market.
“I have a lot of buyers starting to come off the sidelines, but in my office, I also have a lot of people who are going to list their house in the next two to three weeks now that the weather is starting to break,” Newcomb said. “I think we are going to have a good spring and summer.”
real estate housing market pandemic covid-19 interest ratesSpread & Containment
‘Excess Mortality Skyrocketed’: Tucker Carlson and Dr. Pierre Kory Unpack ‘Criminal’ COVID Response
‘Excess Mortality Skyrocketed’: Tucker Carlson and Dr. Pierre Kory Unpack ‘Criminal’ COVID Response
As the global pandemic unfolded, government-funded…
Share this:


As the global pandemic unfolded, government-funded experimental vaccines were hastily developed for a virus which primarily killed the old and fat (and those with other obvious comorbidities), and an aggressive, global campaign to coerce billions into injecting them ensued.
Then there were the lockdowns - with some countries (New Zealand, for example) building internment camps for those who tested positive for Covid-19, and others such as China welding entire apartment buildings shut to trap people inside.
It was an egregious and unnecessary response to a virus that, while highly virulent, was survivable by the vast majority of the general population.
Oh, and the vaccines, which governments are still pushing, didn't work as advertised to the point where health officials changed the definition of "vaccine" multiple times.
Tucker Carlson recently sat down with Dr. Pierre Kory, a critical care specialist and vocal critic of vaccines. The two had a wide-ranging discussion, which included vaccine safety and efficacy, excess mortality, demographic impacts of the virus, big pharma, and the professional price Kory has paid for speaking out.

Keep reading below, or if you have roughly 50 minutes, watch it in its entirety for free on X:
Ep. 81 They’re still claiming the Covid vax is safe and effective. Yet somehow Dr. Pierre Kory treats hundreds of patients who’ve been badly injured by it. Why is no one in the public health establishment paying attention? pic.twitter.com/IekW4Brhoy
— Tucker Carlson (@TuckerCarlson) March 13, 2024
"Do we have any real sense of what the cost, the physical cost to the country and world has been of those vaccines?" Carlson asked, kicking off the interview.
"I do think we have some understanding of the cost. I mean, I think, you know, you're aware of the work of of Ed Dowd, who's put together a team and looked, analytically at a lot of the epidemiologic data," Kory replied. "I mean, time with that vaccination rollout is when all of the numbers started going sideways, the excess mortality started to skyrocket."
When asked "what kind of death toll are we looking at?", Kory responded "...in 2023 alone, in the first nine months, we had what's called an excess mortality of 158,000 Americans," adding "But this is in 2023. I mean, we've had Omicron now for two years, which is a mild variant. Not that many go to the hospital."
'Safe and Effective'
Tucker also asked Kory why the people who claimed the vaccine were "safe and effective" aren't being held criminally liable for abetting the "killing of all these Americans," to which Kory replied: "It’s my kind of belief, looking back, that [safe and effective] was a predetermined conclusion. There was no data to support that, but it was agreed upon that it would be presented as safe and effective."
Tucker Carlson Asks the Forbidden Question
— The Vigilant Fox ???? (@VigilantFox) March 14, 2024
He wants to know why the people who made the claim “safe and effective” aren’t being held to criminal liability for abetting the “killing of all these Americans.”
DR. PIERRE KORY: “It’s my kind of belief, looking back, that [safe and… pic.twitter.com/Icnge18Rtz
Carlson and Kory then discussed the different segments of the population that experienced vaccine side effects, with Kory noting an "explosion in dying in the youngest and healthiest sectors of society," adding "And why did the employed fare far worse than those that weren't? And this particularly white collar, white collar, more than gray collar, more than blue collar."
Kory also said that Big Pharma is 'terrified' of Vitamin D because it "threatens the disease model." As journalist The Vigilant Fox notes on X, "Vitamin D showed about a 60% effectiveness against the incidence of COVID-19 in randomized control trials," and "showed about 40-50% effectiveness in reducing the incidence of COVID-19 in observational studies."
Dr. Pierre Kory: Big Pharma is ‘TERRIFIED’ of Vitamin D
— The Vigilant Fox ???? (@VigilantFox) March 14, 2024
Why?
Because “It threatens the DISEASE MODEL.”
A new meta-analysis out of Italy, published in the journal, Nutrients, has unearthed some shocking data about Vitamin D.
Looking at data from 16 different studies and 1.26… pic.twitter.com/q5CsMqgVju
Professional costs
Kory - while risking professional suicide by speaking out, has undoubtedly helped save countless lives by advocating for alternate treatments such as Ivermectin.
Kory shared his own experiences of job loss and censorship, highlighting the challenges of advocating for a more nuanced understanding of vaccine safety in an environment often resistant to dissenting voices.
"I wrote a book called The War on Ivermectin and the the genesis of that book," he said, adding "Not only is my expertise on Ivermectin and my vast clinical experience, but and I tell the story before, but I got an email, during this journey from a guy named William B Grant, who's a professor out in California, and he wrote to me this email just one day, my life was going totally sideways because our protocols focused on Ivermectin. I was using a lot in my practice, as were tens of thousands of doctors around the world, to really good benefits. And I was getting attacked, hit jobs in the media, and he wrote me this email on and he said, Dear Dr. Kory, what they're doing to Ivermectin, they've been doing to vitamin D for decades..."
"And it's got five tactics. And these are the five tactics that all industries employ when science emerges, that's inconvenient to their interests. And so I'm just going to give you an example. Ivermectin science was extremely inconvenient to the interests of the pharmaceutical industrial complex. I mean, it threatened the vaccine campaign. It threatened vaccine hesitancy, which was public enemy number one. We know that, that everything, all the propaganda censorship was literally going after something called vaccine hesitancy."
Money makes the world go 'round
Carlson then hit on perhaps the most devious aspect of the relationship between drug companies and the medical establishment, and how special interests completely taint science to the point where public distrust of institutions has spiked in recent years.
"I think all of it starts at the level the medical journals," said Kory. "Because once you have something established in the medical journals as a, let's say, a proven fact or a generally accepted consensus, consensus comes out of the journals."
"I have dozens of rejection letters from investigators around the world who did good trials on ivermectin, tried to publish it. No thank you, no thank you, no thank you. And then the ones that do get in all purportedly prove that ivermectin didn't work," Kory continued.
"So and then when you look at the ones that actually got in and this is where like probably my biggest estrangement and why I don't recognize science and don't trust it anymore, is the trials that flew to publication in the top journals in the world were so brazenly manipulated and corrupted in the design and conduct in, many of us wrote about it. But they flew to publication, and then every time they were published, you saw these huge PR campaigns in the media. New York Times, Boston Globe, L.A. times, ivermectin doesn't work. Latest high quality, rigorous study says. I'm sitting here in my office watching these lies just ripple throughout the media sphere based on fraudulent studies published in the top journals. And that's that's that has changed. Now that's why I say I'm estranged and I don't know what to trust anymore."
Vaccine Injuries
Carlson asked Kory about his clinical experience with vaccine injuries.
"So how this is how I divide, this is just kind of my perception of vaccine injury is that when I use the term vaccine injury, I'm usually referring to what I call a single organ problem, like pericarditis, myocarditis, stroke, something like that. An autoimmune disease," he replied.
"What I specialize in my practice, is I treat patients with what we call a long Covid long vaxx. It's the same disease, just different triggers, right? One is triggered by Covid, the other one is triggered by the spike protein from the vaccine. Much more common is long vax. The only real differences between the two conditions is that the vaccinated are, on average, sicker and more disabled than the long Covids, with some pretty prominent exceptions to that."
Watch the entire interview above, and you can support Tucker Carlson's endeavors by joining the Tucker Carlson Network here...
Uncategorized
These Cities Have The Highest (And Lowest) Share Of Unaffordable Neighborhoods In 2024
These Cities Have The Highest (And Lowest) Share Of Unaffordable Neighborhoods In 2024
Authored by Sam Bourgi via CreditNews.com,
Homeownership…
Share this:


Authored by Sam Bourgi via CreditNews.com,
Homeownership is one of the key pillars of the American dream. But for many families, the idyllic fantasy of a picket fence and backyard barbecues remains just that—a fantasy.
Thanks to elevated mortgage rates, sky-high house prices, and scarce inventory, millions of American families have been locked out of the opportunity to buy a home in many cities.
To shed light on America’s housing affordability crisis, Creditnews Research ranked the 50 most populous cities by the percentage of neighborhoods within reach for the typical married-couple household to buy a home in.
The study reveals a stark reality, with many cities completely out of reach for the most affluent household type. Not only that, the unaffordability has radically worsened in recent years.
Comparing how affordability has changed since Covid, Creditnews Research discovered an alarming pattern—indicating consistently more unaffordable housing in all but three cities.
Fortunately, there’s still hope for households seeking to put down roots in more affordable cities—especially for those looking beyond Los Angeles, New York, Boston, San Jone, and Miami.
The typical American family has a hard time putting down roots in many parts of the country. In 11 of the top 50 cities, at least 50% of neighborhoods are out of reach for the average married-couple household. The affordability gap has widened significantly since Covid; in fact, no major city has reported an improvement in affordability post-pandemic.
Sam Bourgi, Senior Analyst at Creditnews
Key findings
-
The most unaffordable cities are Los Angeles, Boston, St. Louis, and San Jose; in each city, 100% of neighborhoods are out of reach for for married-couple households earning a median income;
-
The most affordable cities are Cleveland, Hartford, and Memphis—in these cities, the typical family can afford all neighborhoods;
-
None of the top 50 cities by population saw an improvement in affordable neighborhoods post-pandemic;
-
California recorded the biggest spike in unaffordable neighborhoods since pre-Covid;
-
The share of unaffordable neighborhoods has increased the most since pre-Covid in San Jose (70 percentage points), San Diego (from 57.8 percentage points), and Riverside-San Bernardino (51.9 percentage points);
-
Only three cities have seen no change in housing affordability since pre-Covid: Cleveland, Memphis, and Hartford. They’re also the only cities that had 0% of unaffordable neighborhoods before Covid.
Cities with the highest share of unaffordable neighborhoods
With few exceptions, the most unaffordable cities for married-couple households tend to be located in some of the nation’s most expensive housing markets.
Four cities in the ranking have an unaffordability percentage of 100%—indicating that the median married-couple household couldn’t qualify for an average home in any neighborhood.
The following are the cities ranked from the least affordable to the most:
-
Los Angeles, CA: Housing affordability in Los Angeles has deteriorated over the last five years, as average incomes have failed to keep pace with rising property values and elevated mortgage rates. The median household income of married-couple families in LA is $117,056, but even at that rate, 100% of the city’s neighborhoods are unaffordable.
-
St. Louis, MO: It may be surprising to see St. Louis ranking among the most unaffordable housing markets for married-couple households. But a closer look reveals that the Mound City was unaffordable even before Covid. In 2019, 98% of the city’s neighborhoods were unaffordable—way worse than Los Angeles, Boston, or San Jose.
-
Boston, MA: Boston’s housing affordability challenges began long before Covid but accelerated after the pandemic. Before Covid, married couples earning a median income were priced out of 90.7% of Boston’s neighborhoods. But that figure has since jumped to 100%, despite a comfortable median household income of $172,223.
-
San Jose, CA: Nestled in Silicon Valley, San Jose has long been one of the most expensive cities for housing in America. But things have gotten far worse since Covid, as 100% of its neighborhoods are now out of reach for the average family. Perhaps the most shocking part is that the median household income for married-couple families is $188,403—much higher than the national average.
-
San Diego, CA: Another California city, San Diego, is among the most unaffordable places in the country. Despite boasting a median married-couple household income of $136,297, 95.6% of the city’s neighborhoods are unaffordable.
-
San Francisco, CA: San Francisco is another California city with a high married-couple median income ($211,585) but low affordability. The percentage of unaffordable neighborhoods for these homebuyers stands at 89.2%.
-
New York, NY: As one of the most expensive cities in America, New York is a difficult housing market for married couples with dual income. New York City’s share of unaffordable neighborhoods is 85.9%, marking a 33.4% rise from pre-Covid times.
-
Miami, FL: Partly due to a population boom post-Covid, Miami is now one of the most unaffordable cities for homebuyers. Roughly four out of five (79.4%) of Miami’s neighborhoods are out of reach price-wise for married-couple families. That’s a 34.7% increase from 2019.
-
Nashville, TN: With Nashville’s population growth rebounding to pre-pandemic levels, the city has also seen greater affordability challenges. In the Music City, 73.7% of neighborhoods are considered unaffordable for married-couple households—an increase of 11.9% from pre-Covid levels.
-
Richmond, VA: Rounding out the bottom 10 is Richmond, where 55.9% of the city’s 161 neighborhoods are unaffordable for married-couple households. That’s an 11.9% increase from pre-Covid levels.
Cities with the lowest share of unaffordable neighborhoods
All the cities in our top-10 ranking have less than 10% unaffordable neighborhoods—meaning the average family can qualify for a home in at least 90% of the city.
Interestingly, these cities are also outside the top 15 cities by population, and eight are in the bottom half.
The following are the cities ranked from the most affordable to the least:
-
Hartford, CT: Hartford ranks first with the percentage of unaffordable neighborhoods at 0%, unchanged since pre-Covid times. Married couples earning a median income of $135,612 can afford to live in any of the city’s 16 neighborhoods. Interestingly, Hartford is the smallest city to rank in the top 10.
-
Memphis, TN: Like Hartford, Memphis has 0% unaffordable neighborhoods, meaning any married couple earning a median income of $101,734 can afford an average homes in any of the city’s 12 neighborhoods. The percentage of unaffordable neighborhoods also stood at 0% before Covid.
-
Cleveland, OH: The Midwestern city of Cleveland is also tied for first, with the percentage of unaffordable neighborhoods at 0%. That means households with a median-couple income of $89,066 can qualify for an average home in all of the city’s neighborhoods. Cleveland is also among the three cities that have seen no change in unaffordability compared to 2019.
-
Minneapolis, MN: The largest city in the top 10, Minneapolis’ share of unaffordable neighborhoods stood at 2.41%, up slightly from 2019. Married couples earning the median income ($149,214) have access to the vast majority of the city’s 83 neighborhoods.
-
Baltimore, MD: Married-couple households in Baltimore earn a median income of $141,634. At that rate, they can afford to live in 97.3% of the city’s 222 neighborhoods, making only 2.7% of neighborhoods unaffordable. That’s up from 0% pre-Covid.
-
Louisville, KY: Louisville is a highly competitive market for married households. For married-couple households earning a median wage, only 3.6% of neighborhoods are unaffordable, up 11.9% from pre-Covid times.
-
Cincinnati, OH: The second Ohio city in the top 10 ranks close to Cleveland in population but has a much higher median married-couple household income of $129,324. Only 3.6% of the city’s neighborhoods are unaffordable, up slightly from pre-pandemic levels.
-
Indianapolis, IN: Another competitive Midwestern market, only 4.4% of Indianapolis is unaffordable, making the vast majority of the city’s 92 neighborhoods accessible to the average married couple. Still, the percentage of unaffordable neighborhoods before Covid was less than 1%.
-
Oklahoma City, OK: Before Covid, Oklahoma City had 0% neighborhoods unaffordable for married-couple households earning the median wage. It has since increased to 4.69%, which is still tiny compared to the national average.
-
Kansas City, MO: Kansas City has one of the largest numbers of neighborhoods in the top 50 cities. Its married-couple residents can afford to live in nearly 95% of them, making only 5.6% of neighborhoods out of reach. Like Indiana, Kansas City’s share of unaffordable neighborhoods was less than 1% before Covid.
The biggest COVID losers
What's particularly astonishing about the current housing market is just how quickly affordability has declined since Covid.
Even factoring in the market correction after the 2022 peak, the price of existing homes is still nearly one-third higher than before Covid. Mortgage rates have also more than doubled since early 2022.
Combined, the rising home prices and interest rates led to the worst mortgage affordability in more than 40 years.
Against this backdrop, it’s hardly surprising that unaffordability increased in 47 of the 50 cities studied and remained flat in the other three. No city reported improved affordability in 2024 compared to 2019.
The biggest increases are led by San Jose (70 percentage points), San Diego (57.8 percentage points), Riverside-San Bernardino (51.9 percentage points), Sacramento (43 percentage points), Orlando (37.4 percentage points), Miami (34.7 percentage points), and New York City (33.4 percentage points).
The following cities in our study are ranked by the largest percentage point change in unaffordable neighborhoods since pre-Covid:


IFM’s Hat Trick and Reflections On Option-To-Buy M&A


Q4 Update: Delinquencies, Foreclosures and REO


Net Zero, The Digital Panopticon, & The Future Of Food


Pharma industry reputation remains steady at a ‘new normal’ after Covid, Harris Poll finds


These Cities Have The Highest (And Lowest) Share Of Unaffordable Neighborhoods In 2024


For-profit nursing homes are cutting corners on safety and draining resources with financial shenanigans − especially at midsize chains that dodge public scrutiny


Trump nearly derailed democracy once − here’s what to watch out for in reelection campaign


Part 1: Current State of the Housing Market; Overview for mid-March 2024


The Question You Should Ask Whenever You’re Wrong


‘Excess Mortality Skyrocketed’: Tucker Carlson and Dr. Pierre Kory Unpack ‘Criminal’ COVID Response
-

 Uncategorized3 weeks ago
All Of The Elements Are In Place For An Economic Crisis Of Staggering Proportions
-

 International6 days ago
EyePoint poaches medical chief from Apellis; Sandoz CFO, longtime BioNTech exec to retire
-

 Uncategorized4 weeks ago
California Counties Could Be Forced To Pay $300 Million To Cover COVID-Era Program
-

 Uncategorized3 weeks ago
Apparel Retailer Express Moving Toward Bankruptcy
-

 Uncategorized4 weeks ago
Industrial Production Decreased 0.1% in January
-

 International6 days ago
Walmart launches clever answer to Target’s new membership program
-

 Uncategorized4 weeks ago
RFK Jr: The Wuhan Cover-Up & The Rise Of The Biowarfare-Industrial Complex
-

 Uncategorized3 weeks ago
GOP Efforts To Shore Up Election Security In Swing States Face Challenges