Government
Coronavirus – weekly update – 29 April 2020
Coronavirus – weekly update – 29 April 2020
Share this:

- Reopening economies: more haste, less speed
- Watching for a fresh spike in the curve
- Mass testing remains an important signpost
- Markets switch into risk-on mode
- A key week for central banks
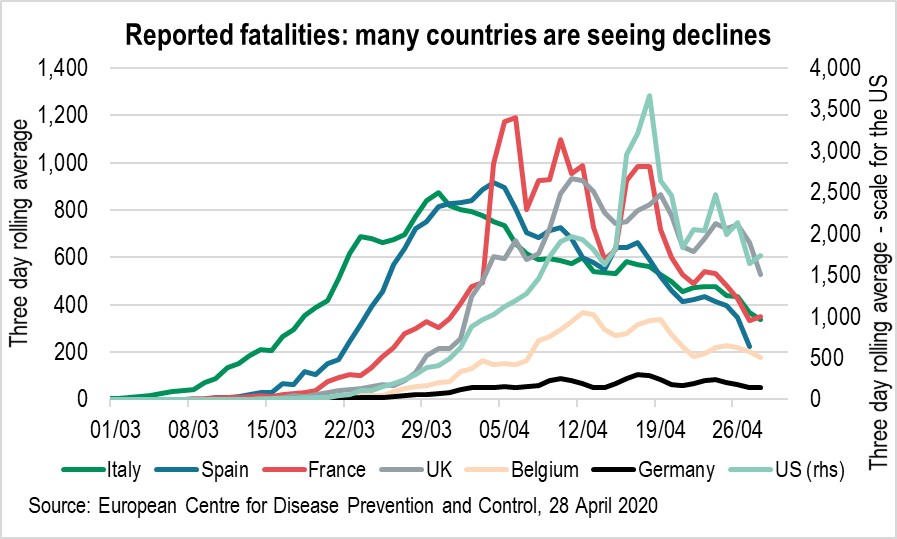
The COVID-19 caseload has now reached almost 3 million infected cases and there have been over 210 000 fatalities. The death toll is on the decline now in Europe and appears to have plateaued in the US, albeit at a high level. As always, we highlight that caution must be taken in interpreting the data in both the time series and the cross section, given the different approaches to measurement and testing across countries.
Exhibit 1

Reopening economies: more haste, less speed
It is important to put the relative success in suppressing the spread of the virus in context. It has been achieved through placing many societies in lockdown. Now, a number of countries are preparing to exit the shutdown. Plans vary from place to place, both in terms of the pace and the extent to which measures are relaxed and the detail available in the public domain.
For example, consider the following:
- France: Prime Minister Edouard Philippe announced a plan to begin reopening the economy from 11 May – with implementation varying from region to region. Companies will be encouraged to persist with teleworking. Public transport will resume. Schools will reopen gradually from 11 May, albeit with social distancing rules limiting class sizes. Cafes, restaurants and venues which host large numbers of people (such as cinemas) remain closed. Large gatherings of more than 5 000 people will remain prohibited until September.
- Spain: the prime minister announced a multi-stage exit plan to be completed over six to eight weeks, with the pace of implementation varying from province to province. It allows for a gradual reopening of society – from restaurants and cinemas to places of worship – often subject to social distancing restrictions (for example, restaurants’ capacity is limited to a third). Long-distance travel may still be prohibited and face masks would be ‘highly recommended’ when public transport resumes.
The motivation for the exits is clear. In the words of Edouard Philippe: “We must protect the French without immobilising the country to the point where it collapses.”
Watching for a fresh spike in the curve
However, there is a real risk of a second wave erupting as the extreme measures are lifted. That is, the caseload could start to rise rapidly again. That may force a cessation of the exit measures at the very least and potentially the re-imposition of stricter measures that would cause renewed economic stress.
Indeed, Jasmina Panovska-Griffiths, a senior research fellow and lecturer in mathematical modelling at University College London, argues that these multiple waves are a characteristic feature of this kind of pandemic.[1]
“The 4 major flu pandemics of the past century – the Spanish flu, Asian flu, 1968-70 Hong Kong flu and swine flu – came in several waves, too. The 1918 Spanish flu pandemic that killed more than 50 million people hit in three waves, with the second killing more people than the first.”
A second wave is not inevitable. Governments can calibrate their exit strategy carefully to control the spread of the population to suppress the spread of the virus. Not every country will be able to relax measures at the same pace.
Mass testing remains an important signpost
The capacity of the authorities to conduct diagnostic testing and contact tracing on an industrial scale to catch new cases as they emerge will likely prove a key constraint on exiting any restrictions.
In some cases, it is possible that the virus has already affected enough people that the population is approaching herd immunity, so that the virus can no longer spread easily from person to person. Sweden’s ambassador to the US has claimed that Stockholm may soon approach this situation.
However, the consensus among scientists is that the majority of the population in many countries will need to be exposed to the virus before herd immunity is established. Current estimates suggest that even in the urban hotspots such as New York City, we are far short of herd immunity.
Markets switch into risk-on mode
The evolution of new cases and in particular new fatalities in countries which exit lockdown is a key sign-post for the market. The faster those countries can ease the quarantine measures, the sooner they can resuscitate their economies.
With much of the global economy still in lockdown, concerns about a second wave may still be rife among investors, while a vaccine is still elusive.
However, news of falls in the number of new COVID-19 cases and a move towards a relaxation of lockdowns in some countries has given a more optimistic tone to markets over the last week. For example, the US S&P 500 equity index erased roughly half of the loss sustained between 14 February and 23 March. In our view, late March was certainly not the right time to sell risk assets.
Exhibit 2

A key week for central banks
This week, ending 1 May, is a key week for central banks – the Bank of Japan (BoJ) met on Monday, the Federal Open Market Committee (FOMC) meets today and the ECB on Thursday.
• The BoJ on Monday removed the numerical guidance of JPY 80 trillion per year on its JGB government bond purchases. While, by itself, this does not imply a loosening of monetary policy as the BoJ’s current yield curve control (YCC) framework already allows for unlimited JGB purchases, it does have an important symbolic value. By buying “without setting an upper limit,” the central bank might strengthen the impression in the market that it is moving towards debt monetisation, pointing to a potential direction for other central banks. This action should keep the yen lower and prevent yields from rising.
• A reassertion by Fed Chair Powell of his ‘whatever it takes’ approach is expected along with an assessment of the economic outlook and the Fed’s response. This scheduled FOMC meeting is the first since the emergency actions taken through inter-meeting decisions on 3, 15 and 23 March. We expect Mr Powell to announce the expansion of the USD 500 billion MLF (state & local government) and the USD 600 billion MSNLF/MSELF (SME) facilities. These are yet to be launched and should further help improve access to US dollar liquidity.
• The ECB may also send a strong message – namely that it is ready to increase the PEPP asset purchase envelope to buy BB rated bonds if needed. This is a potentially important move in view of the recent increase in bond risk premiums. The ECB’s decision last week to relax its collateral eligibility criteria to include BB paper paves the way for this next step. This announcement was key in underpinning support for ‘peripheral’ eurozone bonds.
• The European Union Council last week failed to provide a definitive answer to the question of how the fiscal bill of COVID-19 will be split across the EU. It did agree in principle to set up a ‘recovery fund’. However, there was no agreement on the size, funding, distribution and timing. Hopefully, the council will agree on some of these points by the next meeting on 6 May. Lack of agreement on the ‘recovery fund’ remains a key risk for Europe, the euro and ‘peripheral’ bond markets in particular.
• Oil continues to trade weak, especially ahead of the next WTI futures contract expiry. We see this putting pressure on the external accounts of oil producers the GCC, Colombia and Mexico. However, it should be good for the trade balances of Japan, Turkey, India and South Africa. This should continue to drive up dispersion in emerging markets.
• The continued rise in jobless claims in the US is pointing to double-digit unemployment rates. This could imply a significant rise in mortgage and other consumer loan delinquencies, potentially greater than that seen in 2008. While the fiscal injection through the CARES Act should help alleviate some of this stress, the effectiveness of the current support programmes remains to be seen.
• Latest data out of Asia, where we are seeing lockdowns being lifted, still points to continuing weak consumer activity as people remain wary of taking public transport and engaging in activities that could bring them into contact with a high number of people. This could be a good pointer to the economies of those countries that are looking to partially lift their lockdowns.
• Earnings season continues, with analysts repeatedly cutting their estimates. There have been positive surprises, but the market is more focused on the prospect of economies reopening and earnings recovering in 2021. As a result, equities have continued to trade at record high price/earnings multiples. Given what futures are telling us about dividends and volatility in 2021-22, these multiples look challenging.
Asset allocation view
In summary, we believe our set of signposts will become ever more important now that valuations have been reset and there is greater two-way risk.
In terms of asset allocation, we continue to be long market risk strategically. We recently entered an overweight position in European and US investment-grade credit (financed by government bonds) and are long emerging market and UK equities; long commodities and long EM hard currency debt.
However, we also lowered our risk exposure tactically with short positions in the S&P 500 and in eurozone equities ahead of more news on the economic damage caused by the virus and given the risks associated with the exit strategies from lockdowns. We are now waiting patiently for a market setback to increase our risk exposure again in the near future.
Denis Panel, Chief Investment Officer Multi Assets & Quantitative Solutions, and Marina Chernyak, senior economist and coordinator of COVID-19 research.
[1] Also see Coronavirus: when should we lift the lockdown? on https://theconversation.com/coronavirus-when-should-we-lift-the-lockdown-136473
Any views expressed here are those of the author as of the date of publication, are based on available information, and are subject to change without notice. Individual portfolio management teams may hold different views and may take different investment decisions for different clients.
The value of investments and the income they generate may go down as well as up and it is possible that investors will not recover their initial outlay. Past performance is no guarantee for future returns.
Investing in emerging markets,
or specialised or restricted sectors is likely to be subject to a
higher-than-average volatility due to a high degree of concentration, greater
uncertainty because less information is available, there is less liquidity or
due to greater sensitivity to changes in market conditions (social, political
and economic conditions).
Writen by Marina Chernyak. The post Coronavirus – weekly update – 29 April 2020 appeared first on Investors' Corner - Der offizielle Blog von BNP Paribas Asset Management.
Government
Low Iron Levels In Blood Could Trigger Long COVID: Study
Low Iron Levels In Blood Could Trigger Long COVID: Study
Authored by Amie Dahnke via The Epoch Times (emphasis ours),
People with inadequate…
Share this:


Authored by Amie Dahnke via The Epoch Times (emphasis ours),
People with inadequate iron levels in their blood due to a COVID-19 infection could be at greater risk of long COVID.
A new study indicates that problems with iron levels in the bloodstream likely trigger chronic inflammation and other conditions associated with the post-COVID phenomenon. The findings, published on March 1 in Nature Immunology, could offer new ways to treat or prevent the condition.
Long COVID Patients Have Low Iron Levels
Researchers at the University of Cambridge pinpointed low iron as a potential link to long-COVID symptoms thanks to a study they initiated shortly after the start of the pandemic. They recruited people who tested positive for the virus to provide blood samples for analysis over a year, which allowed the researchers to look for post-infection changes in the blood. The researchers looked at 214 samples and found that 45 percent of patients reported symptoms of long COVID that lasted between three and 10 months.
In analyzing the blood samples, the research team noticed that people experiencing long COVID had low iron levels, contributing to anemia and low red blood cell production, just two weeks after they were diagnosed with COVID-19. This was true for patients regardless of age, sex, or the initial severity of their infection.
According to one of the study co-authors, the removal of iron from the bloodstream is a natural process and defense mechanism of the body.
But it can jeopardize a person’s recovery.
“When the body has an infection, it responds by removing iron from the bloodstream. This protects us from potentially lethal bacteria that capture the iron in the bloodstream and grow rapidly. It’s an evolutionary response that redistributes iron in the body, and the blood plasma becomes an iron desert,” University of Oxford professor Hal Drakesmith said in a press release. “However, if this goes on for a long time, there is less iron for red blood cells, so oxygen is transported less efficiently affecting metabolism and energy production, and for white blood cells, which need iron to work properly. The protective mechanism ends up becoming a problem.”
The research team believes that consistently low iron levels could explain why individuals with long COVID continue to experience fatigue and difficulty exercising. As such, the researchers suggested iron supplementation to help regulate and prevent the often debilitating symptoms associated with long COVID.
“It isn’t necessarily the case that individuals don’t have enough iron in their body, it’s just that it’s trapped in the wrong place,” Aimee Hanson, a postdoctoral researcher at the University of Cambridge who worked on the study, said in the press release. “What we need is a way to remobilize the iron and pull it back into the bloodstream, where it becomes more useful to the red blood cells.”
The research team pointed out that iron supplementation isn’t always straightforward. Achieving the right level of iron varies from person to person. Too much iron can cause stomach issues, ranging from constipation, nausea, and abdominal pain to gastritis and gastric lesions.
1 in 5 Still Affected by Long COVID
COVID-19 has affected nearly 40 percent of Americans, with one in five of those still suffering from symptoms of long COVID, according to the U.S. Centers for Disease Control and Prevention (CDC). Long COVID is marked by health issues that continue at least four weeks after an individual was initially diagnosed with COVID-19. Symptoms can last for days, weeks, months, or years and may include fatigue, cough or chest pain, headache, brain fog, depression or anxiety, digestive issues, and joint or muscle pain.
Government
Walmart joins Costco in sharing key pricing news
The massive retailers have both shared information that some retailers keep very close to the vest.
Share this:

As we head toward a presidential election, the presumed candidates for both parties will look for issues that rally undecided voters.
The economy will be a key issue, with Democrats pointing to job creation and lowering prices while Republicans will cite the layoffs at Big Tech companies, high housing prices, and of course, sticky inflation.
The covid pandemic created a perfect storm for inflation and higher prices. It became harder to get many items because people getting sick slowed down, or even stopped, production at some factories.
Related: Popular mall retailer shuts down abruptly after bankruptcy filing
It was also a period where demand increased while shipping, trucking and delivery systems were all strained or thrown out of whack. The combination led to product shortages and higher prices.
You might have gone to the grocery store and not been able to buy your favorite paper towel brand or find toilet paper at all. That happened partly because of the supply chain and partly due to increased demand, but at the end of the day, it led to higher prices, which some consumers blamed on President Joe Biden's administration.
Biden, of course, was blamed for the price increases, but as inflation has dropped and grocery prices have fallen, few companies have been up front about it. That's probably not a political choice in most cases. Instead, some companies have chosen to lower prices more slowly than they raised them.
However, two major retailers, Walmart (WMT) and Costco, have been very honest about inflation. Walmart Chief Executive Doug McMillon's most recent comments validate what Biden's administration has been saying about the state of the economy. And they contrast with the economic picture being painted by Republicans who support their presumptive nominee, Donald Trump.
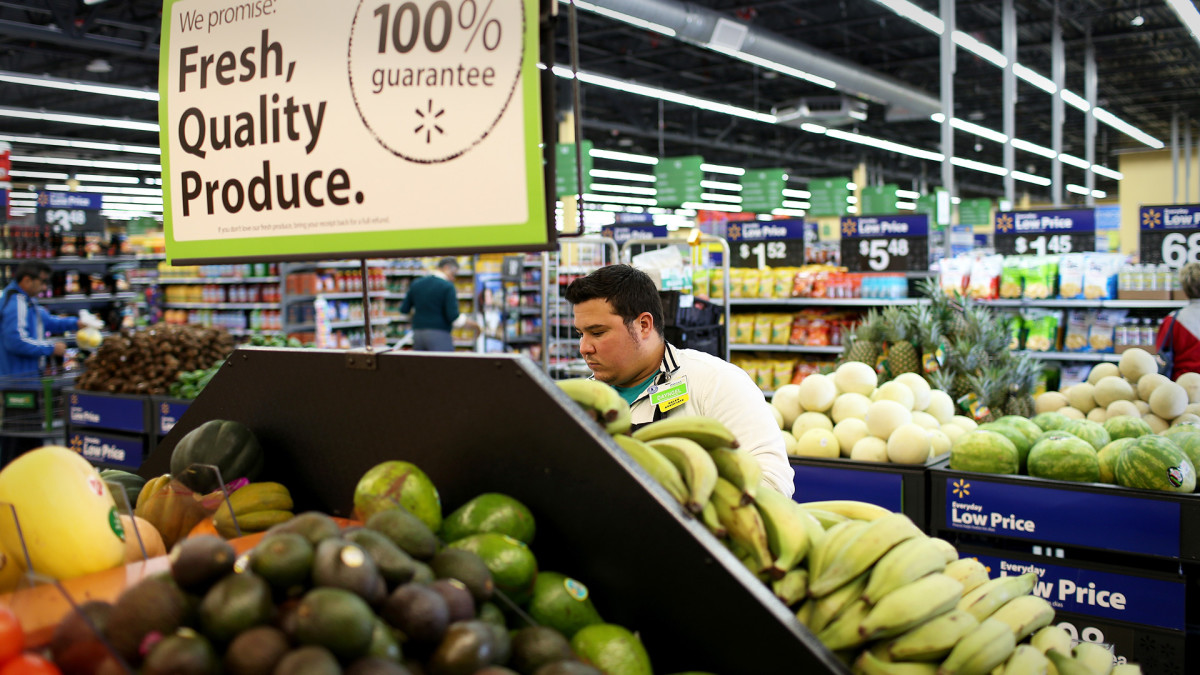
Image source: Joe Raedle/Getty Images
Walmart sees lower prices
McMillon does not talk about lower prices to make a political statement. He's communicating with customers and potential customers through the analysts who cover the company's quarterly-earnings calls.
During Walmart's fiscal-fourth-quarter-earnings call, McMillon was clear that prices are going down.
"I'm excited about the omnichannel net promoter score trends the team is driving. Across countries, we continue to see a customer that's resilient but looking for value. As always, we're working hard to deliver that for them, including through our rollbacks on food pricing in Walmart U.S. Those were up significantly in Q4 versus last year, following a big increase in Q3," he said.
He was specific about where the chain has seen prices go down.
"Our general merchandise prices are lower than a year ago and even two years ago in some categories, which means our customers are finding value in areas like apparel and hard lines," he said. "In food, prices are lower than a year ago in places like eggs, apples, and deli snacks, but higher in other places like asparagus and blackberries."
McMillon said that in other areas prices were still up but have been falling.
"Dry grocery and consumables categories like paper goods and cleaning supplies are up mid-single digits versus last year and high teens versus two years ago. Private-brand penetration is up in many of the countries where we operate, including the United States," he said.
Costco sees almost no inflation impact
McMillon avoided the word inflation in his comments. Costco (COST) Chief Financial Officer Richard Galanti, who steps down on March 15, has been very transparent on the topic.
The CFO commented on inflation during his company's fiscal-first-quarter-earnings call.
"Most recently, in the last fourth-quarter discussion, we had estimated that year-over-year inflation was in the 1% to 2% range. Our estimate for the quarter just ended, that inflation was in the 0% to 1% range," he said.
Galanti made clear that inflation (and even deflation) varied by category.
"A bigger deflation in some big and bulky items like furniture sets due to lower freight costs year over year, as well as on things like domestics, bulky lower-priced items, again, where the freight cost is significant. Some deflationary items were as much as 20% to 30% and, again, mostly freight-related," he added.
bankruptcy pandemic trumpGovernment
Walmart has really good news for shoppers (and Joe Biden)
The giant retailer joins Costco in making a statement that has political overtones, even if that’s not the intent.
Share this:

As we head toward a presidential election, the presumed candidates for both parties will look for issues that rally undecided voters.
The economy will be a key issue, with Democrats pointing to job creation and lowering prices while Republicans will cite the layoffs at Big Tech companies, high housing prices, and of course, sticky inflation.
The covid pandemic created a perfect storm for inflation and higher prices. It became harder to get many items because people getting sick slowed down, or even stopped, production at some factories.
Related: Popular mall retailer shuts down abruptly after bankruptcy filing
It was also a period where demand increased while shipping, trucking and delivery systems were all strained or thrown out of whack. The combination led to product shortages and higher prices.
You might have gone to the grocery store and not been able to buy your favorite paper towel brand or find toilet paper at all. That happened partly because of the supply chain and partly due to increased demand, but at the end of the day, it led to higher prices, which some consumers blamed on President Joe Biden's administration.
Biden, of course, was blamed for the price increases, but as inflation has dropped and grocery prices have fallen, few companies have been up front about it. That's probably not a political choice in most cases. Instead, some companies have chosen to lower prices more slowly than they raised them.
However, two major retailers, Walmart (WMT) and Costco, have been very honest about inflation. Walmart Chief Executive Doug McMillon's most recent comments validate what Biden's administration has been saying about the state of the economy. And they contrast with the economic picture being painted by Republicans who support their presumptive nominee, Donald Trump.
Image source: Joe Raedle/Getty Images
Walmart sees lower prices
McMillon does not talk about lower prices to make a political statement. He's communicating with customers and potential customers through the analysts who cover the company's quarterly-earnings calls.
During Walmart's fiscal-fourth-quarter-earnings call, McMillon was clear that prices are going down.
"I'm excited about the omnichannel net promoter score trends the team is driving. Across countries, we continue to see a customer that's resilient but looking for value. As always, we're working hard to deliver that for them, including through our rollbacks on food pricing in Walmart U.S. Those were up significantly in Q4 versus last year, following a big increase in Q3," he said.
He was specific about where the chain has seen prices go down.
"Our general merchandise prices are lower than a year ago and even two years ago in some categories, which means our customers are finding value in areas like apparel and hard lines," he said. "In food, prices are lower than a year ago in places like eggs, apples, and deli snacks, but higher in other places like asparagus and blackberries."
McMillon said that in other areas prices were still up but have been falling.
"Dry grocery and consumables categories like paper goods and cleaning supplies are up mid-single digits versus last year and high teens versus two years ago. Private-brand penetration is up in many of the countries where we operate, including the United States," he said.
Costco sees almost no inflation impact
McMillon avoided the word inflation in his comments. Costco (COST) Chief Financial Officer Richard Galanti, who steps down on March 15, has been very transparent on the topic.
The CFO commented on inflation during his company's fiscal-first-quarter-earnings call.
"Most recently, in the last fourth-quarter discussion, we had estimated that year-over-year inflation was in the 1% to 2% range. Our estimate for the quarter just ended, that inflation was in the 0% to 1% range," he said.
Galanti made clear that inflation (and even deflation) varied by category.
"A bigger deflation in some big and bulky items like furniture sets due to lower freight costs year over year, as well as on things like domestics, bulky lower-priced items, again, where the freight cost is significant. Some deflationary items were as much as 20% to 30% and, again, mostly freight-related," he added.
bankruptcy pandemic trump

When Military Rule Supplants Democracy


Catastrophic Risk: Investing and Business Implications


Dropping Like a Stone: ON RRP Take‑up in the Second Half of 2023


Where Is R‑Star and the End of the Refi Boom: The Top 5 Posts of 2023


The Digest #187


Redefining Poverty: Towards a Transpartisan Approach


The Coming Of The Police State In America


Students lose out as cities and states give billions in property tax breaks to businesses − draining school budgets and especially hurting the poorest students


Is the United States overestimating China’s power?


GBPINR: Analysis and Projections for 2024
-

 Uncategorized2 weeks ago
All Of The Elements Are In Place For An Economic Crisis Of Staggering Proportions
-

 Uncategorized1 month ago
Cathie Wood sells a major tech stock (again)
-

 Uncategorized3 weeks ago
California Counties Could Be Forced To Pay $300 Million To Cover COVID-Era Program
-

 Uncategorized2 weeks ago
Apparel Retailer Express Moving Toward Bankruptcy
-

 Uncategorized3 weeks ago
Industrial Production Decreased 0.1% in January
-

 International1 day ago
Walmart launches clever answer to Target’s new membership program
-

 Uncategorized3 weeks ago
RFK Jr: The Wuhan Cover-Up & The Rise Of The Biowarfare-Industrial Complex
-

 International2 days ago
EyePoint poaches medical chief from Apellis; Sandoz CFO, longtime BioNTech exec to retire