International
Conflict Of Interest (rates): 10-year Treasury Yield Highest in Almost Two Years
The dollar was high and going higher. Emerging markets had been seriously complaining. In one, the top central banker for India outright warned, “dollar funding has evaporated.” The TIC data supported his view, with full-blown negative months, net…
Share this:

The dollar was high and going higher. Emerging markets had been seriously complaining. In one, the top central banker for India outright warned, “dollar funding has evaporated.” The TIC data supported his view, with full-blown negative months, net selling from afar that’s historically akin to what was coming out of India and the rest of the world. China was cutting its RRR multiple times.
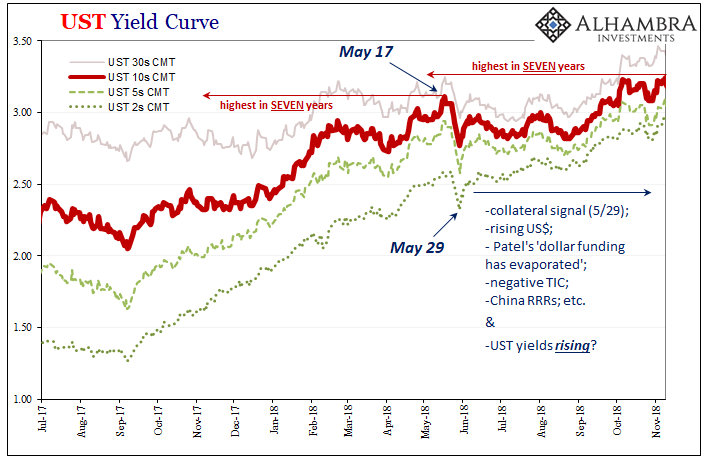
This was all following May 29, 2018, too, a day in the global “bond market” which had left no doubt collateral conditions had already become seriously strained; the monetary tightening exclamation point on all of the above.
Clear dollar shortage stuff, one after another after another. And since the “bond market” and US Treasuries are at the center of it all, or closest viewpoint from which to peer inside the vast monetary shadows, LT UST yields of course…rose?
Huh?
Yeah, they did. Not only that, after having reached a high on May 17, the 10-year would climb further to its highest in seven years by early October. You might remember those days, it was in all the newspapers, splashed across the internet in every form of its mediums.


The bond bull was immediately declared deader than a doornail, done, fork stuck already in what was reported as its rotting carcass stinking up the place. Inflation had killed it off, too, they said. Get used to much, much higher rates because this sucker, Jay’s economy was absolutely roaring.
Obviously, none of it was true; not the bond “bull” bull, nor all the scattershot analysis thrown around, including a whole library of the same such commentary beyond the tiny sample reproduced (easily) above.
Barely over a month later, it all went downhill – literally, in the case of bond yields as well as the global economy.
So what did happen in 2018? How can bond yields still go up despite all those nasty things listed at the outset? And what might that episode three years ago tell us about our current markets and global situation?
First, always remember yield curve dynamics; the Treasury curve, like any other, isn’t monolithic. There are parts, and each piece is oftentimes influenced by separate factors. If you haven’t already, this is a good place to start for these basics.

In addition to nominal yields and the curve level, you always, always need to pay close attention to the shape – on the whole as well as in discrete parts – and how the profile changes over time. This is a dynamic monetary/financial/economic universe, and the curve distorts with meaning and purpose hardly anyone nowadays seems able to properly decode.
Though they are related, and do share some common factors, the balance of those can be quite different such that there are almost two curves operating simultaneously. The one at the front is most heavily inclined by monetary alternatives, and that money-like influence continues out into the middle of the notes – up to around the 5-year maturity (for a more detailed and complete description of these inner workings, click on the link above).
From the 7-year note on out to the long bond end, this is Irving Fisher’s territory, the land of inflation and growth expectations as only somewhat predisposed by the cross-currents and perceptions of those front-end conditions.
When there are times the Treasury curve really does act like two Treasury curves, the boundary falls somewhere in that 5-year to 10-year No Man’s Land (this is why, of all the curve’s calendar spreads, I always start with the 5s10s because it crosses this border and sends us absolutely clear and powerful signals about this front vs. back relationship).
What was happening throughout 2018 was the yield curve splitting in two. On the one side, up front, the Fed and its federal funds target along with the various reserve programs (RRP, IOER) offering money alternatives via that set of policies. According to Janet Yellen then Jay Powell’s FOMC, they believed like all the media articles above the country was about to get itself into inflationary trouble.
It was becoming too good, they reasoned.
To head off that “danger”, rate hikes (as well as QT, but that’s a somewhat related tangent not necessary to go over today). For the Treasury curve, it would mean upward nominal pressure from below, from the shortest run. 
While all that was taking place in the short curve, the long end outright resisted the pressure even as yields here moved up, too. That was the back end squeeze, or flattening, competing narratives being played out in the whole curve’s shape. The overall shape flattened even as rates front to back rose because, Irving Fisher, growth and inflation expectations beyond any temporary short run Fed influence were not matching up with the Fed’s projections for those rate hikes.
This is where all those dollar shortage factors I cited at the outset had come into play. The more 2018 passed, the more doubts about longer run inflation and growth grew as signals of deflationary potential continued to come one after another. However, the process of sorting those competing probabilities took time; it was only over much time that the spectrum of possibilities began to more completely favor the long end’s pessimism.
This had meant up to October and early November 2018, the yield curve would rise in nominal level while at the same time flattening dramatically. The future before that point was still undecided as to which curve, front or back, would win out.
Right here is where the landmine comes into it, thus why I place so much emphasis on it. Time after time, the landmine has proved to be the moment when these conflicting viewpoints get settled. To date, they’ve always been settled to the long end’s doubts (which simply means long end doubts about deflationary risk and potential become just deflation).
After that point, the whole thing is united once again as it collapses even up in the front (December 2018’s inversion).

While everyone was told to focus exclusively on the highest-in-seven-years nominal 10s UST back in October and November 2018, that hadn’t actually meant anything useful or relevant; instead, the flat shape of the curve should’ve been everyone’s focus as it was those doubts even as interest rates rose and Powell’s hawks went unchallenged everywhere outside the yield curves second (back) half.
And they quickly melted away by the middle of November 2018 to leave everyone stunned; the bond “bull” very much alive and wreaking havoc yet again in Jay Powell’s expensive China shop, shelves overloaded with expensive media hot takes easily kicked over and trampled into forgettable dust.
You have probably heard that today, January 7, December’s Payroll Friday, the UST 10s closed up trading at 1.76%, the highest yield in nearly two years!! The media is again ablaze with BOND ROUT!!!!!, the new high being heralded as the latest definitive sign of the bond market giving up and coming around to the inflation-red-hot-economy Jay Powell’s FOMC is once again using to justify its hawkishness.
Like 2018, however, the yield curve has become similarly split and for all the same reasons. Over the past few weeks, the front end (out to the 5s) has been influenced by first the hawkish resolve (lots of rate hikes are coming!) before more recently having judged the omicron scare as little more than overkill. 

Powell has previously emphasized how the pandemic would be the one factor which could derail his taper/rate hike plans. With omicron appearing less and less of a stumbling block, the Fed’s temporary influence has taken over the short end, the road clear for rate hike liftoff maybe even by March.
This has similarly extended into the long end in that same 2018 way, to the point today the 10-year yield traded higher than its March 2021 peak. Upward pressure from underneath as the Treasury market doesn’t see anything right now, nothing tangible or immediate which over the short run might have a high probability of stopping the FOMC.
This despite again all those dollar shortage warning signs as stated in the opening paragraph. The flat curve, however, shows that those are still being taken seriously even as LT rates trend moderately higher.
Powell’s economic optimism, if you want to call it that since much of it derives from the unemployment rate and wage data, has been traded more forthrightly into the front with omicron fears fading. This translates into these modestly higher nominal levels but not a steeper shape.
It leaves us once more with these conflicting views meeting somewhere in the middle.
With no 2021 or yet 2022 landmine, the yield curve is actually two curves again waiting for this clash or conflict of interest rates (thanks Mr. Tateo for suggesting this title) to be settled one way or the other. Balance of probabilities in the front are more favorable, yet still so much unappreciated negative potential keeps a lid on it at the back.
There are other parts of the bond market equation to consider, as there had been three years ago, but I’ll save the similar move in TIPS real yields for next week. The eurodollar futures curve, still kinked but now un-inverted, I’ll also leave as a cliffhanger, too.
International
Bolsonaro Indicted By Brazilian Police For Falsifying Covid-19 Vaccine Records
Bolsonaro Indicted By Brazilian Police For Falsifying Covid-19 Vaccine Records
Federal police in Brazil have indicted former President Jair…
Share this:

Federal police in Brazil have indicted former President Jair Bolsonaro for falsifying his Covid-19 vaccine card in order to travel to the United States and elsewhere during the pandemic.
Federal prosecutors will review the indictment and decide whether to pursue the case - which would be the first time the former president has faced criminal charges.
According to the indictment, Bolsonaro ordered a top deputy to obtain falsified Covid-19 vaccine records of himself and his 13-year-old daughter in late 2022, right before he flew to Florida for a three-month stay following his election loss.
Brazilian police are also waiting to hear back from the US DOJ on whether Bolsonaro used said cards to enter the United States, which would open him up to further criminal charges, the NY Times reports.
Bolsonaro has repeatedly claimed not to have received the Covid-19 vaccine, but denies any involvement in a plan to falsify his vaccination records. A previous investigation by Brazil's comptroller general concluded that Bolsonaro's vaccination records were false.
The records show that Bolsonaro, a COVID-19 skeptic who publicly opposed the vaccine, received a dose of the immunizer in a public healthcare center in Sao Paulo in July 2021. [ZH: hilarious, Reuters calling the vaccine an 'immunizer.']
The investigation concluded, however, that the former president had left the city the previous day and didn't leave Brasilia until three days later, according to a statement.
The nurse listed in the records as having applied the vaccine on Bolsonaro denied doing so and was no longer working at the center. The listed vaccine lot was also not available on that date, the comptroller general's office said. -Reuters
"It's a selective investigation. I'm calm, I don't owe anything," Bolsonaro told Reuters. "The world knows that I didn't take the vaccine."
During the pandemic, Bolsonaro panned the vaccine - and instead insisted on alternative treatments such as Ivermectin, which has antiviral properties against Covid-19. For this, he was investigated by Brazil's congress, which recommended that the former president be charged with "crimes against humanity," among other things, for his actions during the pandemic.
In May, Brazilian police raided Bolsonaro's home, confiscating his cell phone and arresting one of his closest aides and two of his security cards in connection to the vaccine record investigation.
Brazil's electoral court ruled that Bolsonaro can't run for public office until 2030 after he suggested that the country's voting system was rigged. For that, he has to sit out the 2026 election.
International
This gambling tech stock is future-proofing the world’s casinos
Supported by the universal thrill of a quick payout and the need for leisure, gambling stocks make a compelling case for long-term returns.
The post This…
Share this:


Supported by the universal human thrill of a quick payout, and the need for leisure and entertainment to bring enjoyment to adult life, casinos will remain essential spaces for people to dream and play for the foreseeable future, making gambling stocks a prospective space to look for long-term returns.
According to Research and Markets, the global casino industry was valued at US$157.5 billion in 2022, and it will grow to US$224.1 billion by 2030 at a compound annual growth rate of 4.5 per cent. This trend includes:
Approximately 100 million gamblers in the United States, who generated US$66.5 billion in revenue in 2023, a 10 per cent gain from 2022, which itself was a record year A little fewer than 20 million gamblers in Canada, who generated about C$15 billion in revenue in 2023 A global addressable market of thousands of casinos, and more than 4.2 billion people who gamble at least once every year, according to a 2016 study by Casino.orgThe main challenge with attracting these billions through casino doors is they sway heavily toward middle age. The mean age of U.S. casino visitors has hovered around 50 for the past decade, with a similar trend across the world, forcing casinos to attract younger, tech-savvy customers, many with less gambling experience, to continue growing profits for their stakeholders over the long term.
Investors seeking exposure to a leadership position in building the bridge between casinos and the next generation of gamblers should evaluate Jackpot Digital (TSXV:JJ). The Vancouver-based company is a manufacturer of dealerless electronic table games that deliver immersive experiences tailored to the digital age, while earning casinos attractive returns on investment.
The gambling technology stock benefits from no direct competition in the dealerless poker space, with orders spanning North America, Europe, Asia, Africa and the Caribbean, a long-established presence with major cruise ship brands, such as Carnival, Princess Cruises and Holland America, and a growing land-based presence with orders or ongoing installations across 12 U.S. states. Its highlight partnership to date is a master services agreement with Penn Entertainment, the country’s largest regional gaming operator with 43 properties across 20 states.
Jackpot Digital’s differentiated technology and well-rounded management team are at the heart of its success in landing several blue-chip casino gaming companies as customers.
Jackpot BlitzThe gambling technology stock’s flagship product, Jackpot Blitz, is a dealerless poker table featuring three of the world’s most popular variations – Texas Hold’ em, Omaha, and Five-Card-Omaha – brought to life through slick 4k graphics on a 75-inch touchscreen, and offered in three formats – pot-limit, no-limit and fixed-limit – designed to attract a diversity of revenue from casual to experienced players.
Spokesperson and NFL championship-winning coach Jimmy Johnson explains the benefits of the Jackpot Blitz. Source: Jackpot Digital.The table also comes equipped with house-banked mini-games, including blackjack, baccarat and video poker, as well as side bets on the main poker game, such as Bet the Flop, all of which keep players engaged and entertained between, and even during, poker hands. The stunning Jackpot Blitz machine also offers multi-venue “Bad Beat” jackpot functionality, allowing casinos to offer a “Poker Powerball” with massive Jackpots, further enhancing the attractiveness of Jackpot Blitz to new players.
It’s by striking a balance between the needs of the modern gambler, and efficiency and profitability that in-person operators couldn’t hope to match – unless they ordered the machine for themselves – that Jackpot Digital has earned itself the top spot in dealerless poker.
Player benefitsWhen a veteran or novice gambler takes a seat at the Jackpot Blitz, his or her experience begins with an easy-to-use interface, laid out in a modern and stylish design, programmed to respond to hand gestures that bring real casino play into the digital age, including card bending and chip jingling.
Source: Jackpot Digital.The table’s intuitive controls, combined with instant payouts and its dealerless nature, translate into faster game play, which maximizes playing time and player excitement, while minimizing human error and the intimidation new gamblers might feel about approaching an analog poker table. The gambling technology stock’s in-house development team is also constantly working on new games to keep content fresh, with a special focus on bringing international games and regional versions of poker to casino audiences in Asia, South America and the Indian subcontinent.
As hands are laid down and pots pile up, players can also track game stats in real time, which inform future strategy and enhance the thrill of the moment with an added element of competition.
Operator benefitsFrom an operator’s perspective, a floor of automated gaming tables can meaningfully and instantly reduce casino staff expenditures and management pain points, while avoiding wage inflation, labour shortages and supply costs.
The Blitz is no slouch on revenue either, dealing more hands per hour, resulting in higher revenue and higher profitability, which is further enhanced by onboard side bets and mini-games that can be played while players are engaged in a poker hand.
The Jackpot Blitz’s economics are attractive to operators thanks to its ability to accommodate non-stop play, while monetizing downtime through side games and bets. While a human dealer must spend time shuffling, interacting with players, and consulting with colleagues, the Jackpot Blitz can accept wagers 100 per cent of the time, making sure gamblers get the action they came for and operators see a return on their investment.
 Source: Jackpot Digital.
Beyond gaming revenue, casinos are further incentivized to onboard the Jackpot Blitz because of its fully customizable advertising functions, including logos, card backs, chips and felt colors, all of which bolster casino culture and enable the pursuit of revenue from third-party advertising partners.
The Blitz ties its value proposition together by generating automatic reports – including demographics and consumer behaviour through a rewards card system – and plugging directly into most back-end management systems, saving casinos the hassle of manual tracking, while also minimizing tampering, money-laundering and theft through the use of isolated servers.
Whether it’s streamlining the player experience or putting automation at the service of operators’ bottom lines, Jackpot Digital’s flagship product is positioned to create value, and plenty of it.
Jackpot Digital’s path to profitabilityAfter existing as an exclusively cruise-ship-based operation since 2015, Jackpot Digital suffered a steep decline in revenue during the COVID pandemic, falling from C$2.18 million in 2019 to C$0.42 million in 2021.
Management quickly pivoted in the face of uncertainty, redesigning the Blitz to execute on a land-based expansion strategy – backed by Gaming Labs International certification in fall 2023 – which is bringing about a successful turnaround after the re-emergence of the casino business. Revenue more than tripled to C$1.43 million in 2022, and reached C$1.57 million through three quarters of 2023, with the company expecting to ramp up significant recurring revenue after it installs several dozen machines currently in its backlog.
 The Jackpot Blitz electronic gaming table in action. Source: Jackpot Digital.
The first installation of land-ready Jackpot Blitz machines is now completed at the Jackson Rancheria Casino in California, as the company announced today. The three-machine installation marks a new era of growth for the company, having announced 25 Blitz deals since November 2021 (slide 12), with many more across Canada and the United States in the works, in addition to a strong pipeline in Asia and Europe.
“Jackpot Digital could be a profitable company right now if it only focused on care and maintenance of the revenues it currently generates. But that’s not why we’re here,” Mathieu McDonald, Vice President of Corporate Development at Jackpot Digital, said in a recent interview with Stockhouse. “We intend to scale up to many multiples of the tables we have out right now, with the potential for up to 2,000 tables over the next three to five years.”
According to McDonald, the company is fielding three to five inquiries per week about the Blitz from casinos around the world that recognize the machines’ first-mover advantage in dealerless poker and potential expansion into other games in need of automation.
Jackpot Digital’s ambitious plan of action is supported by a management team of proven gambling, finance, advertising and legal professionals, many of which have been serving Jackpot stakeholders for more than two decades.
A long-tenured management teamThe management team behind Jackpot Digital is led by Jake Kalpakian, who has served as president and chief executive officer since 1999, including under the gambling technology stock’s former incarnation as Las Vegas From Home.com Entertainment Inc. Kalpakian brings more than 30 years of experience managing small-cap publicly listed companies, granting him a steady hand when it comes to maneuvering through the volatility of the economic cycle.
Kalpakian’s efforts are supported by three directors whose well-rounded expertise positions Jackpot Digital for long-term sustainable growth:
Gregory T. McFarlane, a director at Jackpot Digital since 1999, previously ran an independent advertising firm and holds a degree in mathematics from the University of Toronto. McFarlane is also a co-founder of the popular Control Your Cash personal finance website. Chief financial officer Neil Spellman, a director at the company since 2002, boasts an almost two-decade track record as vice president at Wall Street firm Smith Barney, where he developed a multi-industry understanding of the journey to profitability. Finally, Alan Artunian, a director since 2017, currently serves as CEO of Nice Guy Holdings, a corporate and legal consulting company advising clients across a diversity of sectors.Guided by a strategic management team, and benefiting from a macro-trend toward casino automation, Jackpot Digital is on course to ride a wave of millions of gamblers looking for an elegant, tech-informed alternative to traditional in-person play.
A multi-bagger opportunityThe Jackpot Digital opportunity sets up savvy investors who recognize the soundness of the company’s value proposition. The tremendous risk/reward value of Jackpot Digital gives investors the opportunity to ride the macro-trend toward casino automation, as deals for the Blitz keep pouring in, the company adds games to its portfolio, and the global casino industry adds hundreds of billions in revenue through this decade.
Join the discussion: Find out what everybody’s saying about this gambling technology stock on the Jackpot Digital Bullboard.
This is sponsored content issued on behalf of Jackpot Digital, please see full disclaimer here.
The post This gambling tech stock is future-proofing the world’s casinos appeared first on The Market Online Canada.
stocks pandemic small-cap africa south america canada europeInternational
Gates-backed PhIII study tuberculosis vaccine study gets underway
A large study of an experimental vaccine for the world’s biggest infectious disease has finally kicked off in South Africa.
The Bill & Melinda Gates…
Share this:


A large study of an experimental vaccine for the world’s biggest infectious disease has finally kicked off in South Africa.
The Bill & Melinda Gates Medical Research Institute (MRI) will test a tuberculosis vaccine’s ability to prevent latent infections from causing potentially deadly lung disease. Last summer the nonprofit said it would foot $400 million of the estimated $550 million cost of running the 20,000-person Phase III trial.
It’s a pivotal moment for a vaccine whose origins date back 25 years when scientists identified two proteins that triggered strong immunity to the bacterium that causes tuberculosis. A fusion of those proteins, paired with the tree bark-derived adjuvant that helps power GSK’s shingles shot, comprise the so-called M72 vaccine.
After decades of failures in the field, the vaccine impressed scientists in 2018 when GSK found that it was 54% efficacious at preventing lung disease in a 3,600-person Phase IIb study.
But the Big Pharma decided that a full-blown trial was too expensive to conduct on its own. Gates MRI stepped in to license the vaccine in early 2020, right before the Covid pandemic shifted global vaccine priorities towards the coronavirus, further stalling the tuberculosis shot.
“There’s been frustration that it’s taken so long to get this trial up and running,” Thomas Scriba, deputy director of immunology for the South African Tuberculosis Vaccine Initiative, told Endpoints News last summer.
At last, the vaccine is getting a chance to prove itself in a bigger study. If successful, it could lead to the first new shot for tuberculosis in over a century.
Emilio Emini, CEO of the Gates MRI, told Endpoints that the initial results may come in roughly four to six years. “Hopefully this will galvanize a refocus on TB,” he said. “It’s been ignored for many, many years. We can’t ignore it anymore.”
A substantial impact
Even though an existing vaccine helps protect babies and children against severe tuberculosis, the bacterium responsible for the disease still causes roughly 10 million new cases and 500,000 deaths each year.
 Emilio Emini
By vaccinating adolescents and adults who test positive for infections but don’t have symptoms of lung disease, the Gates MRI hopes the shot will help prevent mild infections from becoming severe ones, curtail transmission of the bug, which is predominantly driven by people with lung disease, and reduce deaths.
“The impact would be substantial,” Emini said. But he cautioned that the biology behind mild and severe diseases is still mysterious. “The reality is that no one really knows what keeps it under control.”
The study, which will take place at 60 sites across seven countries, will include some people who are not infected with tuberculosis to ensure that the vaccine is safe in that broader population.
“Having to pre-test everybody is not going to make the vaccine easy to deliver,” Emini said. If the vaccine is ultimately approved, it will likely be used in targeted communities with high tuberculosis, rather than across a whole country, he added. “In practice, you would immunize everybody in those populations.”
Emini described the Gates MRI’s rights to the vaccine as “close to a worldwide license.” GSK retained rights to commercialize the vaccine in certain countries but declined to specify which ones.
A spokesperson for GSK said that the company “has around 30 assets under development specifically for global health … none of which are expected to generate significant return on investment.”
“It is not sustainable or practical in the longer term for GSK to deliver all of these alone. So we continue to work on M72, but in partnership with others,” the spokesperson added.
If the shot works, Emini said that the Gates MRI will sublicense it to a manufacturer that will be responsible for making and marketing the vaccine. The details are still being worked out, he noted.
vaccine pandemic coronavirus deaths new cases transmission africa

Google’s A.I. Fiasco Exposes Deeper Infowarp


Home buyers must now navigate higher mortgage rates and prices


Greenback Surges after BOJ Hikes and Ends YCC and RBA Delivers a Dovish Hold


Bolsonaro Indicted By Brazilian Police For Falsifying Covid-19 Vaccine Records


You can strike gold and silver investment opportunities at Costco


Germany Is Running Out Of Money And Debt Levels Are Exploding, Finance Minister Warns


TikTok Ban Obscures Chinese Stock Gold Rush


Report Criticizes ‘Catastrophic Errors’ Of COVID Lockdowns, Warns Of Repeat


Gates-backed PhIII study tuberculosis vaccine study gets underway


Anti-Semitism As The Harbinger Of Global Chaos
-

 Spread & Containment7 days ago
IFM’s Hat Trick and Reflections On Option-To-Buy M&A
-

 Uncategorized4 weeks ago
All Of The Elements Are In Place For An Economic Crisis Of Staggering Proportions
-

 International2 weeks ago
EyePoint poaches medical chief from Apellis; Sandoz CFO, longtime BioNTech exec to retire
-

 Uncategorized1 month ago
California Counties Could Be Forced To Pay $300 Million To Cover COVID-Era Program
-

 Uncategorized4 weeks ago
Apparel Retailer Express Moving Toward Bankruptcy
-

 Uncategorized1 month ago
Industrial Production Decreased 0.1% in January
-

 International2 weeks ago
Walmart launches clever answer to Target’s new membership program
-

 Uncategorized1 month ago
RFK Jr: The Wuhan Cover-Up & The Rise Of The Biowarfare-Industrial Complex