California home sales tick higher in March as statewide median price sets another all-time high, C.A.R. reports
California home sales tick higher in March as statewide median price sets another all-time high, C.A.R. reports
PR Newswire
LOS ANGELES, April 19, 2022
– Existing, single-family home sales totaled 426,970 in March on a seasonally adjusted annualiz…
Share this:

California home sales tick higher in March as statewide median price sets another all-time high, C.A.R. reports
PR Newswire
LOS ANGELES, April 19, 2022
- Existing, single-family home sales totaled 426,970 in March on a seasonally adjusted annualized rate, up 0.5 percent from February and down 4.4 percent from March 2021.
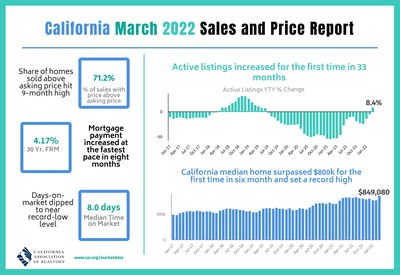
- March's statewide median home price was $849,080, up 10.1 percent from February and up 11.9 percent from March 2021.
- Year-to-date statewide home sales were down 7.0 percent in March.
LOS ANGELES, April 19, 2022 /PRNewswire/ -- Housing demand in California remained strong in March as the effects of rising interest rates have yet to be borne out while the statewide median home price sets another record high, primarily due to a surge in sales of higher priced homes, the CALIFORNIA ASSOCIATION OF REALTORS® (C.A.R.) said today.
Infographic: https://www.car.org/Global/Infographics/2022-03-Sales-and-Price
Closed escrow sales of existing, single-family detached homes in California totaled a seasonally adjusted annualized rate of 426,970 in March, according to information collected by C.A.R. from more than 90 local REALTOR® associations and MLSs statewide. The statewide annualized sales figure represents what would be the total number of homes sold during 2022 if sales maintained the March pace throughout the year. It is adjusted to account for seasonal factors that typically influence home sales.
March's sales pace ticked up 0.5 percent on a monthly basis from 424,640 in February and was down 4.4 percent from a year ago, when 446,410 homes were sold on an annualized basis. The year-over-year sales decrease was the ninth straight decline and the smallest in eight months.
"With homes still selling at a rapid clip and more homes selling above asking price than last summer when prices were at record highs, California's housing market continues to perform remarkably well as buyers enter the market to get ahead of rising mortgage interest rates," said C.A.R. President Otto Catrina, a Bay Area real estate broker and REALTOR®. "An increase in active listings for the first time since prior to the pandemic should give consumers more options and alleviate some of the upward pressure on home prices, which bodes well for prospective buyers."
California's median home price reached a new record high in March at $849,080 — surpassing the previous record of $827,940 set in August 2021 and rising above the $800,000 benchmark for the first time in six months. The March price was 11.9 percent higher than the $758,990 recorded last March. The month-to-month percent change in median price was the highest pace since March 2013, and the 10.1 percent increase from February was the first time in nine years that the monthly price increase was in the double-digits.
A surge in sales at the top end of the market was the primary factor for the jump in the statewide median price at the end of the first quarter. The share of million-dollar home sales increased for the second consecutive month, surging to 32.9 percent in March, the highest level on record. Additionally, strong month-to-month sales growth in the San Francisco Bay Area contributed to the jump in sales of million-dollar homes statewide, as 70 percent of the region's sales were priced above $1 million, and sales in the region increased 70.5 percent from February.
"March sales data continues to suggest strong buying interest and a solid housing market, as the effects of higher mortgage interest rates won't be realized for a few more months," said C.A.R. Vice President and Chief Economist Jordan Levine. "With the Federal Reserve expected to announce two back-to-back half-point interest rate hikes in May and June to combat inflation, interest rates will be elevated for the foreseeable future, adversely affecting housing demand and lowering housing affordability in the coming months, but the effects may not be visible until the second half of the year as many of the homes that are, or will be, closing were negotiated before the sharp increase in rates."
Other key points from C.A.R.'s March 2022 resale housing report include:
- At the regional level, home sales in all major California regions, except the Central Valley recorded sales decreases on a year-over-year basis. The Central Coast region recorded the sharpest sales decline of all regions again, dropping 20.1 percent from a year ago. Housing demand in the Central Coast region was exceptionally strong last year though with sales climbing 31.8 percent in March 2021, and as such, a sizable dip was anticipated. The Far North had the second largest sales decline at 7.7 percent, followed by Southern California (-7.5 percent) and the San Francisco Bay Area (-2.7 percent). Sales in the Central Valley increased for the second straight month with a year-over-year increase of 2.8 percent.
- Nearly two-thirds (62.7 percent) of all counties tracked by C.A.R. experienced a decline in existing home sales from a year ago, compared to 72.5 percent the prior month. Thirteen counties in the state posted a sales drop of more than 10 percent from a year ago, with Plumas falling the most at 40.5 percent, followed by Glenn (-37.0 percent) and Tehama (-35.8 percent). Counties that experienced a sales drop from last year had an average decrease of -12.5 percent in March. The number of counties with a year-over-year sales increase improved from 14 in February to 19 in March, with Mono (88.9 percent) surging the most from a year ago, followed by Yuba (52.9 percent) and Mariposa (43.8 percent).
- At the regional level, home prices in all major California regions continued to surge from last year by double-digits, with four of them reaching a new record high in March. The Central Coast region recorded the highest year-over-year price growth with a 20.4 percent increase, followed by the Central Valley (19.3 percent), the San Francisco Bay Area (17.9 percent), Southern California (13.8 percent), and the Far North (12.9 percent). The Far North was the only region that did not set a new median high in March.
- At the county level, home prices continued to increase across the state, with 25 counties setting new record highs in March. Forty-six out of fifty-one counties tracked by C.A.R. experienced increases in their median prices in March, with 38 of them rising more than 10 percent from a year ago. Santa Cruz continued to post the biggest year-over-year price gain at 45.5 percent, followed by Tehama (34.4 percent) and Tuolumne (31.0 percent). Five counties recorded a decline from last year, with Mono dropping the most at -35.3 percent, followed by Lassen (-3.6 percent) and Monterey (-2.1 percent).
- Housing supply conditions in California appear to be turning the corner as the Unsold Inventory Index (UII) was unchanged from a year ago at 1.7 months in March, marking the first time in nearly two years that the index did not decline on a year-over-year basis. The index indicates the number of months it would take to sell the supply of homes on the market at the current rate of sales.
- Active listings in March climbed to the highest level in five months and posted the first year-over-year gain since June 2019. Newly added listings in March also increased for the first time in nine months, reaching the highest level since August 2021. The month-to-month increase of 37.7 percent in newly added listings was also the highest since May 2020.
- The median number of days it took to sell a California single-family home was 8 days in March and 8 days in March 2021.
- C.A.R.'s statewide sales-price-to-list-price ratio* was 103.9 percent in March 2022 and 102.2 percent in March 2021.
- The statewide average price per square foot** for an existing single-family home rose above the $400 for the first time. March's price per square foot was $418, up from $357 in March a year ago.
- The 30-year, fixed-mortgage interest rate averaged 4.17 percent in March, up from 3.08 percent in March 2021, according to Freddie Mac. The five-year, adjustable mortgage interest rate averaged 3.19 percent, compared to 2.78 percent in March 2021.
Note: The County MLS median price and sales data in the tables are generated from a survey of more than 90 associations of REALTORS® throughout the state and represent statistics of existing single-family detached homes only. County sales data are not adjusted to account for seasonal factors that can influence home sales. Movements in sales prices should not be interpreted as changes in the cost of a standard home. The median price is where half sold for more and half sold for less; medians are more typical than average prices, which are skewed by a relatively small share of transactions at either the lower end or the upper end. Median prices can be influenced by changes in cost, as well as changes in the characteristics and the size of homes sold. The change in median prices should not be construed as actual price changes in specific homes.
*Sales-to-list-price ratio is an indicator that reflects the negotiation power of home buyers and home sellers under current market conditions. The ratio is calculated by dividing the final sales price of a property by its last list price and is expressed as a percentage. A sales-to-list ratio with 100 percent or above suggests that the property sold for more than the list price, and a ratio below 100 percent indicates that the price sold below the asking price.
**Price per square foot is a measure commonly used by real estate agents and brokers to determine how much a square foot of space a buyer will pay for a property. It is calculated as the sale price of the home divided by the number of finished square feet. C.A.R. currently tracks price-per-square foot statistics for 50 counties.
Leading the way…® in California real estate for more than 110 years, the CALIFORNIA ASSOCIATION OF REALTORS® (www.car.org) is one of the largest state trade organizations in the United States with more than 217,000 members dedicated to the advancement of professionalism in real estate. C.A.R. is headquartered in Los Angeles.
March 2022 County Sales and Price Activity | ||||||||||
(Regional and condo sales data not seasonally adjusted) | ||||||||||
March 2022 | Median Sold Price of Existing Single-Family Homes | Sales | ||||||||
State/Region/County | March 2022 | Feb. 2022 | March 2021 | Price | Price | Sales | Sales | |||
Calif. Single-family homes | $849,080 | $771,270 | $758,990 | 10.1% | 11.9% | 0.5% | -4.4% | |||
Calif. Condo/Townhomes | $661,000 | $640,000 | $552,500 | 3.3% | 19.6% | 41.8% | -11.4% | |||
Los Angeles Metro Area | $770,000 | $725,000 | $680,000 | 6.2% | 13.2% | 39.4% | -8.7% | |||
Central Coast | $1,050,000 | $912,250 | $871,840 | 15.1% | 20.4% | 29.1% | -20.1% | |||
Central Valley | $495,000 | $465,000 | $415,000 | 6.5% | 19.3% | 35.8% | 2.8% | |||
Far North | $395,000 | $375,000 | $350,000 | 5.3% | 12.9% | 34.4% | -7.7% | |||
Inland Empire | $580,000 | $551,000 | $495,000 | 5.3% | 17.2% | 35.0% | -8.2% | |||
San Francisco Bay Area | $1,444,720 | $1,335,000 | $1,225,000 | 8.2% | 17.9% | 70.5% | -2.7% | |||
Southern California | $802,500 | $760,000 | $705,000 | 5.6% | 13.8% | 38.3% | -7.5% | |||
San Francisco Bay Area | ||||||||||
Alameda | $1,430,000 | $1,350,000 | $1,163,000 | 5.9% | 23.0% | 64.8% | -1.1% | |||
Contra Costa | $965,900 | $935,000 | $920,000 | 3.3% | 5.0% | 90.5% | 2.0% | |||
Marin | $1,737,500 | $1,580,000 | $1,627,500 | 10.0% | 6.8% | 54.4% | -18.7% | |||
Napa | $998,000 | $1,034,500 | $929,000 | -3.5% | 7.4% | 53.2% | -4.0% | |||
San Francisco | $2,060,000 | $1,900,000 | $1,755,000 | 8.4% | 17.4% | 69.9% | -0.8% | |||
San Mateo | $2,280,000 | $2,100,000 | $1,985,000 | 8.6% | 14.9% | 90.9% | -1.9% | |||
Santa Clara | $1,950,000 | $1,820,000 | $1,600,000 | 7.1% | 21.9% | 79.6% | -2.0% | |||
Solano | $604,000 | $605,000 | $549,000 | -0.2% | 10.0% | 27.7% | -13.7% | |||
Sonoma | $833,750 | $819,000 | $765,000 | 1.8% | 9.0% | 51.8% | -6.7% | |||
Southern California | ||||||||||
Los Angeles | $781,050 | $773,490 | $689,440 | r | 1.0% | 13.3% | 36.3% | -5.8% | ||
Orange | $1,305,000 | $1,260,000 | $1,025,000 | 3.6% | 27.3% | 51.9% | -19.4% | |||
Riverside | $620,000 | $605,030 | $535,000 | 2.5% | 15.9% | 40.5% | -9.5% | |||
San Bernardino | $475,000 | $450,000 | $412,000 | 5.6% | 15.3% | 25.8% | -5.7% | |||
San Diego | $950,000 | $888,000 | $800,000 | 7.0% | 18.8% | 34.0% | -2.2% | |||
Ventura | $914,000 | $887,500 | $770,750 | 3.0% | 18.6% | 64.2% | 6.2% | |||
Central Coast | ||||||||||
Monterey | $911,000 | $885,000 | $931,000 | 2.9% | -2.1% | 35.9% | -6.2% | |||
San Luis Obispo | $903,000 | $830,500 | $737,500 | 8.7% | 22.4% | 15.6% | -33.8% | |||
Santa Barbara | $1,300,000 | $1,050,000 | $1,075,000 | 23.8% | 20.9% | 26.8% | -22.5% | |||
Santa Cruz | $1,600,000 | $1,380,000 | $1,100,000 | 15.9% | 45.5% | 48.4% | -7.4% | |||
Central Valley | ||||||||||
Fresno | $415,000 | $405,000 | $350,000 | 2.5% | 18.6% | 30.4% | 6.3% | |||
Glenn | $320,000 | $412,500 | $325,000 | -22.4% | -1.5% | -15.0% | -37.0% | |||
Kern | $369,750 | $370,000 | $310,000 | -0.1% | 19.3% | 35.3% | -7.6% | |||
Kings | $325,000 | $327,000 | $292,500 | -0.6% | 11.1% | 47.4% | -9.7% | |||
Madera | $430,000 | $400,000 | $365,000 | 7.5% | 17.8% | 44.1% | 19.6% | |||
Merced | $385,000 | $390,000 | $318,000 | -1.3% | 21.1% | 66.2% | -16.9% | |||
Placer | $701,730 | $675,000 | $610,000 | 4.0% | 15.0% | 47.3% | -2.9% | |||
Sacramento | $560,000 | $541,500 | $485,000 | 3.4% | 15.5% | 28.3% | 4.9% | |||
San Benito | $835,000 | $860,000 | $765,000 | -2.9% | 9.2% | 21.6% | -15.1% | |||
San Joaquin | $550,000 | $505,500 | $457,750 | 8.8% | 20.2% | 42.6% | 10.4% | |||
Stanislaus | $470,500 | $452,400 | $407,500 | 4.0% | 15.5% | 50.2% | 9.5% | |||
Tulare | $360,980 | $338,000 | $306,650 | 6.8% | 17.7% | 25.7% | 8.2% | |||
Far North | ||||||||||
Butte | $465,000 | $426,500 | $406,000 | 9.0% | 14.5% | 20.5% | -8.2% | |||
Lassen | $243,000 | $239,000 | $252,000 | 1.7% | -3.6% | 34.8% | -3.1% | |||
Plumas | $391,500 | $339,000 | $385,000 | 15.5% | 1.7% | 100.0% | -40.5% | |||
Shasta | $390,000 | $375,000 | $345,000 | 4.0% | 13.0% | 45.6% | -1.0% | |||
Siskiyou | $308,000 | $340,000 | $259,500 | -9.4% | 18.7% | 34.3% | 6.8% | |||
Tehama | $401,880 | $311,250 | $299,000 | 29.1% | 34.4% | -5.6% | -35.8% | |||
Other Calif. Counties | ||||||||||
Amador | $440,000 | $449,000 | $430,000 | -2.0% | 2.3% | 34.3% | -31.9% | |||
Calaveras | $492,000 | $510,000 | $435,850 | -3.5% | 12.9% | 23.4% | 4.4% | |||
Del Norte | $398,000 | $390,000 | $309,000 | 2.1% | 28.8% | 114.3% | 3.4% | |||
El Dorado | $750,000 | $730,000 | $652,500 | 2.7% | 14.9% | 36.0% | -14.6% | |||
Humboldt | $430,000 | $452,500 | $359,000 | -5.0% | 19.8% | 71.2% | 11.9% | |||
Lake | $370,000 | $360,000 | $333,000 | 2.8% | 11.1% | 50.8% | 26.0% | |||
Mariposa | $530,000 | $446,250 | $421,360 | 18.8% | 25.8% | 91.7% | 43.8% | |||
Mendocino | $506,000 | $500,000 | $510,000 | 1.2% | -0.8% | 51.5% | -3.8% | |||
Mono | $1,100,000 | $992,500 | $1,700,000 | 10.8% | -35.3% | 70.0% | 88.9% | |||
Nevada | $559,000 | $547,500 | $530,000 | 2.1% | 5.5% | 67.9% | 2.9% | |||
Sutter | $460,000 | $420,000 | $364,250 | 9.5% | 26.3% | 27.4% | 31.7% | |||
Tuolumne | $450,000 | $433,500 | $343,600 | 3.8% | 31.0% | 33.3% | 7.9% | |||
Yolo | $657,000 | $666,420 | $530,000 | -1.4% | 24.0% | 32.6% | -10.9% | |||
Yuba | $432,500 | $450,000 | $359,500 | -3.9% | 20.3% | 28.4% | 52.9% | |||
r = revised | ||||||||||
March 2022 County Unsold Inventory and Days on Market | ||||||||||
(Regional and condo sales data not seasonally adjusted) | ||||||||||
March 2022 | Unsold Inventory Index | Median Time on Market | ||||||||
State/Region/County | March 2022 | Feb. 2022 | March 2021 | March 2022 | Feb. 2022 | March 2021 | ||||
Calif. Single-family homes | 1.7 | 2.0 | 1.7 | 8.0 | 9.0 | 8.0 | ||||
Calif. Condo/Townhomes | 1.4 | 1.8 | 1.6 | 7.0 | 8.0 | 10.0 | ||||
Los Angeles Metro Area | 1.7 | 2.1 | 1.7 | 9.0 | 10.0 | 8.0 | ||||
Central Coast | 1.8 | 2.0 | 1.8 | 8.0 | 10.0 | 9.0 | ||||
Central Valley | 1.6 | 1.9 | 1.7 | 7.0 | 7.0 | 6.0 | ||||
Far North | 2.6 | 3.0 | 2.2 | 14.0 | 22.0 | 23.0 | ||||
Inland Empire | 1.6 | 2.0 | 1.6 | 10.0 | 14.0 | 10.0 | ||||
San Francisco Bay Area | 1.4 | 1.9 | 1.6 | 8.0 | 9.0 | 9.0 | ||||
Southern California | 1.6 | 2.0 | 1.7 | 8.0 | 9.0 | 8.0 | ||||
San Francisco Bay Area | ||||||||||
Alameda | 1.4 | 1.7 | 1.4 | 8.0 | 8.0 | 8.0 | ||||
Contra Costa | 1.2 | 1.9 | 1.3 | 7.0 | 8.0 | 7.0 | ||||
Marin | 1.5 | 1.6 | 1.5 | 9.0 | 10.0 | 16.5 | ||||
Napa | 2.5 | 3.1 | 2.7 | 27.0 | 30.0 | 42.0 | ||||
San Francisco | 1.6 | 2.4 | 1.7 | 12.0 | 12.0 | 11.0 | ||||
San Mateo | 1.4 | 2.1 | 1.9 | 7.0 | 7.0 | 8.0 | ||||
Santa Clara | 1.4 | 2.0 | 1.7 | 7.0 | 7.0 | 8.0 | ||||
Solano | 1.4 | 1.4 | 1.1 | 18.0 | 24.0 | 24.0 | ||||
Sonoma | 1.7 | 2.2 | 2.3 | 23.0 | 27.0 | 32.0 | ||||
Southern California | ||||||||||
Los Angeles | 1.8 | 2.2 | 1.8 | 8.0 | 10.0 | 8.0 | ||||
Orange | 1.6 | 2.0 | 1.8 | 6.0 | 7.0 | 6.0 | ||||
Riverside | 1.5 | 1.9 | 1.5 | 11.0 | 14.0 | 10.0 | ||||
San Bernardino | 1.8 | 2.1 | 1.7 | 10.0 | 13.0 | 9.0 | ||||
San Diego | 1.4 | 1.5 | 1.5 | 7.0 | 7.0 | 6.0 | ||||
Ventura | 1.6 | 2.3 | 2.1 | 17.0 | 20.0 | 22.0 | ||||
Central Coast | ||||||||||
Monterey | 1.7 | 2.2 | 2.1 | 9.0 | 10.0 | 11.0 | ||||
San Luis Obispo | 2.1 | 2.0 | 1.8 | 6.0 | 9.0 | 8.0 | ||||
Santa Barbara | 1.5 | 1.9 | 1.5 | 8.0 | 10.0 | 8.5 | ||||
Santa Cruz | 1.8 | 2.2 | 2.1 | 9.0 | 9.0 | 11.0 | ||||
Central Valley | ||||||||||
Fresno | 1.8 | 2.0 | 1.7 | 7.0 | 7.0 | 6.0 | ||||
Glenn | 2.4 | 2.0 | 1.3 | 13.0 | 14.0 | 10.0 | ||||
Kern | 1.6 | 1.9 | 1.6 | 7.0 | 8.0 | 7.0 | ||||
Kings | 1.6 | 2.3 | 1.8 | 6.5 | 7.0 | 4.0 | ||||
Madera | 2.2 | 2.8 | 2.5 | 10.0 | 12.0 | 12.0 | ||||
Merced | 1.9 | 2.5 | 1.3 | 9.5 | 9.0 | 7.0 | ||||
Placer | 1.6 | 1.8 | 1.5 | 6.0 | 6.0 | 6.0 | ||||
Sacramento | 1.4 | 1.5 | 1.5 | 7.0 | 7.0 | 6.0 | ||||
San Benito | 2.3 | 2.4 | 2.2 | 12.0 | 19.0 | 8.0 | ||||
San Joaquin | 1.6 | 2.0 | 1.8 | 7.0 | 8.0 | 6.0 | ||||
Stanislaus | 1.5 | 1.9 | 1.6 | 7.0 | 9.0 | 6.0 | ||||
Tulare | 1.8 | 1.9 | 1.9 | 8.0 | 12.0 | 8.0 | ||||
Far North | ||||||||||
Butte | 2.1 | 2.1 | 2.1 | 8.0 | 7.0 | 7.0 | ||||
Lassen | 2.8 | 3.4 | 2.6 | 99.0 | 107.0 | 112.0 | ||||
Plumas | 5.6 | 8.7 | 4.4 | 57.5 | 124.0 | 93.0 | ||||
Shasta | 2.2 | 2.9 | 1.9 | 12.0 | 19.0 | 11.0 | ||||
Siskiyou | 3.9 | 3.9 | 2.9 | 14.5 | 66.5 | 45.5 | ||||
Tehama | 4.2 | 3.2 | 2.2 | 34.5 | 58.5 | 57.0 | ||||
Other Calif. Counties | ||||||||||
Amador | 3.1 | 3.1 | 1.9 | 9.0 | 23.0 | 21.0 | ||||
Calaveras | 2.3 | 2.5 | 2.0 | 40.0 | 66.0 | 58.0 | ||||
Del Norte | 2.7 | 5.1 | 2.6 | 88.0 | 78.0 | 97.0 | ||||
El Dorado | 2.0 | 2.3 | 1.6 | 11.0 | 14.0 | 10.0 | ||||
Humboldt | 2.9 | 4.3 | 2.6 | 9.0 | 10.0 | 9.0 | ||||
Lake | 3.5 | 4.9 | 3.8 | 38.0 | 41.0 | 19.0 | ||||
Mariposa | 3.6 | 6.4 | 4.1 | 11.5 | 10.5 | 56.0 | ||||
Mendocino | 5.5 | 6.5 | 3.2 | 56.0 | 45.0 | 39.5 | ||||
Mono | 2.3 | 3.7 | 5.1 | 64.0 | 89.5 | 47.0 | ||||
Nevada | 2.5 | 3.2 | 2.2 | 9.0 | 20.5 | 13.0 | ||||
Sutter | 1.6 | 1.7 | 1.4 | 8.0 | 10.0 | 7.0 | ||||
Tuolumne | 2.5 | 2.9 | 2.7 | 16.5 | 40.0 | 21.0 | ||||
Yolo | 1.4 | 1.6 | 1.5 | 7.0 | 9.0 | 7.0 | ||||
Yuba | 2.0 | 1.9 | 1.4 | 7.0 | 8.0 | 8.0 | ||||
r = revised | ||||||||||
")
View original content to download multimedia:https://www.prnewswire.com/news-releases/california-home-sales-tick-higher-in-march-as-statewide-median-price-sets-another-all-time-high-car-reports-301528137.html
SOURCE CALIFORNIA ASSOCIATION OF REALTORS® (C.A.R.)
Spread & Containment
The Coming Of The Police State In America
The Coming Of The Police State In America
Authored by Jeffrey Tucker via The Epoch Times,
The National Guard and the State Police are now…
Share this:


Authored by Jeffrey Tucker via The Epoch Times,
The National Guard and the State Police are now patrolling the New York City subway system in an attempt to do something about the explosion of crime. As part of this, there are bag checks and new surveillance of all passengers. No legislation, no debate, just an edict from the mayor.
Many citizens who rely on this system for transportation might welcome this. It’s a city of strict gun control, and no one knows for sure if they have the right to defend themselves. Merchants have been harassed and even arrested for trying to stop looting and pillaging in their own shops.
The message has been sent: Only the police can do this job. Whether they do it or not is another matter.
Things on the subway system have gotten crazy. If you know it well, you can manage to travel safely, but visitors to the city who take the wrong train at the wrong time are taking grave risks.
In actual fact, it’s guaranteed that this will only end in confiscating knives and other things that people carry in order to protect themselves while leaving the actual criminals even more free to prey on citizens.
The law-abiding will suffer and the criminals will grow more numerous. It will not end well.
When you step back from the details, what we have is the dawning of a genuine police state in the United States. It only starts in New York City. Where is the Guard going to be deployed next? Anywhere is possible.
If the crime is bad enough, citizens will welcome it. It must have been this way in most times and places that when the police state arrives, the people cheer.
We will all have our own stories of how this came to be. Some might begin with the passage of the Patriot Act and the establishment of the Department of Homeland Security in 2001. Some will focus on gun control and the taking away of citizens’ rights to defend themselves.
My own version of events is closer in time. It began four years ago this month with lockdowns. That’s what shattered the capacity of civil society to function in the United States. Everything that has happened since follows like one domino tumbling after another.
It goes like this:
1) lockdown,
2) loss of moral compass and spreading of loneliness and nihilism,
3) rioting resulting from citizen frustration, 4) police absent because of ideological hectoring,
5) a rise in uncontrolled immigration/refugees,
6) an epidemic of ill health from substance abuse and otherwise,
7) businesses flee the city
8) cities fall into decay, and that results in
9) more surveillance and police state.
The 10th stage is the sacking of liberty and civilization itself.
It doesn’t fall out this way at every point in history, but this seems like a solid outline of what happened in this case. Four years is a very short period of time to see all of this unfold. But it is a fact that New York City was more-or-less civilized only four years ago. No one could have predicted that it would come to this so quickly.
But once the lockdowns happened, all bets were off. Here we had a policy that most directly trampled on all freedoms that we had taken for granted. Schools, businesses, and churches were slammed shut, with various levels of enforcement. The entire workforce was divided between essential and nonessential, and there was widespread confusion about who precisely was in charge of designating and enforcing this.
It felt like martial law at the time, as if all normal civilian law had been displaced by something else. That something had to do with public health, but there was clearly more going on, because suddenly our social media posts were censored and we were being asked to do things that made no sense, such as mask up for a virus that evaded mask protection and walk in only one direction in grocery aisles.
Vast amounts of the white-collar workforce stayed home—and their kids, too—until it became too much to bear. The city became a ghost town. Most U.S. cities were the same.
As the months of disaster rolled on, the captives were let out of their houses for the summer in order to protest racism but no other reason. As a way of excusing this, the same public health authorities said that racism was a virus as bad as COVID-19, so therefore it was permitted.
The protests had turned to riots in many cities, and the police were being defunded and discouraged to do anything about the problem. Citizens watched in horror as downtowns burned and drug-crazed freaks took over whole sections of cities. It was like every standard of decency had been zapped out of an entire swath of the population.
Meanwhile, large checks were arriving in people’s bank accounts, defying every normal economic expectation. How could people not be working and get their bank accounts more flush with cash than ever? There was a new law that didn’t even require that people pay rent. How weird was that? Even student loans didn’t need to be paid.
By the fall, recess from lockdown was over and everyone was told to go home again. But this time they had a job to do: They were supposed to vote. Not at the polling places, because going there would only spread germs, or so the media said. When the voting results finally came in, it was the absentee ballots that swung the election in favor of the opposition party that actually wanted more lockdowns and eventually pushed vaccine mandates on the whole population.
The new party in control took note of the large population movements out of cities and states that they controlled. This would have a large effect on voting patterns in the future. But they had a plan. They would open the borders to millions of people in the guise of caring for refugees. These new warm bodies would become voters in time and certainly count on the census when it came time to reapportion political power.
Meanwhile, the native population had begun to swim in ill health from substance abuse, widespread depression, and demoralization, plus vaccine injury. This increased dependency on the very institutions that had caused the problem in the first place: the medical/scientific establishment.
The rise of crime drove the small businesses out of the city. They had barely survived the lockdowns, but they certainly could not survive the crime epidemic. This undermined the tax base of the city and allowed the criminals to take further control.
The same cities became sanctuaries for the waves of migrants sacking the country, and partisan mayors actually used tax dollars to house these invaders in high-end hotels in the name of having compassion for the stranger. Citizens were pushed out to make way for rampaging migrant hordes, as incredible as this seems.
But with that, of course, crime rose ever further, inciting citizen anger and providing a pretext to bring in the police state in the form of the National Guard, now tasked with cracking down on crime in the transportation system.
What’s the next step? It’s probably already here: mass surveillance and censorship, plus ever-expanding police power. This will be accompanied by further population movements, as those with the means to do so flee the city and even the country and leave it for everyone else to suffer.
As I tell the story, all of this seems inevitable. It is not. It could have been stopped at any point. A wise and prudent political leadership could have admitted the error from the beginning and called on the country to rediscover freedom, decency, and the difference between right and wrong. But ego and pride stopped that from happening, and we are left with the consequences.
The government grows ever bigger and civil society ever less capable of managing itself in large urban centers. Disaster is unfolding in real time, mitigated only by a rising stock market and a financial system that has yet to fall apart completely.
Are we at the middle stages of total collapse, or at the point where the population and people in leadership positions wise up and decide to put an end to the downward slide? It’s hard to know. But this much we do know: There is a growing pocket of resistance out there that is fed up and refuses to sit by and watch this great country be sacked and taken over by everything it was set up to prevent.
Government
Low Iron Levels In Blood Could Trigger Long COVID: Study
Low Iron Levels In Blood Could Trigger Long COVID: Study
Authored by Amie Dahnke via The Epoch Times (emphasis ours),
People with inadequate…
Share this:


Authored by Amie Dahnke via The Epoch Times (emphasis ours),
People with inadequate iron levels in their blood due to a COVID-19 infection could be at greater risk of long COVID.
A new study indicates that problems with iron levels in the bloodstream likely trigger chronic inflammation and other conditions associated with the post-COVID phenomenon. The findings, published on March 1 in Nature Immunology, could offer new ways to treat or prevent the condition.
Long COVID Patients Have Low Iron Levels
Researchers at the University of Cambridge pinpointed low iron as a potential link to long-COVID symptoms thanks to a study they initiated shortly after the start of the pandemic. They recruited people who tested positive for the virus to provide blood samples for analysis over a year, which allowed the researchers to look for post-infection changes in the blood. The researchers looked at 214 samples and found that 45 percent of patients reported symptoms of long COVID that lasted between three and 10 months.
In analyzing the blood samples, the research team noticed that people experiencing long COVID had low iron levels, contributing to anemia and low red blood cell production, just two weeks after they were diagnosed with COVID-19. This was true for patients regardless of age, sex, or the initial severity of their infection.
According to one of the study co-authors, the removal of iron from the bloodstream is a natural process and defense mechanism of the body.
But it can jeopardize a person’s recovery.
“When the body has an infection, it responds by removing iron from the bloodstream. This protects us from potentially lethal bacteria that capture the iron in the bloodstream and grow rapidly. It’s an evolutionary response that redistributes iron in the body, and the blood plasma becomes an iron desert,” University of Oxford professor Hal Drakesmith said in a press release. “However, if this goes on for a long time, there is less iron for red blood cells, so oxygen is transported less efficiently affecting metabolism and energy production, and for white blood cells, which need iron to work properly. The protective mechanism ends up becoming a problem.”
The research team believes that consistently low iron levels could explain why individuals with long COVID continue to experience fatigue and difficulty exercising. As such, the researchers suggested iron supplementation to help regulate and prevent the often debilitating symptoms associated with long COVID.
“It isn’t necessarily the case that individuals don’t have enough iron in their body, it’s just that it’s trapped in the wrong place,” Aimee Hanson, a postdoctoral researcher at the University of Cambridge who worked on the study, said in the press release. “What we need is a way to remobilize the iron and pull it back into the bloodstream, where it becomes more useful to the red blood cells.”
The research team pointed out that iron supplementation isn’t always straightforward. Achieving the right level of iron varies from person to person. Too much iron can cause stomach issues, ranging from constipation, nausea, and abdominal pain to gastritis and gastric lesions.
1 in 5 Still Affected by Long COVID
COVID-19 has affected nearly 40 percent of Americans, with one in five of those still suffering from symptoms of long COVID, according to the U.S. Centers for Disease Control and Prevention (CDC). Long COVID is marked by health issues that continue at least four weeks after an individual was initially diagnosed with COVID-19. Symptoms can last for days, weeks, months, or years and may include fatigue, cough or chest pain, headache, brain fog, depression or anxiety, digestive issues, and joint or muscle pain.
Uncategorized
February Employment Situation
By Paul Gomme and Peter Rupert The establishment data from the BLS showed a 275,000 increase in payroll employment for February, outpacing the 230,000…
Share this:


By Paul Gomme and Peter Rupert
The establishment data from the BLS showed a 275,000 increase in payroll employment for February, outpacing the 230,000 average over the previous 12 months. The payroll data for January and December were revised down by a total of 167,000. The private sector added 223,000 new jobs, the largest gain since May of last year.

Temporary help services employment continues a steep decline after a sharp post-pandemic rise.


Average hours of work increased from 34.2 to 34.3. The increase, along with the 223,000 private employment increase led to a hefty increase in total hours of 5.6% at an annualized rate, also the largest increase since May of last year.

The establishment report, once again, beat “expectations;” the WSJ survey of economists was 198,000. Other than the downward revisions, mentioned above, another bit of negative news was a smallish increase in wage growth, from $34.52 to $34.57.

The household survey shows that the labor force increased 150,000, a drop in employment of 184,000 and an increase in the number of unemployed persons of 334,000. The labor force participation rate held steady at 62.5, the employment to population ratio decreased from 60.2 to 60.1 and the unemployment rate increased from 3.66 to 3.86. Remember that the unemployment rate is the number of unemployed relative to the labor force (the number employed plus the number unemployed). Consequently, the unemployment rate can go up if the number of unemployed rises holding fixed the labor force, or if the labor force shrinks holding the number unemployed unchanged. An increase in the unemployment rate is not necessarily a bad thing: it may reflect a strong labor market drawing “marginally attached” individuals from outside the labor force. Indeed, there was a 96,000 decline in those workers.


Earlier in the week, the BLS announced JOLTS (Job Openings and Labor Turnover Survey) data for January. There isn’t much to report here as the job openings changed little at 8.9 million, the number of hires and total separations were little changed at 5.7 million and 5.3 million, respectively.

As has been the case for the last couple of years, the number of job openings remains higher than the number of unemployed persons.

Also earlier in the week the BLS announced that productivity increased 3.2% in the 4th quarter with output rising 3.5% and hours of work rising 0.3%.

The bottom line is that the labor market continues its surprisingly (to some) strong performance, once again proving stronger than many had expected. This strength makes it difficult to justify any interest rate cuts soon, particularly given the recent inflation spike.
unemployment pandemic unemployment

Walmart launches clever answer to Target’s new membership program


EyePoint poaches medical chief from Apellis; Sandoz CFO, longtime BioNTech exec to retire


Wendy’s has a new deal for daylight savings time haters


Watch Live: President Biden Reminds Americans Just How Good They’ve Got It Thanks To Him


When Military Rule Supplants Democracy


Catastrophic Risk: Investing and Business Implications


Dropping Like a Stone: ON RRP Take‑up in the Second Half of 2023


Where Is R‑Star and the End of the Refi Boom: The Top 5 Posts of 2023


Mortgage rates fall as labor market normalizes


The Digest #187
-

 Uncategorized2 weeks ago
All Of The Elements Are In Place For An Economic Crisis Of Staggering Proportions
-

 Uncategorized1 month ago
Cathie Wood sells a major tech stock (again)
-

 Uncategorized3 weeks ago
California Counties Could Be Forced To Pay $300 Million To Cover COVID-Era Program
-

 Uncategorized2 weeks ago
Apparel Retailer Express Moving Toward Bankruptcy
-

 Uncategorized3 weeks ago
Industrial Production Decreased 0.1% in January
-
International1 day ago
Walmart launches clever answer to Target’s new membership program
-

 Uncategorized3 weeks ago
RFK Jr: The Wuhan Cover-Up & The Rise Of The Biowarfare-Industrial Complex
-

 Uncategorized3 weeks ago
GOP Efforts To Shore Up Election Security In Swing States Face Challenges