Uncategorized
AirBnB Bubble Bursts: Investor Home Purchases Crash 45% In Biggest Drop Since 2008
AirBnB Bubble Bursts: Investor Home Purchases Crash 45% In Biggest Drop Since 2008
Earlier this week, we wrote that the bursting of the AirBnB…
Share this:

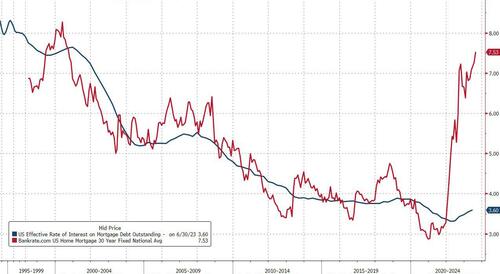
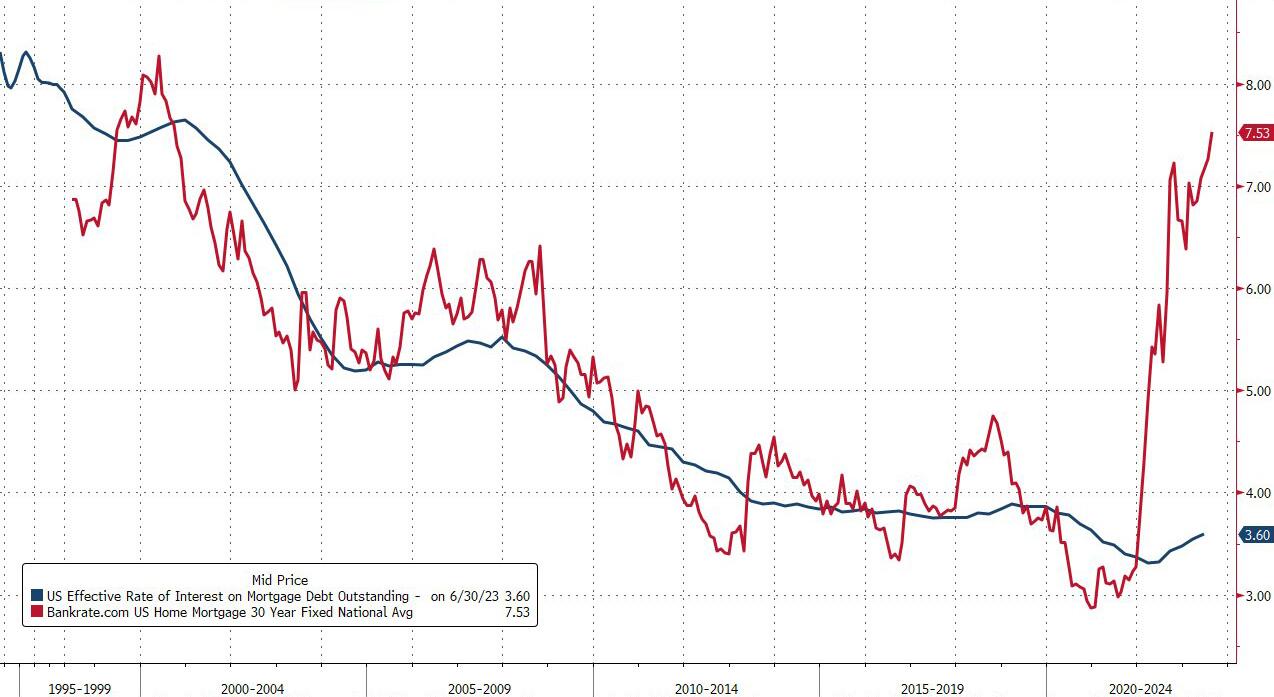
Earlier this week, we wrote that the bursting of the AirBnB bubble will also pop the broader housing bubble, which has shown remarkable resilience in the face of the highest interest rates since Volcker, largely the result of a staggering divergence between effective mortgage rates (since almost everyone refinanced into a 30Y mortgage when rates were at record lows a few years back and is locked into a nice, low rate for a long, long time... or until they sell) and current 30Y mortgages, which at 7.5% nobody can afford.
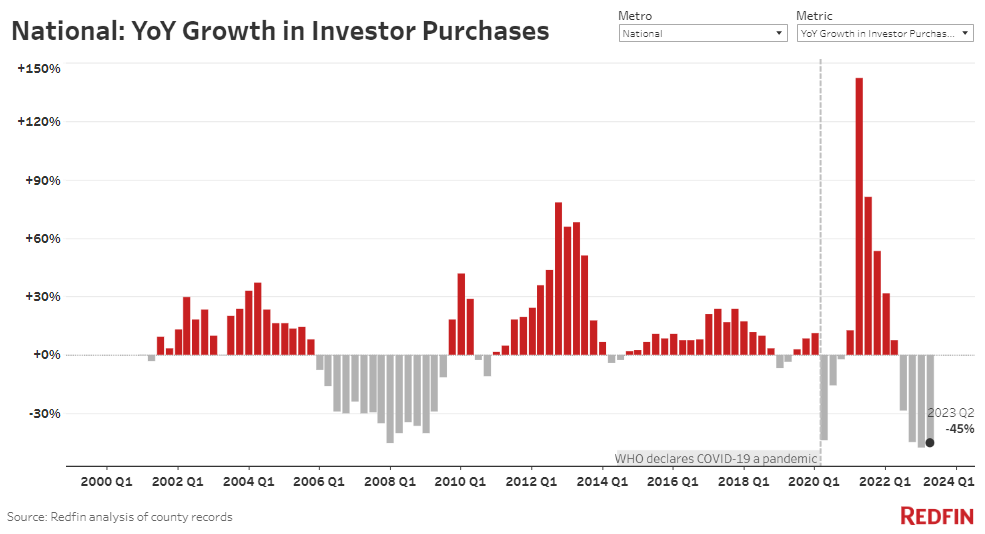
So back to the coming AirBnB fiasco, today the real estate experts at RedFin wrote that investor home purchases fell 45% from a year earlier in the second quarter, outpacing the 31% drop in overall home sales. That’s the biggest decline since 2008 with the exception of the quarter before, when they dropped 48%.
The decline comes as this year’s relatively cool housing and rental markets makes investing in homes less attractive than it was during the pandemic-driven homebuying frenzy of 2021 and early 2022, when record numbers of AirBnB were purchased as hotel and lodging surrogates (Redfin defines an investor as any institution or business that purchases residential real estate).
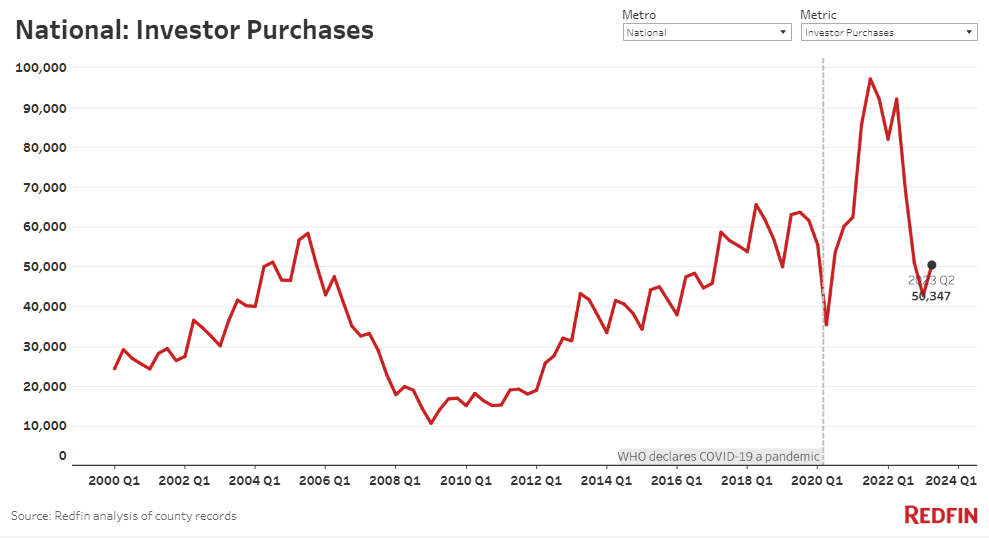
The drop in purchases has brought the total number of homes bought by investors below pre-pandemic levels, which is a major concern for a market where investors remained the last remaining support pillar now that most average Americans seeking to buy their first home are simply unable to afford it and are stuck renting indefinitely.
Real estate investors bought roughly 50,000 U.S. homes in the second quarter, the fewest of any second quarter in seven years, with the exception of the start of the pandemic.
As Redfin notes, the plunge marks a retreat from a boom in investor activity during the pandemic, which was driven by record-low mortgage rates and huge homebuying and rental demand, creating opportunities for investors to make a lot of money.
“Offers from hedge funds have dried up; I haven’t received an offer from one in a long time, except unrealistically low offers,” said Las Vegas Redfin Premier agent Shay Stein. “From mid-2020 until early 2022 when interest rates started going up, hedge funds bought up a ton of properties and immediately turned them into rentals, pricing out local buyers. Now a big portion of our homes are owned by investors, but they’re not adding to their portfolios.”
In dollar terms, the drop in investor purchases is almost as big. Investors bought a total of $36.4 billion worth of homes in the second quarter, down 42% from a year earlier. That’s still above pre-pandemic levels, but dropping closer to it: Investors bought a total of $34 billion in the second quarter of 2018, and a total of $31.9 billion in the second quarter of 2019. The typical home purchased by investors in the second quarter cost $470,120, comparable with the $467,885 median price a year earlier.
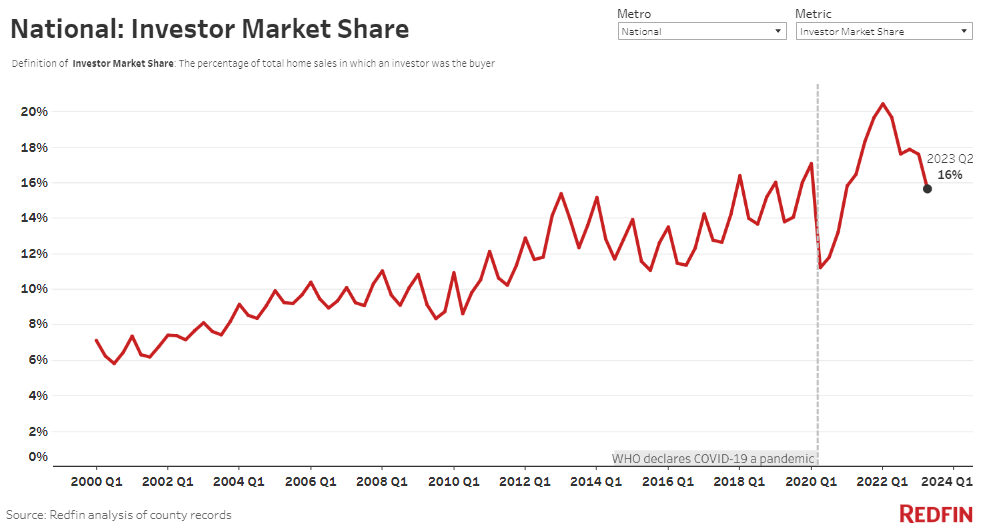
In terms of market share, investors bought 15.6% of homes that were sold in the U.S. during the second quarter, down from 19.7% a year earlier and a record high of 20.4% in the beginning of 2022.
And while investors’ market share is still above pre-pandemic levels (15.6% compared with roughly 14% in the second quarters of both 2018 and 2019), real estate investors are steadily pulling back. Their market share has dropped or remained flat every quarter since it peaked at the start of 2022.
The outsized drop in purchases by investors helps explain why their market share is coming down: Investors backed off from the housing market faster than individual homebuyers in the second quarter.
Stubbornly high home prices and mortgage rates, limited inventory and widespread economic uncertainty have dampened housing demand and suppressed overall home sales. Those factors are an even bigger deterrent for investors, because they’re in it purely for the potential to make money by flipping homes or renting them out. When housing demand is down, investors are less motivated. There’s always at least some demand from individual buyers who need to move, but the same isn’t true for investors.
Additionally, investors themselves were deterred by high home prices and high interest rates. Roughly 7 of every 10 (71%) investor purchases were made in cash in the second quarter–down from 75% a year earlier–but they’re still impacted by high interest rates because they often use other types of loans to cover expenses.
“Moving forward, the investors who do come back may be more focused on scooping up rental properties than flipping homes,” said Redfin Senior Economist Sheharyar Bokhari. “All signs point to the rental market remaining relatively strong. Home prices and mortgage rates are high enough to motivate would-be first-time homebuyers to continue renting. The typical U.S. asking rent remains quite high, just $16 shy of its all-time high, so investors who are landlords stand to earn money. Investor purchases of rental properties could be limited by some of them building new properties to rent out, though.”
“Home flippers may be slower to come back,” Bokhari continued. “That’s mainly because mortgage rates are unlikely to decline significantly in the short term, which will keep homebuying demand relatively low and discourage flippers. Plus, investors have lower-risk places to park their money right now than real estate, with high yields in the bond market.”
Even if investors’ market share does pick back up, their purchase volume is likely to remain low. Like other buyers, they’re limited by a severe lack of listings, with homeowners locked in by relatively low mortgage rates.
Investors’ share of new listings is falling–but those who are selling are seeing big gains
Homes owned by investors are making up a smaller share of new listings on the market. Investors owned 8% of new listings in March, down slightly from 9% a year earlier and down from a peak of 13% at the end of 2021. Investors listed 36% fewer homes than a year earlier, compared with a 24% drop in overall new listings. March is the most recent month for which this data is available.
Most investors who are still flipping homes are making money. The typical home flipper who sold a home in June sold for 61% ($188,448) more than their initial purchase price. Though that’s a substantial gain, it’s down from a 69% ($199,946) premium a year earlier.
Just 3% of homes sold by flippers sold at a loss in June, down from a peak of 29% in September 2022 and roughly on par with 4% a year earlier.
“Investors aren’t helping to solve the country’s severe inventory shortage or its housing affordability crisis,” Bokhari said. “Flippers are putting far fewer homes on the market than they were during the same period in 2021 or 2022, and hardly any of them are taking a loss, which would at least give individual homebuyers a somewhat good deal. And the steady decline in investor purchases means they aren’t likely to replenish the housing market with newly renovated homes anytime soon.”
In this section, “ flipper” refers to an investor who sold a home within nine months of buying it. Additionally, flippers selling at a higher price than they bought doesn’t necessarily equal profit because it doesn’t take into account the money they spent renovating it.
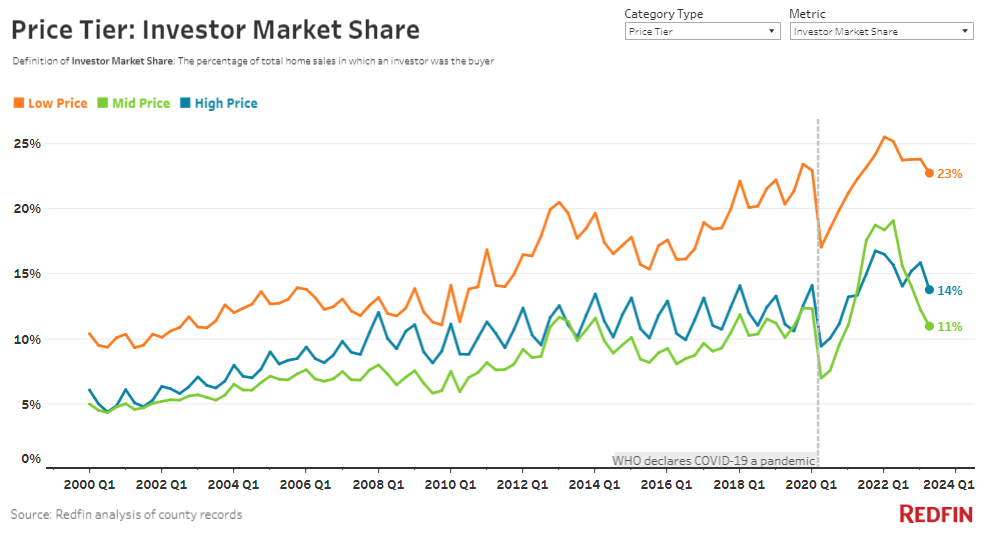
Investors most commonly buy low-priced homes
Investors bought 23% of low-priced homes that sold in the second quarter, down from 25% a year earlier but still much higher than investors’ market share for more expensive homes. They bought 11% of mid-priced homes, down from 19% a year earlier, and 14% of high-priced homes, down from 16% a year earlier.
Investors are attracted to low-priced homes for the same reason as other homebuyers: They cost less, which is especially attractive when home prices and interest and mortgage rates remain elevated. Investors who are buying homes to flip and re-sell are doing so in hopes that they can buy low and sell higher. Small homes–those with 1,400 square feet or less–made up 39.2% of investor purchases in the second quarter, the highest share of any second quarter on record and down just slightly from the record high of 40.6% in the first quarter of 2023.
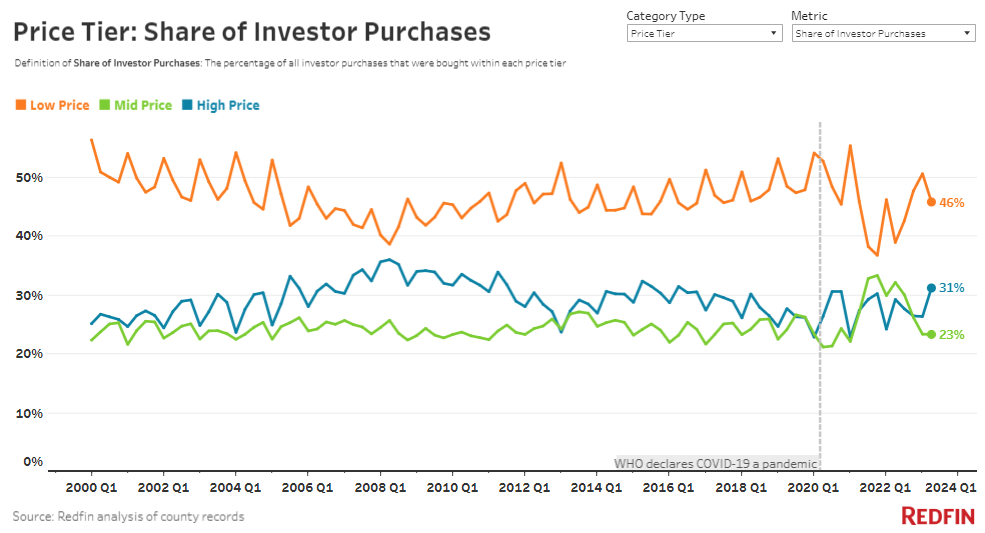
In that same vein, low-priced homes low-priced homes make up a substantial piece of investors’ homebuying pie. Low-priced homes made up 46% of investor purchases in the second quarter, up from 39% a year earlier. High-priced homes made up 31% of investor purchases, up from 29% a year earlier.
The uptick for the most affordable and the most expensive homes has cut into the share of mid-priced homes. Mid-priced homes made up 23% of investor purchases, down from a near-record-high of 32% a year earlier.
Single-family homes represent nearly 7 in 10 investor purchases
Single-family homes made up 68% of investor purchases in the second quarter. That’s down from 73% a year earlier, but still the lion’s share of purchases by real estate investors. The decline is partly due to a lack of single-family homes for sale.
Next come condos, which made up 20% of investor purchases, up from 16% a year earlier and the highest share since 2018. Townhouses made up 7% of purchases, followed by multi-family properties, which accounted for 5%.
But in terms of market share, investors have the highest when it comes to multi-family properties. Real estate investors purchased 31% of multi-family properties that sold in the second quarter, just shy of 32% a year earlier. Investors make up a relatively high share of multi-family purchases because those buildings are typically expensive and used as rental properties.
Investors purchased 15% of single-family homes, down from 20% a year earlier. Investors bought roughly one out of every six condos and townhouses that sold, on par with last year.
Metro-level highlights: Investor activity
The highlights below are for the second quarter of 2023, unless otherwise noted
- Metros where investor market share dropped most. Investors bought roughly 17% of homes sold in Phoenix, down from 32% a year earlier, the biggest decline of the metros in this analysis. The next-biggest drops were in Las Vegas and Atlanta, where roughly 18% of homes were bought by investors, down from about 33%. Jacksonville, FL (19%, down from 32%) and Charlotte, NC (16%, down from 29%) round out the top five. Investor market share–and investor purchases (see below)–fell most in the Sun Belt and Florida because those places had an even bigger boom in homebuying demand and investor activity than the rest of the country in 2021 and 2022. Now investors are pulling back quickly as those markets cool. Plus, several of those metros were popular among the iBuyer type of investor, many of which have now ceased operations.
- Metros where investor market share increased most. Investor market share fell in 25 of the metros in this analysis, and rose in the other 14–all modest increases. The biggest increase was in New York, where investors bought 18% of homes sold, up from about 16% a year earlier. Next come Seattle (11%, up from about 9%), Cleveland (20%, up from about 18%), Chicago (11%, up from about 10%) and Riverside, CA (19%, up from about 18%).
- Metros where investor purchases dropped most. Investor purchases dropped most in the same places where market share declined most. They dropped 65% year over year in Las Vegas, Jacksonville and Phoenix, the biggest declines of the metros in this analysis. They’re followed closely by Atlanta (-64%) and Charlotte, NC (-62%).
- Metros with the smallest declines in investor purchases. Investor purchases fell in all the metros Redfin analyzed, but they had the smallest year-over-year declines in Chicago (-13%), Providence, RI (-22%), West Palm Beach, FL (-23%), Seattle (-23%) and Cleveland (-25%).
- Metros with the highest market share. Investors had the highest market share in Miami, where they made 30% of home purchases. Next come three California metros: San Diego (22%), Anaheim, CA (21%) and San Francisco (21%). Cleveland (20%) rounds out the top five. Miami’s market share is high and holding steady (it’s down just 1 percentage point year over year) because it remains popular with both U.S. and foreign investors as its housing market has stayed relatively hot throughout this downturn.
- Metros with the highest median sale price of investor-bought homes. The median price of homes bought by investors in both San Francisco and San Jose was $1.8 million, by far the highest of the metros in this analysis. Next come three other California metros: Anaheim ($1.2 million), Oakland ($1.1 million) and Los Angeles ($1 million).
- Metros with the highest share of investor-owned new listings (March 2023): Miami (15%), Fort Lauderdale (12%) and Los Angeles (11%).
- Metros with the lowest share of investor-owned new listings (March 2023): Seattle (4%) and Providence, RI (4%).
- Metros with the highest share of investor-owned properties selling at a loss (June 2023): Detroit (14%), Phoenix (13%), San Francisco (12%) and Las Vegas (11%).
- Metros with the lowest share of investor-owned properties selling at a loss (June 2023): Columbus, OH (1%), San Diego (2%) and Miami (2%).
More in the full report from Redfin
Uncategorized
February Employment Situation
By Paul Gomme and Peter Rupert The establishment data from the BLS showed a 275,000 increase in payroll employment for February, outpacing the 230,000…
Share this:


By Paul Gomme and Peter Rupert
The establishment data from the BLS showed a 275,000 increase in payroll employment for February, outpacing the 230,000 average over the previous 12 months. The payroll data for January and December were revised down by a total of 167,000. The private sector added 223,000 new jobs, the largest gain since May of last year.

Temporary help services employment continues a steep decline after a sharp post-pandemic rise.


Average hours of work increased from 34.2 to 34.3. The increase, along with the 223,000 private employment increase led to a hefty increase in total hours of 5.6% at an annualized rate, also the largest increase since May of last year.

The establishment report, once again, beat “expectations;” the WSJ survey of economists was 198,000. Other than the downward revisions, mentioned above, another bit of negative news was a smallish increase in wage growth, from $34.52 to $34.57.

The household survey shows that the labor force increased 150,000, a drop in employment of 184,000 and an increase in the number of unemployed persons of 334,000. The labor force participation rate held steady at 62.5, the employment to population ratio decreased from 60.2 to 60.1 and the unemployment rate increased from 3.66 to 3.86. Remember that the unemployment rate is the number of unemployed relative to the labor force (the number employed plus the number unemployed). Consequently, the unemployment rate can go up if the number of unemployed rises holding fixed the labor force, or if the labor force shrinks holding the number unemployed unchanged. An increase in the unemployment rate is not necessarily a bad thing: it may reflect a strong labor market drawing “marginally attached” individuals from outside the labor force. Indeed, there was a 96,000 decline in those workers.


Earlier in the week, the BLS announced JOLTS (Job Openings and Labor Turnover Survey) data for January. There isn’t much to report here as the job openings changed little at 8.9 million, the number of hires and total separations were little changed at 5.7 million and 5.3 million, respectively.

As has been the case for the last couple of years, the number of job openings remains higher than the number of unemployed persons.

Also earlier in the week the BLS announced that productivity increased 3.2% in the 4th quarter with output rising 3.5% and hours of work rising 0.3%.

The bottom line is that the labor market continues its surprisingly (to some) strong performance, once again proving stronger than many had expected. This strength makes it difficult to justify any interest rate cuts soon, particularly given the recent inflation spike.
unemployment pandemic unemploymentUncategorized
Mortgage rates fall as labor market normalizes
Jobless claims show an expanding economy. We will only be in a recession once jobless claims exceed 323,000 on a four-week moving average.
Share this:


Everyone was waiting to see if this week’s jobs report would send mortgage rates higher, which is what happened last month. Instead, the 10-year yield had a muted response after the headline number beat estimates, but we have negative job revisions from previous months. The Federal Reserve’s fear of wage growth spiraling out of control hasn’t materialized for over two years now and the unemployment rate ticked up to 3.9%. For now, we can say the labor market isn’t tight anymore, but it’s also not breaking.
The key labor data line in this expansion is the weekly jobless claims report. Jobless claims show an expanding economy that has not lost jobs yet. We will only be in a recession once jobless claims exceed 323,000 on a four-week moving average.
From the Fed: In the week ended March 2, initial claims for unemployment insurance benefits were flat, at 217,000. The four-week moving average declined slightly by 750, to 212,250
Below is an explanation of how we got here with the labor market, which all started during COVID-19.
1. I wrote the COVID-19 recovery model on April 7, 2020, and retired it on Dec. 9, 2020. By that time, the upfront recovery phase was done, and I needed to model out when we would get the jobs lost back.
2. Early in the labor market recovery, when we saw weaker job reports, I doubled and tripled down on my assertion that job openings would get to 10 million in this recovery. Job openings rose as high as to 12 million and are currently over 9 million. Even with the massive miss on a job report in May 2021, I didn’t waver.
Currently, the jobs openings, quit percentage and hires data are below pre-COVID-19 levels, which means the labor market isn’t as tight as it once was, and this is why the employment cost index has been slowing data to move along the quits percentage.

3. I wrote that we should get back all the jobs lost to COVID-19 by September of 2022. At the time this would be a speedy labor market recovery, and it happened on schedule, too
Total employment data
4. This is the key one for right now: If COVID-19 hadn’t happened, we would have between 157 million and 159 million jobs today, which would have been in line with the job growth rate in February 2020. Today, we are at 157,808,000. This is important because job growth should be cooling down now. We are more in line with where the labor market should be when averaging 140K-165K monthly. So for now, the fact that we aren’t trending between 140K-165K means we still have a bit more recovery kick left before we get down to those levels.

From BLS: Total nonfarm payroll employment rose by 275,000 in February, and the unemployment rate increased to 3.9 percent, the U.S. Bureau of Labor Statistics reported today. Job gains occurred in health care, in government, in food services and drinking places, in social assistance, and in transportation and warehousing.
Here are the jobs that were created and lost in the previous month:

In this jobs report, the unemployment rate for education levels looks like this:
- Less than a high school diploma: 6.1%
- High school graduate and no college: 4.2%
- Some college or associate degree: 3.1%
- Bachelor’s degree or higher: 2.2%

Today’s report has continued the trend of the labor data beating my expectations, only because I am looking for the jobs data to slow down to a level of 140K-165K, which hasn’t happened yet. I wouldn’t categorize the labor market as being tight anymore because of the quits ratio and the hires data in the job openings report. This also shows itself in the employment cost index as well. These are key data lines for the Fed and the reason we are going to see three rate cuts this year.
recession unemployment covid-19 fed federal reserve mortgage rates recession recovery unemploymentUncategorized
Inside The Most Ridiculous Jobs Report In History: Record 1.2 Million Immigrant Jobs Added In One Month
Inside The Most Ridiculous Jobs Report In History: Record 1.2 Million Immigrant Jobs Added In One Month
Last month we though that the January…
Share this:


Last month we though that the January jobs report was the "most ridiculous in recent history" but, boy, were we wrong because this morning the Biden department of goalseeked propaganda (aka BLS) published the February jobs report, and holy crap was that something else. Even Goebbels would blush.
What happened? Let's take a closer look.
On the surface, it was (almost) another blockbuster jobs report, certainly one which nobody expected, or rather just one bank out of 76 expected. Starting at the top, the BLS reported that in February the US unexpectedly added 275K jobs, with just one research analyst (from Dai-Ichi Research) expecting a higher number.
Some context: after last month's record 4-sigma beat, today's print was "only" 3 sigma higher than estimates. Needless to say, two multiple sigma beats in a row used to only happen in the USSR... and now in the US, apparently.

Before we go any further, a quick note on what last month we said was "the most ridiculous jobs report in recent history": it appears the BLS read our comments and decided to stop beclowing itself. It did that by slashing last month's ridiculous print by over a third, and revising what was originally reported as a massive 353K beat to just 229K, a 124K revision, which was the biggest one-month negative revision in two years!

Of course, that does not mean that this month's jobs print won't be revised lower: it will be, and not just that month but every other month until the November election because that's the only tool left in the Biden admin's box: pretend the economic and jobs are strong, then revise them sharply lower the next month, something we pointed out first last summer and which has not failed to disappoint once.
In the past month the Biden department of goalseeking stuff higher before revising it lower, has revised the following data sharply lower:
— zerohedge (@zerohedge) August 30, 2023
- Jobs
- JOLTS
- New Home sales
- Housing Starts and Permits
- Industrial Production
- PCE and core PCE
To be fair, not every aspect of the jobs report was stellar (after all, the BLS had to give it some vague credibility). Take the unemployment rate, after flatlining between 3.4% and 3.8% for two years - and thus denying expectations from Sahm's Rule that a recession may have already started - in February the unemployment rate unexpectedly jumped to 3.9%, the highest since February 2022 (with Black unemployment spiking by 0.3% to 5.6%, an indicator which the Biden admin will quickly slam as widespread economic racism or something).

And then there were average hourly earnings, which after surging 0.6% MoM in January (since revised to 0.5%) and spooking markets that wage growth is so hot, the Fed will have no choice but to delay cuts, in February the number tumbled to just 0.1%, the lowest in two years...

... for one simple reason: last month's average wage surge had nothing to do with actual wages, and everything to do with the BLS estimate of hours worked (which is the denominator in the average wage calculation) which last month tumbled to just 34.1 (we were led to believe) the lowest since the covid pandemic...

... but has since been revised higher while the February print rose even more, to 34.3, hence why the latest average wage data was once again a product not of wages going up, but of how long Americans worked in any weekly period, in this case higher from 34.1 to 34.3, an increase which has a major impact on the average calculation.

While the above data points were examples of some latent weakness in the latest report, perhaps meant to give it a sheen of veracity, it was everything else in the report that was a problem starting with the BLS's latest choice of seasonal adjustments (after last month's wholesale revision), which have gone from merely laughable to full clownshow, as the following comparison between the monthly change in BLS and ADP payrolls shows. The trend is clear: the Biden admin numbers are now clearly rising even as the impartial ADP (which directly logs employment numbers at the company level and is far more accurate), shows an accelerating slowdown.

But it's more than just the Biden admin hanging its "success" on seasonal adjustments: when one digs deeper inside the jobs report, all sorts of ugly things emerge... such as the growing unprecedented divergence between the Establishment (payrolls) survey and much more accurate Household (actual employment) survey. To wit, while in January the BLS claims 275K payrolls were added, the Household survey found that the number of actually employed workers dropped for the third straight month (and 4 in the past 5), this time by 184K (from 161.152K to 160.968K).

This means that while the Payrolls series hits new all time highs every month since December 2020 (when according to the BLS the US had its last month of payrolls losses), the level of Employment has not budged in the past year. Worse, as shown in the chart below, such a gaping divergence has opened between the two series in the past 4 years, that the number of Employed workers would need to soar by 9 million (!) to catch up to what Payrolls claims is the employment situation.

There's more: shifting from a quantitative to a qualitative assessment, reveals just how ugly the composition of "new jobs" has been. Consider this: the BLS reports that in February 2024, the US had 132.9 million full-time jobs and 27.9 million part-time jobs. Well, that's great... until you look back one year and find that in February 2023 the US had 133.2 million full-time jobs, or more than it does one year later! And yes, all the job growth since then has been in part-time jobs, which have increased by 921K since February 2023 (from 27.020 million to 27.941 million).

Here is a summary of the labor composition in the past year: all the new jobs have been part-time jobs!

But wait there's even more, because now that the primary season is over and we enter the heart of election season and political talking points will be thrown around left and right, especially in the context of the immigration crisis created intentionally by the Biden administration which is hoping to import millions of new Democratic voters (maybe the US can hold the presidential election in Honduras or Guatemala, after all it is their citizens that will be illegally casting the key votes in November), what we find is that in February, the number of native-born workers tumbled again, sliding by a massive 560K to just 129.807 million. Add to this the December data, and we get a near-record 2.4 million plunge in native-born workers in just the past 3 months (only the covid crash was worse)!

The offset? A record 1.2 million foreign-born (read immigrants, both legal and illegal but mostly illegal) workers added in February!

Said otherwise, not only has all job creation in the past 6 years has been exclusively for foreign-born workers...

... but there has been zero job-creation for native born workers since June 2018!

This is a huge issue - especially at a time of an illegal alien flood at the southwest border...

... and is about to become a huge political scandal, because once the inevitable recession finally hits, there will be millions of furious unemployed Americans demanding a more accurate explanation for what happened - i.e., the illegal immigration floodgates that were opened by the Biden admin.
Which is also why Biden's handlers will do everything in their power to insure there is no official recession before November... and why after the election is over, all economic hell will finally break loose. Until then, however, expect the jobs numbers to get even more ridiculous.


Wendy’s has a new deal for daylight savings time haters


Watch Live: President Biden Reminds Americans Just How Good They’ve Got It Thanks To Him


Racial and Ethnic Wealth Inequality in the Post‑Pandemic Era


Mortgage rates fall as labor market normalizes


Watch: President Biden Delivers The “Darkest, Most Un-American Speech Given By A President”


Wealth Inequality by Age in the Post‑Pandemic Era


Is the biotech market rally real? Data suggest comeback in private, public markets


People Who Received Ivermectin Were Better Off, Study Finds


Shipping company files surprise Chapter 7 bankruptcy, liquidation


Interest rates, the best it gets. It’s time to deploy cash
-

 Uncategorized2 weeks ago
All Of The Elements Are In Place For An Economic Crisis Of Staggering Proportions
-

 Uncategorized1 month ago
Cathie Wood sells a major tech stock (again)
-

 Uncategorized3 weeks ago
California Counties Could Be Forced To Pay $300 Million To Cover COVID-Era Program
-

 Uncategorized2 weeks ago
Apparel Retailer Express Moving Toward Bankruptcy
-

 Uncategorized3 weeks ago
Industrial Production Decreased 0.1% in January
-

 International1 day ago
Walmart launches clever answer to Target’s new membership program
-

 Uncategorized3 weeks ago
RFK Jr: The Wuhan Cover-Up & The Rise Of The Biowarfare-Industrial Complex
-

 Uncategorized3 weeks ago
GOP Efforts To Shore Up Election Security In Swing States Face Challenges