A Major Support For Asset Prices Has Reversed
In 2019, we wrote about how corporate share repurchases, or "stock buybacks," had accounted for nearly all buying in the market. A year later, that significant support for asset prices has reversed.
While markets have certainly been on a tear this year,..
Share this:

In 2019, we wrote about how corporate share repurchases, or “stock buybacks,” had accounted for nearly all buying in the market. A year later, that significant support for asset prices has reversed.
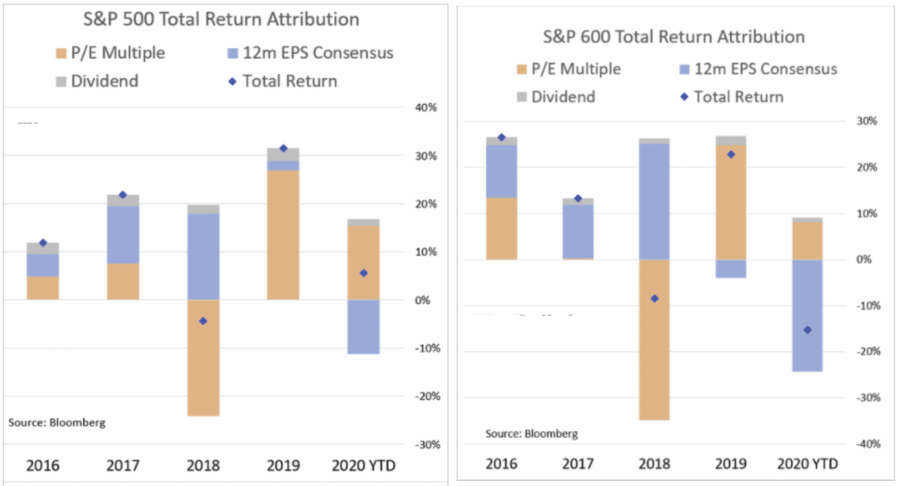
While markets have certainly been on a tear this year, due to massive amounts of Federal Stimulus, it has been an advance solely on valuation expansion. While the decline in 2020 earnings was no surprise given the pandemic, earnings were already declining in 2019. The chart shows this in the return attribution of the S&P 500.

Notably, while investors are willing to “pay more for less” in earnings, revenue growth deteriorated more.
Overpaying For Earnings
Such is not a new phenomenon. Since 2009, sales per share, what happens at the top of the income statement, has cumulatively grown by just 43% through Q3-2020. It is hard to justify bidding up stocks by 400% based on meager revenue growth. So, Wall Street created metrics like “Operating Earnings” to provide justification. The problem with “Operating Earnings” is they are heavily “fudged” to create a more optimistic picture.

“The tricks are well-known: A difficult quarter can be made easier by releasing reserves set aside for a rainy day. Or, recognizing revenues before sales are made. A good quarter is often the time to hide a big “restructuring charge” that would otherwise stand out like a sore thumb.
What is more surprising though is CFOs’ belief these practices leave a significant mark on companies’ reported profits and losses. When asked about the magnitude of the earnings misrepresentation, the study’s respondents said it was around 10% of earnings per share.“

The reason companies do this is simple: stock-based compensation. Today, more than ever, corporate executives have a large percentage of their compensation tied to stock performance. A “miss” of Wall Street expectations can lead to a large penalty in the companies stock price.
In a survey conducted with corporate executives, 93% of the respondents pointed to “influence on stock price” and “outside pressure” as the reason for manipulating earnings figures.
A Buyback Boost
The use of stock buybacks has continued to rise in recent years and went off the charts following tax cuts in 2017. As I wrote in early 2018. most thought tax cuts would lead to rising capital investment, higher wages, and economic growth. However, it went where we expected it would. To wit:
“Not surprisingly, our guess that corporations would utilize the benefits of ‘tax cuts’ to boost bottom line earnings rather than increase wages has turned out to be true.
‘In just the first two months of this year companies have already announced over $173 BILLION in stock buybacks. This is ‘financial engineering gone mad’” – Axios:
The heavy use of buybacks turned cumulative revenue growth of 43% into a 276% gain in operating earnings.

To gain a better perspective on the real growth of corporations’ profitability over the last decade, just look at corporate profits after tax. These are the profits reported to the IRS for tax purposes and includes all the write-offs, expenses, and other items. Considering profits didn’t grow from 2014-2019 and then collapsed to 2010 levels in 2020, it is hard to justify current valuations.

However, while retail investors are piling into stocks, the corporate executives are cashing out.
Insiders Cashing Out
One can not argue the changing dynamics of the market from “passive indexing.” Currently, the new “gold rush” on Wall Street is to issue “exchange-traded funds,” also known as a “product,” to meet retail investor demands. (Also known as “dumb money.”)

As retail investors’ exuberance to take on more risk increases, they push more money into equity-based funds. Currently, we are back to levels seen before the 20% decline in 2018. Importantly, as money flows into these funds, the underlying company stock prices rise.

This all aligns with SentimenTrader’s “Dumb Money” index hitting the highest levels in history.

Therefore, it should be of no surprise that corporate executives, who, as noted, have large exposures to stock-based compensation, are “cashing out.”

If the “executives” are cashing out while you are rushing in, maybe ask what they know that you don’t.
Such brings us to the main point of our analysis.
Peak Buybacks
While corporations struggled with profit growth, they posted steller “operating earnings” growth. Such was mainly due to tax cuts, accounting gimmicks, and share buybacks. As discussed previously in “Peak Buybacks:”
“The misuse, and abuse, of share buybacks to manipulate earnings and reward insiders has become problematic. As John Authers pointed out:
‘For much of the last decade, companies buying their own shares have accounted for all net purchases. The total amount of stock bought back by companies since the 2008 crisis even exceeds the Federal Reserve’s spending on buying bonds over the same period as part of quantitative easing. Both pushed up asset prices.’
Between the Fed injecting massive amounts of liquidity, and corporations buying back shares, there have been no other real buyers in the market.”

Hoarding Cash
But here is the crucial point we made last September in that article:
“CEO’s make decisions on how they use their cash. If concerns of a recession persist, companies will become more conservative on the use of their cash, rather than continuing to repurchase shares.” – September 2019
As we also stated in that article:
“When stock prices do eventually fall, companies that performed un-economic buybacks would find themselves with financial losses on their hands, more debt on their balance sheets, and fewer opportunities to grow in the future. Equally disturbing, the many CEO’s who sanctioned buybacks, are much wealthier and unaccountable for their actions.”
As we saw, the same companies which have spent billions on “share buybacks” over the last decade were the first ones in line for a Government bailout earlier this year.
Now, companies are hoarding cash as we approach the end of the year to ensure their survival against a weaker economic environment in 2021.

Of course, the critical question is what that means for the markets.
A Reversal Of Buybacks
While corporations are increasing their cash hoards and issuing debt, they are taking advantage of investors’ “irrational exuberance” to sell shares into the market. The outcome is the same. There is less corporate demand underlying the financial markets.
Review the chart above that showed nearly all of the previous equity buying came from corporations. Corporations have now switched by markedly decreasing share buybacks from the 2015-2019 levels. Now they are beginning to increase outstanding shares.

Notably, over the last 20-years, the only two previous periods where corporations were increasing the number of shares outstanding was during the 2000 and 2008 recessions. (Important note: Increasing shares counts reverses the bottom-line EPS boost.)

The Problem Of Debt
Corporations also have another problem.
Over the last several years, debt was the funding source for a large chunk of the share buybacks completed. As Goldman Sachs noted in 2019, an analysis of corporate balance sheets found that dividend and stock buybacks accounted for 103.8% of their free cash flow. Meaning they were paying more out in cash than they had on hand.
The chart below compares the total amount of corporate debt issued versus the reduction in the number of shares.

It shouldn’t be surprising to see that when corporations have previously been “net issuers” of stocks versus “buyers,” asset markets have not performed well.

The explosion of corporate debt has become problematic in recent years and is a significant concern for the Fed. Such is why they launched into buying corporate debt following the onset of the pandemic. As asset prices decrease, many companies become unable to refinance their debt, or worse, forced to liquidate. With the current debt-to-GDP ratio even higher today than before the “pandemic,” the trap has grown.

Such is something Dallas Fed President Robert Kaplan warned about:
U.S. nonfinancial corporate debt consists mostly of bonds and loans. This category of debt, as a percentage of gross domestic product, is now higher than in the prior peak reached at the end of 2008.
A number of studies have concluded this level of credit could ‘potentially amplify the severity of a recession,’
The lowest level of investment-grade debt, BBB bonds, has grown from $800 million to $2.7 trillion by year-end 2018. High-yield debt has grown from $700 million to $1.1 trillion over the same period. This trend has been accompanied by more relaxed bond and loan covenants, he added.
Conclusion
Next year, with a large source of support removed from the market, it could become more challenging for equity investors.
Such is even more likely if the Fed gets its wish for inflation, or bond bears get higher rates. That could be the worse possible outcome for equity markets as the supports of low rates, debt issuance, and “valuation” support all reverse.
Investors are currently following the Chuck Prince investing mantra by “dancing while the music is playing.”
It is worth remembering that eventually, the song ends.
The post A Major Support For Asset Prices Has Reversed appeared first on RIA.
recession pandemic stimulus economic growth bonds sp 500 stocks fed federal reserve irs recession gdp goldGovernment
Stock Market Today: Stocks turn lower as factory inflation spikes, retail sales miss target
Stocks will navigate the last major data releases prior to next week’s Fed rate meeting in Washington.
Share this:


Check back for updates throughout the trading day
U.S. stocks edged lower Thursday following a trio of key economic releases that have added to the current inflation puzzle as investors shift focus to the Federal Reserve's March policy meeting next week in Washington.
Updated at 9:59 AM EDT
Red start
Stocks are now falling sharply following the PPI inflation data and retail sales miss, with the S&P 500 marked 18 points lower, or 0.36%, in the opening half hour of trading.
The Dow, meanwhile, was marked 92 points lower while the Nasdaq slipped 67 points.
Treasury yields are also on the move, with 2-year notes rising 5 basis points on the session to 4.679% and 10-year notes pegged 7 basis points higher at 4.271%.
The probability of a June rate cut has moved below 60% after the higher-than-expected CPI/PPI reports. A week ago this probability was 74% and a month ago it was 82%. pic.twitter.com/9W01oWU96G
— Charlie Bilello (@charliebilello) March 14, 2024
Updated at 9:44 AM EDT
Under Water
Under Armour (UAA) shares slumped firmly lower in early trading following the sportswear group's decision to bring back founder Kevin Plank as CEO, replacing the outgoing Stephanie Linnartz.
Plank, who founded Under Armour in 1996, left the group in May of 2021 just weeks before the group revealed that it was co-operating with investigations from both the Securities and Exchange Commission and the U.S. Department of Justice into the company's revenue recognition accounting.
Under Armour shares were marked 10.6% lower in early trading to change hands at $7.21 each.
Updated at 9:22 AM EDT
Steely resolve
U.S. Steel (X) shares extended their two-day decline Thursday, falling 5.75% in pre-market trading following multiple reports that suggest President Joe Biden will push to prevent Japan's Nippon Steel from buying the Pittsburgh-based group.
Both Reuters and the Associated Press have said Biden will express his views to Prime Minister Kishida Yuko ahead of a planned State Visit next month at the White House.
Related: US Steel soars on $15 billion Nippon Steel takeover; United Steelworkers slams deal
Updated at 8:52 AM EDT
Clear as mud
Retail sales rebounded last month, but the overall tally of $700.7 billion missed Street forecasts and suggests the recent uptick in inflation could be holding back discretionary spending.
A separate reading of factory inflation, meanwhile, showed prices spiking by 1.6%, on the year, and 0.6% on the month, amid a jump in goods prices.
U.S. stocks held earlier gains following the data release, with futures tied to the S&P 500 indicating an opening bell gain of 10 points, while the Dow was called 140 points higher. The Nasdaq, meanwhile, is looking at a more modest 40 point gain.
Benchmark 10-year Treasury note yields edged 3 basis points lower to 4.213% while two-year notes were little-changed at 4.626%.
The #PPI troughed 8 months ago, yet the economic consensus and even the #Fed believes #inflation has been conquered. Forget the forecasts for multiple rate cuts. pic.twitter.com/ZNIiKLWdFA
— Richard Bernstein Advisors (@RBAdvisors) March 14, 2024
Stock Market Today
Stocks finished lower last night, with the S&P 500 ending modestly in the red and the Nasdaq falling around 0.5%. The declines came amid an uptick in Treasury yields tied to concern that inflation pressures have failed to ease over the opening months of the year.
A better-than-expected auction of $22 billion in 30-year bonds, drawing the strongest overall demand since last June, steadied the overall market, but stocks still slipped into the close with an eye towards today's dataset.
The Commerce Department will publish its February reading of factory-gate inflation at 8:30 am Eastern Time. Analysts are expecting a slowdown in the key core reading, which feeds into the Fed's favored PCE price index.
Retail sales figures for the month are also set for an 8:30 am release as investors search for clues on consumer strength, tied to a resilient job market. Those factors could give the Fed more justification to wait until the summer months to begin the first of its three projected rate cuts.
"The case for a gradual but sustained slowdown in growth in consumers’ spending from 2023’s robust pace is persuasive," said Ian Shepherdson of Pantheon Macroeconomics.
"Most households have run down the excess savings accumulated during the pandemic, while the cost of credit has jumped and last year’s plunge in home sales has depressed demand housing-related retail items like furniture and appliances," he added.
Benchmark 10-year Treasury yields are holding steady at 4.196% heading into the start of the New York trading session, while 2-year notes were pegged at 4.628%.
With Fed officials in a quiet period, requiring no public comments ahead of next week's meeting in Washington, the U.S. dollar index is trading in a narrow range against its global peers and was last marked 0.06% higher at 102.852.
On Wall Street, futures tied to the S&P 500 are indicating an opening bell gain of around 19 points, with the Dow Jones Industrial Average indicating a 140-point advance.
The tech-focused Nasdaq, which is up 7.77% for the year, is priced for a gain of around 95 points, with Tesla (TSLA) once again sliding into the red after ending the Wednesday session at a 10-month low.
In Europe, the regionwide Stoxx 600 was marked 0.35% higher in early Frankfurt trading, while Britain's FTSE 100 slipped 0.09% in London.
Overnight in Asia, the Nikkei 225 gained 0.29% as investors looked to a key series of wage negotiation figures from key unions that are likely to see the biggest year-on-year pay increases in three decades.
The broader MSCI ex-Japan benchmark, meanwhile, rose 0.18% into the close of trading.
Related: Veteran fund manager picks favorite stocks for 2024
bonds pandemic dow jones sp 500 nasdaq ftse stocks rate cut fed federal reserve home sales white house japan europeUncategorized
Walmart and Target make key self-checkout changes to fight theft
Both chains are making changes customers may not like, but self-checkout isn’t going anywhere, according to one industry expert.
Share this:

In parts of the world, public bathrooms come with a charge, but people pay on the honor system. The money charged allows for better upkeep of the facilities and most people don't mind dropping a small bill or some coins into a lockbox and many of the people who don't are likely dealing with larger problems.
The honor system, however, requires honor. It's based on the idea that most people are trustworthy and that they will pay their fair share.
Related: Beloved mall retailer files Chapter 7 bankruptcy, will liquidate
In the case of a bathroom, people cheating the system are only stealing a low-value service. In the case of self-checkout, a variation on the honor system, people looking to steal by "forgetting" to scan an item can be a very expensive problem.
That has led retailers including Target, Walmart, and Dollar General to make changes. Target has limited the amount of items you can scan at self-checkout at some stores while Dollar General has literally eliminated it in some locations.
Walmart, like Target, has experimented with item limits and limiting the hours of operation for self-checkout. Now, in some stores, the chain has decided to designate some of its self-checkout stations for Walmart+ members and delivery drivers using the Spark app.
Advantage Solutions General Manager Andy Keenan answered some questions about Walmart, self-checkout, and theft from TheStreet via email.
Image source: John Smith/VIEWpress.
What Walmart's self-checkout changes mean
TheStreet: What are the benefits of reserving self-checkout registers for Spark drivers and Walmart+ customers?
Keenan: The benefits include exclusivity and perks of membership, speed, and convenience when shopping.
TheStreet: If this rolls out more broadly, what do you anticipate being the impact on non-Walmart+ customers?
Keenan: There is the potential for non-Walmart+ customers to become agitated, they are losing convenience because they are not enrolled. Customers who are looking for convenience will have fewer options for speed to check out.
TheStreet: Do lane restrictions like limiting lanes to 10 items or fewer help reduce time spent waiting in lines?
Keenan: Yes, but retailers must have a diverse amount of check lane options including 10 items or fewer to ensure that the speed of checkout actually transpires.
TheStreet: Do you believe self-checkout is leading to partial shrink? If so, do you think that this move to shut off self-checkout lanes will help prevent theft in the future?
Keenan: Yes, self-checkout is leading to partial shrink. We believe this tends to be more due to errors in scanning and intentional theft.
There are already front-end transformation tests going on in stores, reducing the number of self-checkouts and shifting back to cashier checkouts in order to measure the reduction in shrink. Early indicators show that a move back to cashier checkouts combined with other shrink initiatives will help prevent theft.
Self-checkout is not going away
While changes are ongoing, Keenan believes self-checkout is here to stay.
“Self-checkout is not, as one recent article called it, a failed experiment. It’s actually part of the next evolution of the retail customer experience, and evolutions take time,” Keenan said in a web post about the findings of the 2024 Advantage Shopper Outlook survey.
He makes it clear that rising labor costs and struggles to find workers make some for of self-checkout inevitable.
“Since the pandemic, there’s been a revolution on hourly labor,” Keenan said. “Labor in certain markets that would cost you $16 an hour now costs you $19 or $20 an hour, and it’s a gig economy. The people who once stood at a checkout stand in the front of a store are now driving for Instacart or DoorDash because the hours are more flexible. They want to make their own schedule, and it’s varied work. Today, most retailers can’t offer that.”
Basically, while there are kinks to work out, self-checkout simply makes sense for retailers.
“The notion that we’re going to pivot away from technology that helps offset labor needs and will ultimately continue to improve customer experience because of some challenges is far-fetched. We need to continue to embrace the technology and realize that it may always be imperfect, but it will always be evolving. The noise that, ‘Oh, self-checkout might not be working,’ that’s just a moment in time,” he added.
bankruptcy pandemicUncategorized
Hitting Home: Housing Affordability in the U.S.
The Issue:
Housing is becoming unaffordable to a widening swathe of the American population. This deteriorating affordability directly impacts American…
Share this:

The Issue:
Housing is becoming unaffordable to a widening swathe of the American population. This deteriorating affordability directly impacts American lives, including where people choose to live and work. It has also been cited as a major contributor to key social problems like rising homelessness and worsening child wellbeing.
The Facts:
- Median house prices are now 6 times the median income, up from a range of between 4 and 5 two decades ago. In cities along the coasts, the numbers are higher, exceeding 10 in San Francisco.
- The ratio of median rents to median income has also crept from 25 percent to 30 percent in two decades.
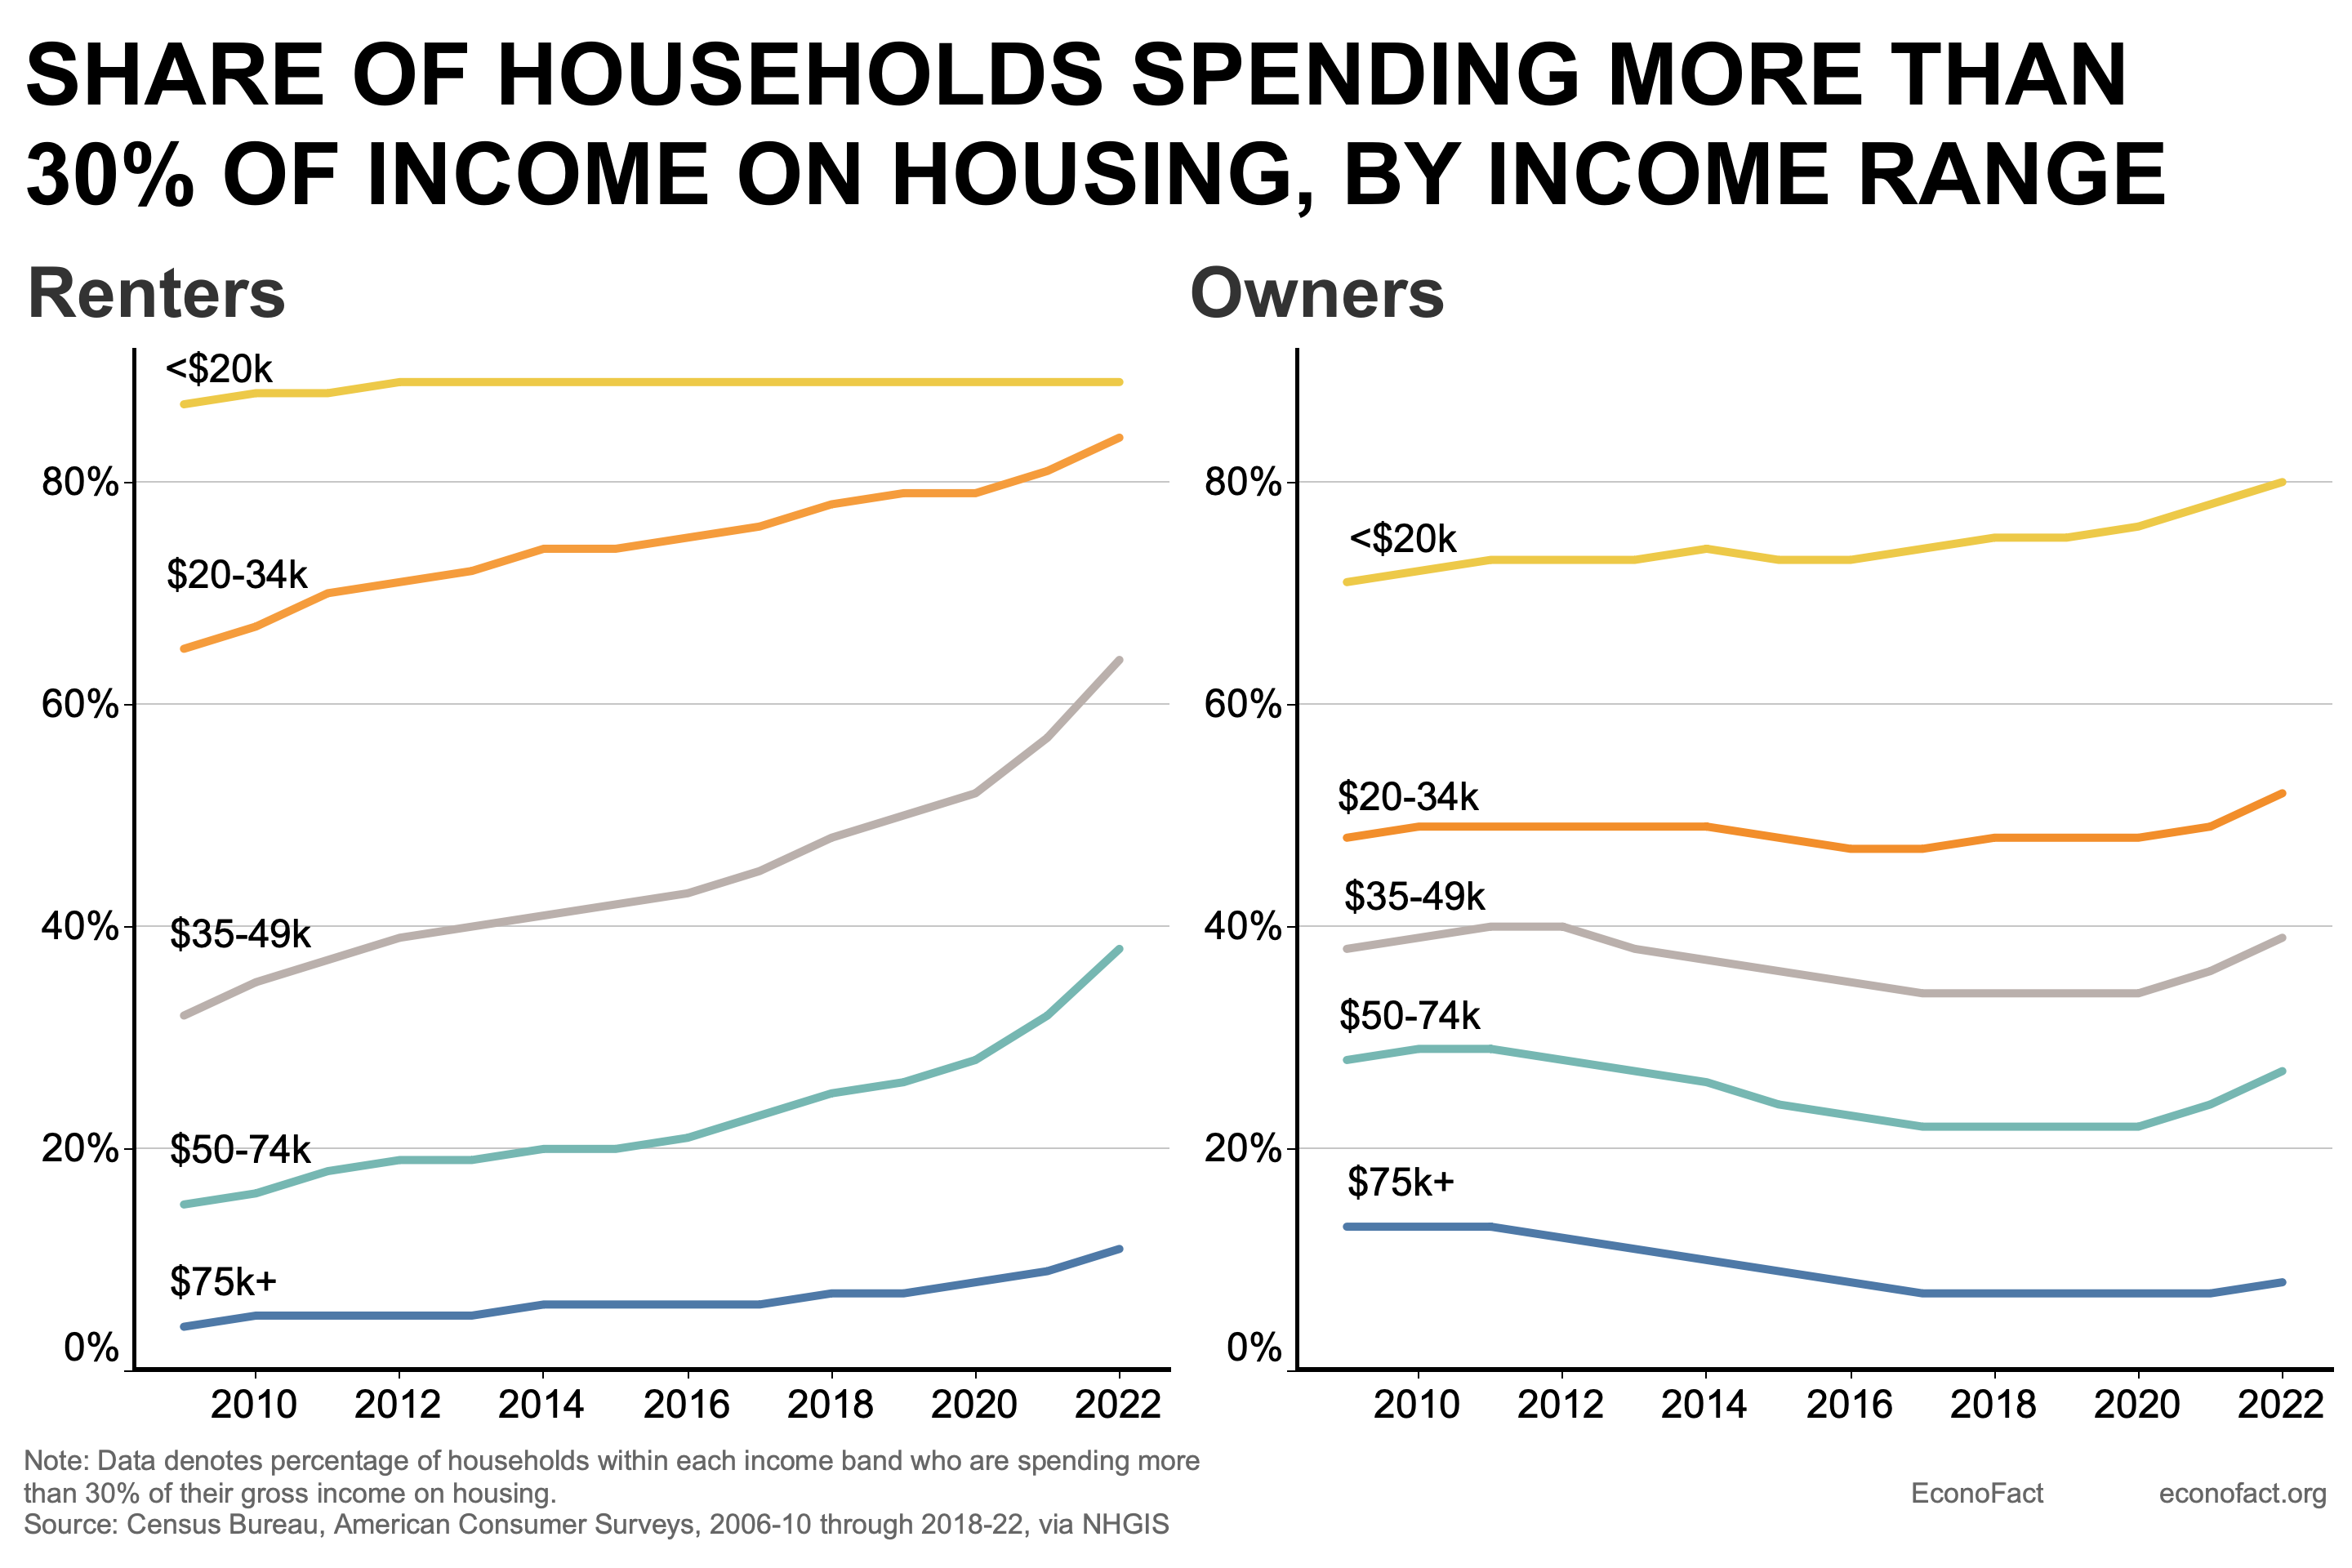
- Households — renters in particular — are increasingly cost-burdened, having to spend more than 30% of their income on rent, mortgage and other housing needs. Among homeowners, about 40 percent of those in the $35-49 income range are cost-burdened. The share of cost-burdened renters in that income range has risen sharply from under 40 percent of households in 2010 to over 60 percent today (see chart).
- Historically, rural and interior areas of the country have been more affordable. But, even prior to the pandemic, migration toward these locations has helped drive faster house price appreciation than in more expensive regions.
- Demographic developments have contributed to the demand-supply imbalance. Supply is crimped by more older Americans opting to age in place. On the demand side, the biggest driver is new household formation. Americans formed about a million new households a year between 2015-2017, but the pace has almost doubled according to the most recent data, largely reflecting a pickup in household formation rates among millennials.
- A long-standing lack of homebuilding, which partly reflects tight regulatory restrictions in many parts of the country, has also contributed to rising home prices.
- More recently, higher interest rates since 2022 have exacerbated these secular trends to make housing even more unaffordable. The mortgage rate on a 30-year home loan soared from 3 ½ percent in early 2022 to nearly 8% in October 2023 as the Fed raised policy interest rates; the mortgage rate had only eased to about 7% in March 2024 as the tightening cycle had peaked. The problem is compounded by mortgage lock-in: higher interest rates have left many homeowners — many of whom bought homes or refinanced at the lows of 2020-21 — with cheaper-than-market mortgages, reluctant to sell their house and reset their mortgage at current, higher rates.


IFM’s Hat Trick and Reflections On Option-To-Buy M&A


Q4 Update: Delinquencies, Foreclosures and REO


Net Zero, The Digital Panopticon, & The Future Of Food


Pharma industry reputation remains steady at a ‘new normal’ after Covid, Harris Poll finds


Part 1: Current State of the Housing Market; Overview for mid-March 2024


MIPIM 2024 Reflects Mixed Feelings on CRE Recovery


Riley Gaines Explains How Women’s Sports Are Rigged To Promote The Trans Agenda


Health Officials: Man Dies From Bubonic Plague In New Mexico


The SNF Institute for Global Infectious Disease Research announces new advisory board


Trump nearly derailed democracy once − here’s what to watch out for in reelection campaign
-

 Uncategorized3 weeks ago
All Of The Elements Are In Place For An Economic Crisis Of Staggering Proportions
-

 International6 days ago
EyePoint poaches medical chief from Apellis; Sandoz CFO, longtime BioNTech exec to retire
-

 Uncategorized4 weeks ago
California Counties Could Be Forced To Pay $300 Million To Cover COVID-Era Program
-

 Uncategorized3 weeks ago
Apparel Retailer Express Moving Toward Bankruptcy
-

 Uncategorized4 weeks ago
Industrial Production Decreased 0.1% in January
-

 International6 days ago
Walmart launches clever answer to Target’s new membership program
-

 Uncategorized4 weeks ago
RFK Jr: The Wuhan Cover-Up & The Rise Of The Biowarfare-Industrial Complex
-

 Uncategorized3 weeks ago
GOP Efforts To Shore Up Election Security In Swing States Face Challenges