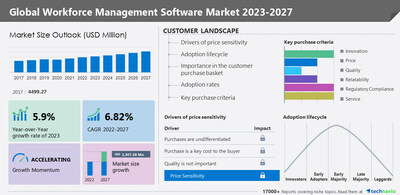
NEW YORK, Feb. 7, 2023 /PRNewswire/ -- According to Technavio, the global workforce management software market size is estimated to grow by USD 2,307.38 million from 2022 to 2027. The market is estimated to grow at a CAGR of 6.82%. Moreover, the growth momentum will accelerate. North America will account for 36% of the market's growth during the forecast period. The report provides a comprehensive analysis of growth opportunities at regional levels, new product launches, the latest trends, and the post-pandemic recovery of the global market. For more insights on the market, request a sample report
Workforce management software market - Five forces
The global workforce management software market is fragmented, and the five forces analysis covers–
- Bargaining power of buyers
- The threat of new entrants
- Threat of rivalry
- Bargaining power of suppliers
- Threat of substitutes
- For an interpretation of Porter's five forces model – buy the report!
Workforce management software market – Customer landscape
The report includes the market's adoption lifecycle, from the innovator's stage to the laggard's stage. It focuses on adoption rates in different regions based on penetration. Furthermore, the report also includes key purchase criteria and drivers of price sensitivity to help companies evaluate and develop their growth strategies.
Workforce management software market - Segmentation assessment
Segment overview
Technavio has segmented the market based on deployment (cloud based and on-premise) and end-user (IT and telecom, BFSI, healthcare, manufacturing, and others).
- The cloud-based segment will account for a significant share of the market growth during the forecast period. Cloud-based workforce management solutions gather, store, and provide global information from a unified point of access, which is driving the growth of this segment. Cloud-based applications help enterprises to ensure reliability, gain visibility, and accommodate unique HR business requirements across the world.
Geography overview
Based on geography, the global workforce management software market is segmented into North America, Europe, APAC, Middle East and Africa, and South America. The report provides actionable insights and estimates the contribution of all regions to the growth of the global workforce management software market.
- North America is estimated to account for 36% of the growth of the global market during the forecast period. This growth is attributed to factors such as improved penetration of social media and high demand for cost-efficient HR solutions. Organizations use workforce management software to manage their workforce and help them drive innovation, growth, and profit. Moreover, the use of mobile applications for workforce management is increasing in the US. Such solutions enhance the performance of organizations.
Download a sample report
Workforce management software market – Market dynamics
Key factor driving market growth
- The need for regulatory compliance is driving the market growth.
- Large organizations need to comply with the regulations enacted in the countries where they operate as well as international regulations.
- According to the FDA and ISO, companies have to implement and document employee activities.
- Most vendors, such as ADP, offer compliance management feature that is integrated with workforce management software. It is easy to use, which helps companies attain and sustain compliance every year.
- Therefore, regulatory compliance is expected to fuel the growth of the global workforce management software market during the forecast period.
Leading trends influencing the market
- The rising adoption of digital HR technology is a key trend in the market.
- Organizations are digitalizing HR processes and systems with the help of new digital platforms.
- Mobile apps, social media, analytics, and the cloud are some of the key digital technologies.
- Integrated apps provide HRM features such as time and attendance management, appointment and meeting reminders, and on-demand video learning.
- The workforce management software also includes features required for the digital transformation of HR processes.
- Thus, organizations are adopting workforce management software in their HR operations to improve the employee experience.
Major challenges hindering the market growth
- High implementation and maintenance costs are challenging the market growth.
- The price of workforce management software includes the software licensing price, system designing and customization cost, implementation cost, training cost, and maintenance cost.
- Organizations also need to hire IT staff for the implementation of the software.
- In addition, they need to train their employees on the use of the application.
- Continuous upgrades are also required to keep pace with the current market trends.
Drivers, trends, and challenges have an impact on market dynamics, which can impact businesses. Find more insights in a sample report!
What are the key data covered in this workforce management software market report?
- CAGR of the market during the forecast period
- Detailed information on factors that will drive the growth of the workforce management software market between 2023 and 2027
- Precise estimation of the size of the workforce management software market and its contribution to the parent market
- Accurate predictions about upcoming trends and changes in consumer behavior
- Growth of the workforce management software market across North America, Europe, APAC, Middle East and Africa, and South America
- A thorough analysis of the market's competitive landscape and detailed information about vendors
- Comprehensive analysis of factors that will challenge the growth of workforce management software market vendors
Gain instant access to 17,000+ market research reports.
Technavio's SUBSCRIPTION platform
Related Reports:
The API management market size is expected to increase by USD 6.70 billion from 2021 to 2026, and the market's growth momentum will accelerate at a CAGR of 20.56 %. Furthermore, this report extensively covers market segmentation by deployment (cloud and on-premise) and Geography (North America, APAC, Europe, South America, and the Middle East and Africa).
The property management market is estimated to grow at a CAGR of 2.73% between 2022 and 2027. The size of the market is forecasted to increase by USD 49.45 billion. This report extensively covers market segmentation by application (construction and real estate, government, retail, hospitality, and others), deployment (cloud-based and on-premise), and geography (North America, Europe, APAC, South America, and the Middle East and Africa).
Workforce Management Software Market Scope
|
Report Coverage
| Details
|
Page number
| 179
|
Base year
| 2022
|
Historic period
| 2017-2021
|
Forecast period
| 2023-2027
|
Growth momentum & CAGR
| Accelerate at a CAGR of 6.82%
|
Market growth 2023-2027
| USD 2,307.38 million
|
Market structure
| Fragmented
|
YoY growth 2022-2023 (%)
| 5.9
|
Regional analysis
| North America, Europe, APAC, Middle East and Africa, and South America
|
Performing market contribution
| North America at 36%
|
Key countries
| US, Canada, China, UK, and Germany
|
Competitive landscape
| Leading vendors, market positioning of vendors, competitive strategies, and industry risks
|
Key companies profiled
| ATOSS Software AG, Automatic Data Processing Inc., Bamboo HR LLC, Blue Yonder Group Inc., Ceridian HCM Holding Inc., International Business Machines Corp., Koch Industries Inc., Kronos Inc., NICE Ltd., Oracle Corp., Paycor Inc., Performly International Inc., Reflexis Systems Inc., Rippling People Center Inc., Sage Group Plc, SAP SE, UKG Inc., Verint Systems Inc., Workday Inc., and Zoho Corp. Pvt. Ltd.
|
Market dynamics
| Parent market analysis, market growth inducers and obstacles, fast-growing and slow-growing segment analysis, COVID-19 impact and recovery analysis and future consumer dynamics, and market condition analysis for the forecast period.
|
Customization purview
| If our report has not included the data that you are looking for, you can reach out to our analysts and get segments customized.
|
Browse for Technavio's information technology market reports
Table of contents
1 Executive Summary
- 1.1 Market overview
- Exhibit 01: Executive Summary – Chart on Market Overview
- Exhibit 02: Executive Summary – Data Table on Market Overview
- Exhibit 03: Executive Summary – Chart on Global Market Characteristics
- Exhibit 04: Executive Summary – Chart on Market by Geography
- Exhibit 05: Executive Summary – Chart on Market Segmentation by Deployment
- Exhibit 06: Executive Summary – Chart on Market Segmentation by End-user
- Exhibit 07: Executive Summary – Chart on Incremental Growth
- Exhibit 08: Executive Summary – Data Table on Incremental Growth
- Exhibit 09: Executive Summary – Chart on Vendor Market Positioning
2 Market Landscape
- 2.1 Market ecosystem
- Exhibit 10: Parent market
- Exhibit 11: Market Characteristics
3 Market Sizing
- 3.1 Market definition
- Exhibit 12: Offerings of vendors included in the market definition
- 3.2 Market segment analysis
- Exhibit 13: Market segments
- 3.4 Market outlook: Forecast for 2022-2027
- Exhibit 14: Chart on Global - Market size and forecast 2022-2027 ($ million)
- Exhibit 15: Data Table on Global - Market size and forecast 2022-2027 ($ million)
- Exhibit 16: Chart on Global Market: Year-over-year growth 2022-2027 (%)
- Exhibit 17: Data Table on Global Market: Year-over-year growth 2022-2027 (%)
4 Historic Market Size
- 4.1 Global workforce management software market 2017 - 2021
- Exhibit 18: Historic Market Size – Data Table on Global workforce management software market 2017 - 2021 ($ million)
- 4.2 Deployment Segment Analysis 2017 - 2021
- Exhibit 19: Historic Market Size – Deployment Segment 2017 - 2021 ($ million)
- 4.3 End-user Segment Analysis 2017 - 2021
- Exhibit 20: Historic Market Size – End-user Segment 2017 - 2021 ($ million)
- 4.4 Geography Segment Analysis 2017 - 2021
- Exhibit 21: Historic Market Size – Geography Segment 2017 - 2021 ($ million)
- 4.5 Country Segment Analysis 2017 - 2021
- Exhibit 22: Historic Market Size – Country Segment 2017 - 2021 ($ million)
5 Five Forces Analysis
- 5.1 Five forces summary
- Exhibit 23: Five forces analysis - Comparison between 2022 and 2027
- 5.2 Bargaining power of buyers
- Exhibit 24: Chart on Bargaining power of buyers – Impact of key factors 2022 and 2027
- 5.3 Bargaining power of suppliers
- Exhibit 25: Bargaining power of suppliers – Impact of key factors in 2022 and 2027
- 5.4 Threat of new entrants
- Exhibit 26: Threat of new entrants – Impact of key factors in 2022 and 2027
- 5.5 Threat of substitutes
- Exhibit 27: Threat of substitutes – Impact of key factors in 2022 and 2027
- 5.6 Threat of rivalry
- Exhibit 28: Threat of rivalry – Impact of key factors in 2022 and 2027
- 5.7 Market condition
- Exhibit 29: Chart on Market condition - Five forces 2022 and 2027
6 Market Segmentation by Deployment
- 6.1 Market segments
- Exhibit 30: Chart on Deployment - Market share 2022-2027 (%)
- Exhibit 31: Data Table on Deployment - Market share 2022-2027 (%)
- 6.2 Comparison by Deployment
- Exhibit 32: Chart on Comparison by Deployment
- Exhibit 33: Data Table on Comparison by Deployment
- 6.3 Cloud based - Market size and forecast 2022-2027
- Exhibit 34: Chart on Cloud based - Market size and forecast 2022-2027 ($ million)
- Exhibit 35: Data Table on Cloud based - Market size and forecast 2022-2027 ($ million)
- Exhibit 36: Chart on Cloud based - Year-over-year growth 2022-2027 (%)
- Exhibit 37: Data Table on Cloud based - Year-over-year growth 2022-2027 (%)
- 6.4 On-premise - Market size and forecast 2022-2027
- Exhibit 38: Chart on On-premise - Market size and forecast 2022-2027 ($ million)
- Exhibit 39: Data Table on On-premise - Market size and forecast 2022-2027 ($ million)
- Exhibit 40: Chart on On-premise - Year-over-year growth 2022-2027 (%)
- Exhibit 41: Data Table on On-premise - Year-over-year growth 2022-2027 (%)
- 6.5 Market opportunity by Deployment
- Exhibit 42: Market opportunity by Deployment ($ million)
7 Market Segmentation by End-user
- 7.1 Market segments
- Exhibit 43: Chart on End-user - Market share 2022-2027 (%)
- Exhibit 44: Data Table on End-user - Market share 2022-2027 (%)
- 7.2 Comparison by End-user
- Exhibit 45: Chart on Comparison by End-user
- Exhibit 46: Data Table on Comparison by End-user
- 7.3 IT and telecom - Market size and forecast 2022-2027
- Exhibit 47: Chart on IT and telecom - Market size and forecast 2022-2027 ($ million)
- Exhibit 48: Data Table on IT and telecom - Market size and forecast 2022-2027 ($ million)
- Exhibit 49: Chart on IT and telecom - Year-over-year growth 2022-2027 (%)
- Exhibit 50: Data Table on IT and telecom - Year-over-year growth 2022-2027 (%)
- 7.4 BFSI - Market size and forecast 2022-2027
- Exhibit 51: Chart on BFSI - Market size and forecast 2022-2027 ($ million)
- Exhibit 52: Data Table on BFSI - Market size and forecast 2022-2027 ($ million)
- Exhibit 53: Chart on BFSI - Year-over-year growth 2022-2027 (%)
- Exhibit 54: Data Table on BFSI - Year-over-year growth 2022-2027 (%)
- 7.5 Healthcare - Market size and forecast 2022-2027
- Exhibit 55: Chart on Healthcare - Market size and forecast 2022-2027 ($ million)
- Exhibit 56: Data Table on Healthcare - Market size and forecast 2022-2027 ($ million)
- Exhibit 57: Chart on Healthcare - Year-over-year growth 2022-2027 (%)
- Exhibit 58: Data Table on Healthcare - Year-over-year growth 2022-2027 (%)
- 7.6 Manufacturing - Market size and forecast 2022-2027
- Exhibit 59: Chart on Manufacturing - Market size and forecast 2022-2027 ($ million)
- Exhibit 60: Data Table on Manufacturing - Market size and forecast 2022-2027 ($ million)
- Exhibit 61: Chart on Manufacturing - Year-over-year growth 2022-2027 (%)
- Exhibit 62: Data Table on Manufacturing - Year-over-year growth 2022-2027 (%)
- 7.7 Others - Market size and forecast 2022-2027
- Exhibit 63: Chart on Others - Market size and forecast 2022-2027 ($ million)
- Exhibit 64: Data Table on Others - Market size and forecast 2022-2027 ($ million)
- Exhibit 65: Chart on Others - Year-over-year growth 2022-2027 (%)
- Exhibit 66: Data Table on Others - Year-over-year growth 2022-2027 (%)
- 7.8 Market opportunity by End-user
- Exhibit 67: Market opportunity by End-user ($ million)
8 Customer Landscape
- 8.1 Customer landscape overview
- Exhibit 68: Analysis of price sensitivity, lifecycle, customer purchase basket, adoption rates, and purchase criteria
9 Geographic Landscape
- 9.1 Geographic segmentation
- Exhibit 69: Chart on Market share by geography 2022-2027 (%)
- Exhibit 70: Data Table on Market share by geography 2022-2027 (%)
- 9.2 Geographic comparison
- Exhibit 71: Chart on Geographic comparison
- Exhibit 72: Data Table on Geographic comparison
- 9.3 North America - Market size and forecast 2022-2027
- Exhibit 73: Chart on North America - Market size and forecast 2022-2027 ($ million)
- Exhibit 74: Data Table on North America - Market size and forecast 2022-2027 ($ million)
- Exhibit 75: Chart on North America - Year-over-year growth 2022-2027 (%)
- Exhibit 76: Data Table on North America - Year-over-year growth 2022-2027 (%)
- 9.4 Europe - Market size and forecast 2022-2027
- Exhibit 77: Chart on Europe - Market size and forecast 2022-2027 ($ million)
- Exhibit 78: Data Table on Europe - Market size and forecast 2022-2027 ($ million)
- Exhibit 79: Chart on Europe - Year-over-year growth 2022-2027 (%)
- Exhibit 80: Data Table on Europe - Year-over-year growth 2022-2027 (%)
- 9.5 APAC - Market size and forecast 2022-2027
- Exhibit 81: Chart on APAC - Market size and forecast 2022-2027 ($ million)
- Exhibit 82: Data Table on APAC - Market size and forecast 2022-2027 ($ million)
- Exhibit 83: Chart on APAC - Year-over-year growth 2022-2027 (%)
- Exhibit 84: Data Table on APAC - Year-over-year growth 2022-2027 (%)
- 9.6 Middle East and Africa - Market size and forecast 2022-2027
- Exhibit 85: Chart on Middle East and Africa - Market size and forecast 2022-2027 ($ million)
- Exhibit 86: Data Table on Middle East and Africa - Market size and forecast 2022-2027 ($ million)
- Exhibit 87: Chart on Middle East and Africa - Year-over-year growth 2022-2027 (%)
- Exhibit 88: Data Table on Middle East and Africa - Year-over-year growth 2022-2027 (%)
- 9.7 South America - Market size and forecast 2022-2027
- Exhibit 89: Chart on South America - Market size and forecast 2022-2027 ($ million)
- Exhibit 90: Data Table on South America - Market size and forecast 2022-2027 ($ million)
- Exhibit 91: Chart on South America - Year-over-year growth 2022-2027 (%)
- Exhibit 92: Data Table on South America - Year-over-year growth 2022-2027 (%)
- 9.8 US - Market size and forecast 2022-2027
- Exhibit 93: Chart on US - Market size and forecast 2022-2027 ($ million)
- Exhibit 94: Data Table on US - Market size and forecast 2022-2027 ($ million)
- Exhibit 95: Chart on US - Year-over-year growth 2022-2027 (%)
- Exhibit 96: Data Table on US - Year-over-year growth 2022-2027 (%)
- 9.9 China - Market size and forecast 2022-2027
- Exhibit 97: Chart on China - Market size and forecast 2022-2027 ($ million)
- Exhibit 98: Data Table on China - Market size and forecast 2022-2027 ($ million)
- Exhibit 99: Chart on China - Year-over-year growth 2022-2027 (%)
- Exhibit 100: Data Table on China - Year-over-year growth 2022-2027 (%)
- 9.10 UK - Market size and forecast 2022-2027
- Exhibit 101: Chart on UK - Market size and forecast 2022-2027 ($ million)
- Exhibit 102: Data Table on UK - Market size and forecast 2022-2027 ($ million)
- Exhibit 103: Chart on UK - Year-over-year growth 2022-2027 (%)
- Exhibit 104: Data Table on UK - Year-over-year growth 2022-2027 (%)
- 9.11 Canada - Market size and forecast 2022-2027
- Exhibit 105: Chart on Canada - Market size and forecast 2022-2027 ($ million)
- Exhibit 106: Data Table on Canada - Market size and forecast 2022-2027 ($ million)
- Exhibit 107: Chart on Canada - Year-over-year growth 2022-2027 (%)
- Exhibit 108: Data Table on Canada - Year-over-year growth 2022-2027 (%)
- 9.12 Germany - Market size and forecast 2022-2027
- Exhibit 109: Chart on Germany - Market size and forecast 2022-2027 ($ million)
- Exhibit 110: Data Table on Germany - Market size and forecast 2022-2027 ($ million)
- Exhibit 111: Chart on Germany - Year-over-year growth 2022-2027 (%)
- Exhibit 112: Data Table on Germany - Year-over-year growth 2022-2027 (%)
- 9.13 Market opportunity by geography
- Exhibit 113: Market opportunity by geography ($ million)
10 Drivers, Challenges, and Trends
- 10.3 Impact of drivers and challenges
- Exhibit 114: Impact of drivers and challenges in 2022 and 2027
11 Vendor Landscape
- 11.2 Vendor landscape
- Exhibit 115: Overview on Criticality of inputs and Factors of differentiation
- 11.3 Landscape disruption
- Exhibit 116: Overview on factors of disruption
- 11.4 Industry risks
- Exhibit 117: Impact of key risks on business
12 Vendor Analysis
- 12.1 Vendors covered
- Exhibit 118: Vendors covered
- 12.2 Market positioning of vendors
- Exhibit 119: Matrix on vendor position and classification
- 12.3 Automatic Data Processing Inc.
- Exhibit 120: Automatic Data Processing Inc. - Overview
- Exhibit 121: Automatic Data Processing Inc. - Business segments
- Exhibit 122: Automatic Data Processing Inc. - Key news
- Exhibit 123: Automatic Data Processing Inc. - Key offerings
- Exhibit 124: Automatic Data Processing Inc. - Segment focus
- 12.4 Bamboo HR LLC
- Exhibit 125: Bamboo HR LLC - Overview
- Exhibit 126: Bamboo HR LLC - Product / Service
- Exhibit 127: Bamboo HR LLC - Key offerings
- 12.5 Blue Yonder Group Inc.
- Exhibit 128: Blue Yonder Group Inc. - Overview
- Exhibit 129: Blue Yonder Group Inc. - Product / Service
- Exhibit 130: Blue Yonder Group Inc. - Key offerings
- 12.6 Ceridian HCM Holding Inc.
- Exhibit 131: Ceridian HCM Holding Inc. - Overview
- Exhibit 132: Ceridian HCM Holding Inc. - Product / Service
- Exhibit 133: Ceridian HCM Holding Inc. - Key news
- Exhibit 134: Ceridian HCM Holding Inc. - Key offerings
- 12.7 International Business Machines Corp.
- Exhibit 135: International Business Machines Corp. - Overview
- Exhibit 136: International Business Machines Corp. - Business segments
- Exhibit 137: International Business Machines Corp. - Key news
- Exhibit 138: International Business Machines Corp. - Key offerings
- Exhibit 139: International Business Machines Corp. - Segment focus
- 12.8 Koch Industries Inc.
- Exhibit 140: Koch Industries Inc. - Overview
- Exhibit 141: Koch Industries Inc. - Product / Service
- Exhibit 142: Koch Industries Inc. - Key news
- Exhibit 143: Koch Industries Inc. - Key offerings
- 12.9 NICE Ltd.
- Exhibit 144: NICE Ltd. - Overview
- Exhibit 145: NICE Ltd. - Business segments
- Exhibit 146: NICE Ltd. - Key news
- Exhibit 147: NICE Ltd. - Key offerings
- Exhibit 148: NICE Ltd. - Segment focus
- 12.10 Oracle Corp.
- Exhibit 149: Oracle Corp. - Overview
- Exhibit 150: Oracle Corp. - Business segments
- Exhibit 151: Oracle Corp. - Key news
- Exhibit 152: Oracle Corp. - Key offerings
- Exhibit 153: Oracle Corp. - Segment focus
- 12.11 Paycor Inc.
- Exhibit 154: Paycor Inc. - Overview
- Exhibit 155: Paycor Inc. - Product / Service
- Exhibit 156: Paycor Inc. - Key offerings
- 12.12 Performly International Inc.
- Exhibit 157: Performly International Inc. - Overview
- Exhibit 158: Performly International Inc. - Product / Service
- Exhibit 159: Performly International Inc. - Key offerings
- 12.13 Reflexis Systems Inc.
- Exhibit 160: Reflexis Systems Inc. - Overview
- Exhibit 161: Reflexis Systems Inc. - Product / Service
- Exhibit 162: Reflexis Systems Inc. - Key offerings
- 12.14 Sage Group Plc
- Exhibit 163: Sage Group Plc - Overview
- Exhibit 164: Sage Group Plc - Business segments
- Exhibit 165: Sage Group Plc - Key news
- Exhibit 166: Sage Group Plc - Key offerings
- Exhibit 167: Sage Group Plc - Segment focus
- 12.15 SAP SE
- Exhibit 168: SAP SE - Overview
- Exhibit 169: SAP SE - Business segments
- Exhibit 170: SAP SE - Key news
- Exhibit 171: SAP SE - Key offerings
- Exhibit 172: SAP SE - Segment focus
- 12.16 Workday Inc.
- Exhibit 173: Workday Inc. - Overview
- Exhibit 174: Workday Inc. - Product / Service
- Exhibit 175: Workday Inc. - Key offerings
- 12.17 Zoho Corp. Pvt. Ltd.
- Exhibit 176: Zoho Corp. Pvt. Ltd. - Overview
- Exhibit 177: Zoho Corp. Pvt. Ltd. - Product / Service
- Exhibit 178: Zoho Corp. Pvt. Ltd. - Key offerings
13 Appendix
- 13.2 Inclusions and exclusions checklist
- Exhibit 179: Inclusions checklist
- Exhibit 180: Exclusions checklist
- 13.3 Currency conversion rates for US$
- Exhibit 181: Currency conversion rates for US$
- 13.4 Research methodology
- Exhibit 182: Research methodology
- Exhibit 183: Validation techniques employed for market sizing
- Exhibit 184: Information sources
- 13.5 List of abbreviations
- Exhibit 185: List of abbreviations
About Us
Technavio is a leading global technology research and advisory company. Their research and analysis focus on emerging market trends and provide actionable insights to help businesses identify market opportunities and develop effective strategies to optimize their market positions. With over 500 specialized analysts, Technavio's report library consists of more than 17,000 reports and counting, covering 800 technologies, spanning across 50 countries. Their client base consists of enterprises of all sizes, including more than 100 Fortune 500 companies. This growing client base relies on Technavio's comprehensive coverage, extensive research, and actionable market insights to identify opportunities in existing and potential markets and assess their competitive positions within changing market scenarios.
Contact
Technavio Research
Jesse Maida
Media & Marketing Executive
US: +1 844 364 1100
UK: +44 203 893 3200
Email: media@technavio.com
Website: www.technavio.com/
View original content to download multimedia:https://www.prnewswire.com/news-releases/workforce-management-software-market-2023-2027-a-descriptive-analysis-of-five-forces-model-market-dynamics-and-segmentation---technavio-301739258.html
SOURCE Technavio

")


