Will hotter inflation data trigger more rate hikes?
CPI inflation came in hotter than expected and people are scared the Fed will now be more aggressive with rate hikes. Should you be worried?
The post Will…
On Thursday, the Bureau of Labor Statistics (BLS) reported that Consumer Price Index (CPI) inflation came in hotter than expected, and people are scared that the Federal Reserve will now be more aggressive with their rate hikes. Personally, I believe the Fed knows that rental inflation data can lag so at this point of the rate hike cycle, they won’t act in a more aggressive fashion. Here’s why.
The extra heat of this report was primarily due to how hot shelter inflation has been coming in on the data line. I recently discussed how shelter inflation has legs in 2022 but should change in 2023 on the CPI reports. The way BLS accounts for shelter inflation has a noticeable lag to more recent data.
From BLS: The Consumer Price Index for All Urban Consumers (CPI-U) rose 0.4 percent in September on a seasonally adjusted basis after rising 0.1 percent in August, the U.S. Bureau of Labor Statistics reported today. Over the last 12 months, the all items index increased 8.2 percent before seasonal adjustment. Increases in the shelter, food, and medical care indexes were the largest of many contributors to the monthly seasonally adjusted all items increase.
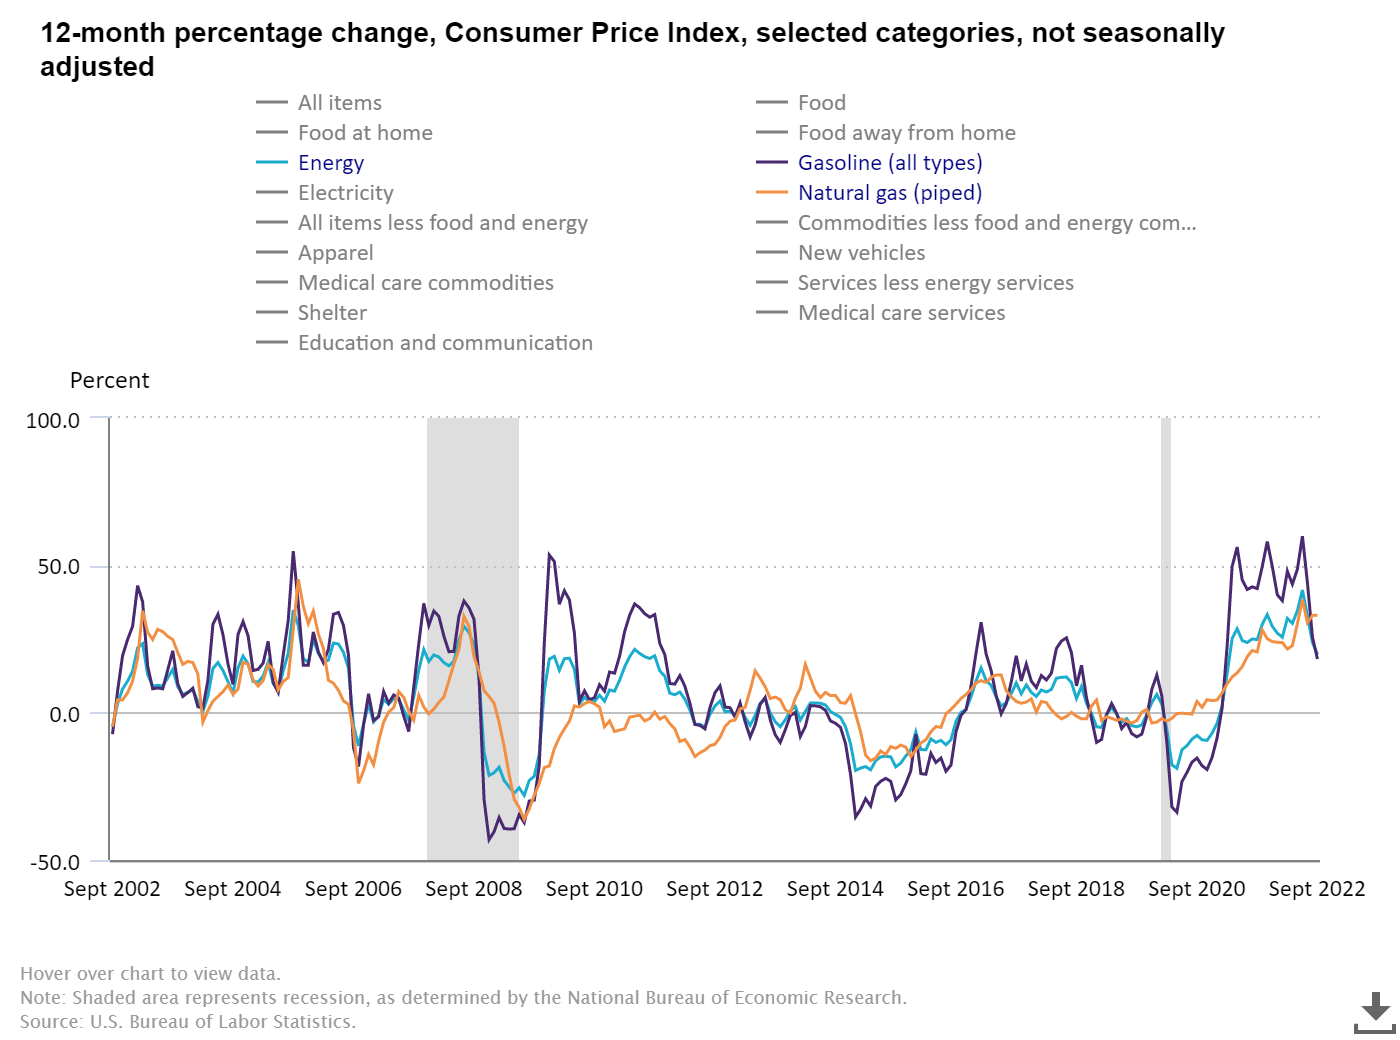
Headline inflation has been dropping recently from its peak, which is primarily due to the decline in oil and gas prices, as you can see in the chart below.
Shelter inflation has recently given core inflation the legs to stay firm and head higher. This is why we have some divergence between core inflation and headline inflation. Core Inflation excludes energy and food prices because they can be very volatile.
Shelter inflation is roughly 43% of the component of core CPI, so it’s a big deal. In the previous expansion, it was very steady, with no real break away with shelter inflation. Shelter inflation never hit 4% in the previous expansion. However, as we can see, like everything else post-COVID-19, things are different on the inflation side of the equation. The very brief pullback in shelter inflation was not only reversed but it was reversed in a historical fashion.
This should not surprise anyone because housing inflation has been the main story since 2020. Rent inflation is cooling down but it will not show up on the CPI data line until the middle of next year. Last month on CNBC, I talked about this topic and how the growth rate will cool, but it’s a 2023 story.
“Core inflation could stick over 2% faster and longer in this expansion because shelter inflation should pick up. If we do really see wage growth at the bottom end, landlords will ask for more rent.”
– Logan Mohtashami
During the summer of 2020, when shelter inflation was falling and people were saying cities are dead and rent inflation is going to fall more, I was in the camp that shelter inflation was already growing and had the potential to really grow. A lot of Americans had already gotten their jobs back and the rest were getting checks, so shelter inflation had the potential to go higher.
Back in the summer of 2020, the data line was still heading lower, but that data line lagged the current reality. It’s the exact case now as rent inflation is cooling down, but it won’t show up in the CPI data until late
My quote to The Washington Post early in 2021: “Core inflation could stick over 2% faster and longer in this expansion because shelter inflation should pick up. If we do really see wage growth at the bottom end, landlords will ask for more rent.”
Just as the S&P CoreLogic Case Shiller Home Price data lags the current market, shelter inflation lags on the CPI.
Shelter inflation is not that complicated to understand. Rental vacancy data has been falling for decades, and rent inflation has been growing. Just like home prices, we got caught in a bad place with supply so shelter inflation blasted off.
As you can see below, rent inflation took off like home prices did. Having shelter inflation go negative is rare because most Americans are always working and paying their rent on time. However, rent inflation since 2020 has been historic and it has been savagely unhealthy regarding housing inflation.
However, looking to the future, this data line should be cooling down, especially in the second half of 2023, when the comps will be hard to work from. More multifamily construction is coming online which means we will have more supply of rental units. The best way to deal with inflation is more supply. Even as wage inflation has been taking off, more supply will always cool down inflation.
Super high rent growth can’t be super hot forever because wages simply can’t keep pace with the double-digit rent growth we have seen in certain parts of the U.S. Eventually, hotter inflation data kills demand; we see this with the massive home-price gains we have seen in the U.S. post-2020; once rates broke over 4% and headed higher, demand got impacted.
Of course, homeowners who have a fixed payment and refinanced recently have increased their wages without the pain of rent inflation hitting them. This is why some people refer to a fixed mortgage payment as a hedge against inflation. Imagine all those homeowners who refinanced to mortgage rates below 4% — they’re not dealing with high rent inflation, but their wages are growing faster. Almost 65% of all Americans have mortgage rates 4% and below, so that is a significant portion of the country. And of course, more than 40% of homes in the U.S. don’t have a mortgage to deal with at all.
While inflation is still a problem and shelter inflation is in the driver’s seat on the CPI reports, I believe, for the most part, people understand that the CPI shelter data lags — it is not as hot as it looks in the data right now. However, we do need to wait until mid-2023 and toward the end of next year to see it show up in the CPI report, which can lower the growth rate of core inflation.
Financial markets initially had a very negative response to the data, and the 10-year yield shot up well above 4% in early trading on Thursday, with the markets down, only to reverse course later in the day.
We still have a long way to go to get down to the 2% inflation that the Fed is comfortable with. However, in 2023, these hot shelter prints should cool down. As more supply hits the market in the coming months, the growth rate will be brutal to maintain — we already see this in other data lines.
This is very important for the housing market because if the growth rate of the biggest driver of inflation is fading, that means the rise in mortgage rates is coming to an end and maybe we can have a more steady move lower in rates next year.
BUFFALO, NY- March 11, 2024 – Impact Journals publishes scholarly journals in the biomedical sciences with a focus on all areas of cancer and aging research. Aging is one of the most prominent journals published by Impact Journals.
Credit: Impact Journals
BUFFALO, NY- March 11, 2024 – Impact Journals publishes scholarly journals in the biomedical sciences with a focus on all areas of cancer and aging research. Aging is one of the most prominent journals published by Impact Journals.
Impact Journals will be participating as an exhibitor at the American Association for Cancer Research (AACR) Annual Meeting 2024 from April 5-10 at the San Diego Convention Center in San Diego, California. This year, the AACR meeting theme is “Inspiring Science • Fueling Progress • Revolutionizing Care.”
Visit booth #4159 at the AACR Annual Meeting 2024 to connect with members of the Agingteam.
About Aging-US:
Agingpublishes research papers in all fields of aging research including but not limited, aging from yeast to mammals, cellular senescence, age-related diseases such as cancer and Alzheimer’s diseases and their prevention and treatment, anti-aging strategies and drug development and especially the role of signal transduction pathways such as mTOR in aging and potential approaches to modulate these signaling pathways to extend lifespan. The journal aims to promote treatment of age-related diseases by slowing down aging, validation of anti-aging drugs by treating age-related diseases, prevention of cancer by inhibiting aging. Cancer and COVID-19 are age-related diseases.
Agingis indexed and archived byPubMed/Medline (abbreviated as “Aging (Albany NY)”), PubMed Central, Web of Science: Science Citation Index Expanded (abbreviated as “Aging‐US” and listed in the Cell Biology and Geriatrics & Gerontology categories), Scopus (abbreviated as “Aging” and listed in the Cell Biology and Aging categories), Biological Abstracts, BIOSIS Previews, EMBASE, META (Chan Zuckerberg Initiative) (2018-2022), and Dimensions (Digital Science).
Please visit our website at www.Aging-US.com and connect with us:
NY Fed Finds Medium, Long-Term Inflation Expectations Jump Amid Surge In Stock Market Optimism
One month after the inflation outlook tracked by the NY Fed Consumer Survey extended their late 2023 slide, with 3Y inflation expectations in January sliding to a record low 2.4% (from 2.6% in December), even as 1 and 5Y inflation forecasts remained flat, moments ago the NY Fed reported that in February there was a sharp rebound in longer-term inflation expectations, rising to 2.7% from 2.4% at the three-year ahead horizon, and jumping to 2.9% from 2.5% at the five-year ahead horizon, while the 1Y inflation outlook was flat for the 3rd month in a row, stuck at 3.0%.
The increases in both the three-year ahead and five-year ahead measures were most pronounced for respondents with at most high school degrees (in other words, the "really smart folks" are expecting deflation soon). The survey’s measure of disagreement across respondents (the difference between the 75th and 25th percentile of inflation expectations) decreased at all horizons, while the median inflation uncertainty—or the uncertainty expressed regarding future inflation outcomes—declined at the one- and three-year ahead horizons and remained unchanged at the five-year ahead horizon.
Going down the survey, we find that the median year-ahead expected price changes increased by 0.1 percentage point to 4.3% for gas; decreased by 1.8 percentage points to 6.8% for the cost of medical care (its lowest reading since September 2020); decreased by 0.1 percentage point to 5.8% for the cost of a college education; and surprisingly decreased by 0.3 percentage point for rent to 6.1% (its lowest reading since December 2020), and remained flat for food at 4.9%.
We find the rent expectations surprising because it is happening just asking rents are rising across the country.
At the same time as consumers erroneously saw sharply lower rents, median home price growth expectations remained unchanged for the fifth consecutive month at 3.0%.
Turning to the labor market, the survey found that the average perceived likelihood of voluntary and involuntary job separations increased, while the perceived likelihood of finding a job (in the event of a job loss) declined. "The mean probability of leaving one’s job voluntarily in the next 12 months also increased, by 1.8 percentage points to 19.5%."
Mean unemployment expectations - or the mean probability that the U.S. unemployment rate will be higher one year from now - decreased by 1.1 percentage points to 36.1%, the lowest reading since February 2022. Additionally, the median one-year-ahead expected earnings growth was unchanged at 2.8%, remaining slightly below its 12-month trailing average of 2.9%.
Turning to household finance, we find the following:
The median expected growth in household income remained unchanged at 3.1%. The series has been moving within a narrow range of 2.9% to 3.3% since January 2023, and remains above the February 2020 pre-pandemic level of 2.7%.
Median household spending growth expectations increased by 0.2 percentage point to 5.2%. The increase was driven by respondents with a high school degree or less.
Median year-ahead expected growth in government debt increased to 9.3% from 8.9%.
The mean perceived probability that the average interest rate on saving accounts will be higher in 12 months increased by 0.6 percentage point to 26.1%, remaining below its 12-month trailing average of 30%.
Perceptions about households’ current financial situations deteriorated somewhat with fewer respondents reporting being better off than a year ago. Year-ahead expectations also deteriorated marginally with a smaller share of respondents expecting to be better off and a slightly larger share of respondents expecting to be worse off a year from now.
The mean perceived probability that U.S. stock prices will be higher 12 months from now increased by 1.4 percentage point to 38.9%.
At the same time, perceptions and expectations about credit access turned less optimistic: "Perceptions of credit access compared to a year ago deteriorated with a larger share of respondents reporting tighter conditions and a smaller share reporting looser conditions compared to a year ago."
Also, a smaller percentage of consumers, 11.45% vs 12.14% in prior month, expect to not be able to make minimum debt payment over the next three months
Last, and perhaps most humorous, is the now traditional cognitive dissonance one observes with these polls, because at a time when long-term inflation expectations jumped, which clearly suggests that financial conditions will need to be tightened, the number of respondents expecting higher stock prices one year from today jumped to the highest since November 2021... which incidentally is just when the market topped out during the last cycle before suffering a painful bear market.
Homes listed for sale in early June sell for $7,700 more
New Zillow research suggests the spring home shopping season may see a second wave this summer if mortgage rates fall
The post Homes listed for sale in…
A Zillow analysis of 2023 home sales finds homes listed in the first two weeks of June sold for 2.3% more.
The best time to list a home for sale is a month later than it was in 2019, likely driven by mortgage rates.
The best time to list can be as early as the second half of February in San Francisco, and as late as the first half of July in New York and Philadelphia.
Spring home sellers looking to maximize their sale price may want to wait it out and list their home for sale in the first half of June. A new Zillow® analysis of 2023 sales found that homes listed in the first two weeks of June sold for 2.3% more, a $7,700 boost on a typical U.S. home.
The best time to list consistently had been early May in the years leading up to the pandemic. The shift to June suggests mortgage rates are strongly influencing demand on top of the usual seasonality that brings buyers to the market in the spring. This home-shopping season is poised to follow a similar pattern as that in 2023, with the potential for a second wave if the Federal Reserve lowers interest rates midyear or later.
The 2.3% sale price premium registered last June followed the first spring in more than 15 years with mortgage rates over 6% on a 30-year fixed-rate loan. The high rates put home buyers on the back foot, and as rates continued upward through May, they were still reassessing and less likely to bid boldly. In June, however, rates pulled back a little from 6.79% to 6.67%, which likely presented an opportunity for determined buyers heading into summer. More buyers understood their market position and could afford to transact, boosting competition and sale prices.
The old logic was that sellers could earn a premium by listing in late spring, when search activity hit its peak. Now, with persistently low inventory, mortgage rate fluctuations make their own seasonality. First-time home buyers who are on the edge of qualifying for a home loan may dip in and out of the market, depending on what’s happening with rates. It is almost certain the Federal Reserve will push back any interest-rate cuts to mid-2024 at the earliest. If mortgage rates follow, that could bring another surge of buyers later this year.
Mortgage rates have been impacting affordability and sale prices since they began rising rapidly two years ago. In 2022, sellers nationwide saw the highest sale premium when they listed their home in late March, right before rates barreled past 5% and continued climbing.
Zillow’s research finds the best time to list can vary widely by metropolitan area. In 2023, it was as early as the second half of February in San Francisco, and as late as the first half of July in New York. Thirty of the top 35 largest metro areas saw for-sale listings command the highest sale prices between May and early July last year.
Zillow also found a wide range in the sale price premiums associated with homes listed during those peak periods. At the hottest time of the year in San Jose, homes sold for 5.5% more, a $88,000 boost on a typical home. Meanwhile, homes in San Antonio sold for 1.9% more during that same time period.
We use cookies on our website to give you the most relevant experience by remembering your preferences and repeat visits. By clicking “Accept”, you consent to the use of ALL the cookies.
This website uses cookies to improve your experience while you navigate through the website. Out of these, the cookies that are categorized as necessary are stored on your browser as they are essential for the working of basic functionalities of the website. We also use third-party cookies that help us analyze and understand how you use this website. These cookies will be stored in your browser only with your consent. You also have the option to opt-out of these cookies. But opting out of some of these cookies may affect your browsing experience.
Necessary cookies are absolutely essential for the website to function properly. These cookies ensure basic functionalities and security features of the website, anonymously.
Cookie
Duration
Description
cookielawinfo-checbox-analytics
11 months
This cookie is set by GDPR Cookie Consent plugin. The cookie is used to store the user consent for the cookies in the category "Analytics".
cookielawinfo-checbox-functional
11 months
The cookie is set by GDPR cookie consent to record the user consent for the cookies in the category "Functional".
cookielawinfo-checbox-others
11 months
This cookie is set by GDPR Cookie Consent plugin. The cookie is used to store the user consent for the cookies in the category "Other.
cookielawinfo-checkbox-necessary
11 months
This cookie is set by GDPR Cookie Consent plugin. The cookies is used to store the user consent for the cookies in the category "Necessary".
cookielawinfo-checkbox-performance
11 months
This cookie is set by GDPR Cookie Consent plugin. The cookie is used to store the user consent for the cookies in the category "Performance".
viewed_cookie_policy
11 months
The cookie is set by the GDPR Cookie Consent plugin and is used to store whether or not user has consented to the use of cookies. It does not store any personal data.
Functional cookies help to perform certain functionalities like sharing the content of the website on social media platforms, collect feedbacks, and other third-party features.
Performance cookies are used to understand and analyze the key performance indexes of the website which helps in delivering a better user experience for the visitors.
Analytical cookies are used to understand how visitors interact with the website. These cookies help provide information on metrics the number of visitors, bounce rate, traffic source, etc.
Advertisement cookies are used to provide visitors with relevant ads and marketing campaigns. These cookies track visitors across websites and collect information to provide customized ads.


