Uncategorized
Wet tissue and wipe market to grow at a CAGR of 6.9% by 2027 ; Growing concerns regarding hygiene will drive growth – Technavio
Wet tissue and wipe market to grow at a CAGR of 6.9% by 2027 ; Growing concerns regarding hygiene will drive growth – Technavio
PR Newswire
NEW YORK, Feb. 15, 2023
NEW YORK, Feb. 15, 2023 /PRNewswire/ —
…
Share this:

Wet tissue and wipe market to grow at a CAGR of 6.9% by 2027 ; Growing concerns regarding hygiene will drive growth - Technavio
PR Newswire
NEW YORK, Feb. 15, 2023
NEW YORK, Feb. 15, 2023 /PRNewswire/ --
Wet tissue and wipe market insights -
- Vendors: 15+, Including 3M Co., Beiersdorf AG, Coterie Baby Inc., Daio Paper Corp., DR. Fischer Ltd., Edgewell Personal Care Co., Essity Aktiebolag, GAMA Healthcare Ltd., Henkel AG and Co. KGaA, Johnson and Johnson Services Inc., Kimberly Clark Corp., Ontex BV, Papier Creations, Pigeon Corp., Professional Disposables International Inc., S.C. Johnson and Son Inc., The Clorox Co., The Procter and Gamble Co., Unicharm Corp., Unilever PLC, among others
- Coverage: Parent market analysis; key drivers, major trends, and challenges; customer and vendor landscape; vendor product insights and recent developments; key vendors; and market positioning of vendors
- Segments: Application (Personal care, Household, and Industrial commercial and institutional), Distribution Channel (Offline and Online), Technology (Spunlace, Airlaid, Wetlaid, and Others), and Geography (Europe, North America, APAC, South America, and Middle East and Africa)
To understand more about the wet tissue and wipe market, request a Free sample report
The wet tissue and wipe market report provide critical information and factual data, with a qualitative and quantitative study of the market based on market drivers and limitations as well as future prospects.
Why buy?
- Add credibility to strategy
- Analyzes competitor's offerings
- Get a holistic view of the market
Grow your profit margin with Technavio- Buy the Report
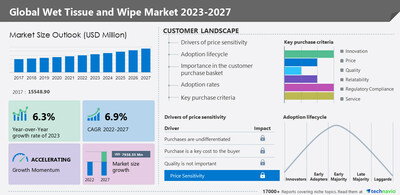
In 2017, the wet tissue and wipe market was valued at USD 15,548.90 million. From a regional perspective, Europe is estimated to contribute 34% to the growth of the global market, and the market is valued at USD 5,933.46 million in 2017. The wet tissue and wipe market size is estimated to grow by USD 7,938.35 million from 2022 to 2027 at a CAGR of 6.9% according to Technavio.
Wet tissue and wipe market - Customer landscape
To help companies evaluate and develop growth strategies, the report outlines –
- Key purchase criteria
- Adoption rates
- Adoption lifecycle
- Drivers of price sensitivity
- For highlights on customer landscape analysis, download a sample!
Wet tissue and wipe market - Vendor insights
The growing competition in the market is compelling vendors to adopt various growth strategies such as promotional activities and spending on advertisements to improve the visibility of their services. Technavio report analyzes the market's competitive landscape and offers information on several market vendors including –
- 3M Co. - The company offers wet tissue and wipe namely 3M Respirator cleaning wipe.
- Beiersdorf AG - The company offers wet tissue and wipe under its brand Nivea.
- Daio Paper Corp. - The company offers wet tissue and wipe namely Daio Paper Elleair Wet Wipes.
Wet tissue and wipe market – Market dynamics
Major drivers –
- Growing pollution and deteriorating environmental conditions
- Growing concerns regarding hygiene
- Rising demand for wet tissues and wipes from the healthcare sector
Key challenges –
- Concerns regarding disposal of wet wipes
- Stringent government regulations on wet wipes
- Availability of counterfeit products
What are the key data covered in this wet tissue and wipe market report?
- CAGR of the market during the forecast period
- Detailed information on factors that will drive the growth of the wet tissue and wipe market between 2023 and 2027
- Precise estimation of the wet tissue and wipe market size and its contribution to the market in focus on the parent market
- Accurate predictions about upcoming trends and changes in consumer behavior
- Growth of the wet tissue and wipe industry across Europe, North America, APAC, South America, and Middle East and Africa
- A thorough analysis of the market's competitive landscape and detailed information about vendors
- Comprehensive analysis of factors that will challenge the growth of wet tissue and wipe market vendors
Gain instant access to 17,000+ market research reports.
Technavio's SUBSCRIPTION platform
Related Reports:
The predicted growth of the tissue paper market share from 2021 to 2026 is USD 25.86 billion at a progressing CAGR of 5.79%. The growing concerns about health and hygiene in developing economies are notably driving the tissue paper market growth, although factors such as the threat of prominent substitutes may impede the market growth.
The wet-wipe market has the potential to grow by USD 5.58 billion during 2021-2025, and the market's growth momentum will accelerate at a CAGR of 7.38%. The rising concern over hygiene is notably driving the wet-wipe market growth, although factors such as increasing environmental concerns may impede the market growth.
Wet Tissue And Wipe Market Scope | |
Report Coverage | Details |
Page number | 191 |
Base year | 2022 |
Historic period | 2017-2021 |
Forecast period | 2023-2027 |
Growth momentum & CAGR | Accelerate at a CAGR of 6.9% |
Market growth 2023-2027 | USD 7,938.35 million |
Market structure | Fragmented |
YoY growth 2022-2023 (%) | 6.3 |
Regional analysis | Europe, North America, APAC, South America, and Middle East and Africa |
Performing market contribution | Europe at 34% |
Key countries | US, China, Japan, Germany, and UK |
Competitive landscape | Leading Vendors, Market Positioning of Vendors, Competitive Strategies, and Industry Risks |
Key companies profiled | 3M Co., Beiersdorf AG, Coterie Baby Inc., Daio Paper Corp., DR. Fischer Ltd., Edgewell Personal Care Co., Essity Aktiebolag, GAMA Healthcare Ltd., Henkel AG and Co. KGaA, Johnson and Johnson Services Inc., Kimberly Clark Corp., Ontex BV, Papier Creations, Pigeon Corp., Professional Disposables International Inc., S.C. Johnson and Son Inc., The Clorox Co., The Procter and Gamble Co., Unicharm Corp., and Unilever PLC |
Market dynamics | Parent market analysis, Market growth inducers and obstacles, Fast-growing and slow-growing segment analysis, COVID-19 impact and recovery analysis and future consumer dynamics, and Market condition analysis for the forecast period. |
Customization purview | If our report has not included the data that you are looking for, you can reach out to our analysts and get segments customized. |
Table of Contents:
1 Executive Summary
- 1.1 Market overview
- Exhibit 01: Executive Summary – Chart on Market Overview
- Exhibit 02: Executive Summary – Data Table on Market Overview
- Exhibit 03: Executive Summary – Chart on Global Market Characteristics
- Exhibit 04: Executive Summary – Chart on Market by Geography
- Exhibit 05: Executive Summary – Chart on Market Segmentation by Application
- Exhibit 06: Executive Summary – Chart on Market Segmentation by Distribution Channel
- Exhibit 07: Executive Summary – Chart on Market Segmentation by Technology
- Exhibit 08: Executive Summary – Chart on Incremental Growth
- Exhibit 09: Executive Summary – Data Table on Incremental Growth
- Exhibit 10: Executive Summary – Chart on Vendor Market Positioning
2 Market Landscape
- 2.1 Market ecosystem
- Exhibit 11: Parent market
- Exhibit 12: Market Characteristics
3 Market Sizing
- 3.1 Market definition
- Exhibit 13: Offerings of vendors included in the market definition
- 3.2 Market segment analysis
- Exhibit 14: Market segments
- 3.3 Market size 2022
- 3.4 Market outlook: Forecast for 2022-2027
- Exhibit 15: Chart on Global - Market size and forecast 2022-2027 ($ million)
- Exhibit 16: Data Table on Global - Market size and forecast 2022-2027 ($ million)
- Exhibit 17: Chart on Global Market: Year-over-year growth 2022-2027 (%)
- Exhibit 18: Data Table on Global Market: Year-over-year growth 2022-2027 (%)
4 Historic Market Size
- 4.1 Global wet tissue and wipe market 2017 - 2021
- Exhibit 19: Historic Market Size – Data Table on Global wet tissue and wipe market 2017 - 2021 ($ million)
- 4.2 Application Segment Analysis 2017 - 2021
- Exhibit 20: Historic Market Size – Application Segment 2017 - 2021 ($ million)
- 4.3 Distribution channel Segment Analysis 2017 - 2021
- Exhibit 21: Historic Market Size – Distribution channel Segment 2017 - 2021 ($ million)
- 4.4 Technology Segment Analysis 2017 - 2021
- Exhibit 22: Historic Market Size – Technology Segment 2017 - 2021 ($ million)
- 4.5 Geography Segment Analysis 2017 - 2021
- Exhibit 23: Historic Market Size – Geography Segment 2017 - 2021 ($ million)
- 4.6 Country Segment Analysis 2017 - 2021
- Exhibit 24: Historic Market Size – Country Segment 2017 - 2021 ($ million)
5 Five Forces Analysis
- 5.1 Five forces summary
- Exhibit 25: Five forces analysis - Comparison between 2022 and 2027
- 5.2 Bargaining power of buyers
- Exhibit 26: Chart on Bargaining power of buyers – Impact of key factors 2022 and 2027
- 5.3 Bargaining power of suppliers
- Exhibit 27: Bargaining power of suppliers – Impact of key factors in 2022 and 2027
- 5.4 Threat of new entrants
- Exhibit 28: Threat of new entrants – Impact of key factors in 2022 and 2027
- 5.5 Threat of substitutes
- Exhibit 29: Threat of substitutes – Impact of key factors in 2022 and 2027
- 5.6 Threat of rivalry
- Exhibit 30: Threat of rivalry – Impact of key factors in 2022 and 2027
- 5.7 Market condition
- Exhibit 31: Chart on Market condition - Five forces 2022 and 2027
6 Market Segmentation by Application
- 6.1 Market segments
- Exhibit 32: Chart on Application - Market share 2022-2027 (%)
- Exhibit 33: Data Table on Application - Market share 2022-2027 (%)
- 6.2 Comparison by Application
- Exhibit 34: Chart on Comparison by Application
- Exhibit 35: Data Table on Comparison by Application
- 6.3 Personal care - Market size and forecast 2022-2027
- Exhibit 36: Chart on Personal care - Market size and forecast 2022-2027 ($ million)
- Exhibit 37: Data Table on Personal care - Market size and forecast 2022-2027 ($ million)
- Exhibit 38: Chart on Personal care - Year-over-year growth 2022-2027 (%)
- Exhibit 39: Data Table on Personal care - Year-over-year growth 2022-2027 (%)
- 6.4 Household - Market size and forecast 2022-2027
- Exhibit 40: Chart on Household - Market size and forecast 2022-2027 ($ million)
- Exhibit 41: Data Table on Household - Market size and forecast 2022-2027 ($ million)
- Exhibit 42: Chart on Household - Year-over-year growth 2022-2027 (%)
- Exhibit 43: Data Table on Household - Year-over-year growth 2022-2027 (%)
- 6.5 Industrial commercial and institutional - Market size and forecast 2022-2027
- Exhibit 44: Chart on Industrial commercial and institutional - Market size and forecast 2022-2027 ($ million)
- Exhibit 45: Data Table on Industrial commercial and institutional - Market size and forecast 2022-2027 ($ million)
- Exhibit 46: Chart on Industrial commercial and institutional - Year-over-year growth 2022-2027 (%)
- Exhibit 47: Data Table on Industrial commercial and institutional - Year-over-year growth 2022-2027 (%)
- 6.6 Market opportunity by Application
- Exhibit 48: Market opportunity by Application ($ million)
7 Market Segmentation by Distribution Channel
- 7.1 Market segments
- Exhibit 49: Chart on Distribution Channel - Market share 2022-2027 (%)
- Exhibit 50: Data Table on Distribution Channel - Market share 2022-2027 (%)
- 7.2 Comparison by Distribution Channel
- Exhibit 51: Chart on Comparison by Distribution Channel
- Exhibit 52: Data Table on Comparison by Distribution Channel
- 7.3 Offline - Market size and forecast 2022-2027
- Exhibit 53: Chart on Offline - Market size and forecast 2022-2027 ($ million)
- Exhibit 54: Data Table on Offline - Market size and forecast 2022-2027 ($ million)
- Exhibit 55: Chart on Offline - Year-over-year growth 2022-2027 (%)
- Exhibit 56: Data Table on Offline - Year-over-year growth 2022-2027 (%)
- 7.4 Online - Market size and forecast 2022-2027
- Exhibit 57: Chart on Online - Market size and forecast 2022-2027 ($ million)
- Exhibit 58: Data Table on Online - Market size and forecast 2022-2027 ($ million)
- Exhibit 59: Chart on Online - Year-over-year growth 2022-2027 (%)
- Exhibit 60: Data Table on Online - Year-over-year growth 2022-2027 (%)
- 7.5 Market opportunity by Distribution Channel
- Exhibit 61: Market opportunity by Distribution Channel ($ million)
8 Market Segmentation by Technology
- 8.1 Market segments
- Exhibit 62: Chart on Technology - Market share 2022-2027 (%)
- Exhibit 63: Data Table on Technology - Market share 2022-2027 (%)
- 8.2 Comparison by Technology
- Exhibit 64: Chart on Comparison by Technology
- Exhibit 65: Data Table on Comparison by Technology
- 8.3 Spunlace - Market size and forecast 2022-2027
- Exhibit 66: Chart on Spunlace - Market size and forecast 2022-2027 ($ million)
- Exhibit 67: Data Table on Spunlace - Market size and forecast 2022-2027 ($ million)
- Exhibit 68: Chart on Spunlace - Year-over-year growth 2022-2027 (%)
- Exhibit 69: Data Table on Spunlace - Year-over-year growth 2022-2027 (%)
- 8.4 Airlaid - Market size and forecast 2022-2027
- Exhibit 70: Chart on Airlaid - Market size and forecast 2022-2027 ($ million)
- Exhibit 71: Data Table on Airlaid - Market size and forecast 2022-2027 ($ million)
- Exhibit 72: Chart on Airlaid - Year-over-year growth 2022-2027 (%)
- Exhibit 73: Data Table on Airlaid - Year-over-year growth 2022-2027 (%)
- 8.5 Wetlaid - Market size and forecast 2022-2027
- Exhibit 74: Chart on Wetlaid - Market size and forecast 2022-2027 ($ million)
- Exhibit 75: Data Table on Wetlaid - Market size and forecast 2022-2027 ($ million)
- Exhibit 76: Chart on Wetlaid - Year-over-year growth 2022-2027 (%)
- Exhibit 77: Data Table on Wetlaid - Year-over-year growth 2022-2027 (%)
- 8.6 Others - Market size and forecast 2022-2027
- Exhibit 78: Chart on Others - Market size and forecast 2022-2027 ($ million)
- Exhibit 79: Data Table on Others - Market size and forecast 2022-2027 ($ million)
- Exhibit 80: Chart on Others - Year-over-year growth 2022-2027 (%)
- Exhibit 81: Data Table on Others - Year-over-year growth 2022-2027 (%)
- 8.7 Market opportunity by Technology
- Exhibit 82: Market opportunity by Technology ($ million)
9 Customer Landscape
- 9.1 Customer landscape overview
- Exhibit 83: Analysis of price sensitivity, lifecycle, customer purchase basket, adoption rates, and purchase criteria
10 Geographic Landscape
- 10.1 Geographic segmentation
- Exhibit 84: Chart on Market share by geography 2022-2027 (%)
- Exhibit 85: Data Table on Market share by geography 2022-2027 (%)
- 10.2 Geographic comparison
- Exhibit 86: Chart on Geographic comparison
- Exhibit 87: Data Table on Geographic comparison
- 10.3 Europe - Market size and forecast 2022-2027
- Exhibit 88: Chart on Europe - Market size and forecast 2022-2027 ($ million)
- Exhibit 89: Data Table on Europe - Market size and forecast 2022-2027 ($ million)
- Exhibit 90: Chart on Europe - Year-over-year growth 2022-2027 (%)
- Exhibit 91: Data Table on Europe - Year-over-year growth 2022-2027 (%)
- 10.4 North America - Market size and forecast 2022-2027
- Exhibit 92: Chart on North America - Market size and forecast 2022-2027 ($ million)
- Exhibit 93: Data Table on North America - Market size and forecast 2022-2027 ($ million)
- Exhibit 94: Chart on North America - Year-over-year growth 2022-2027 (%)
- Exhibit 95: Data Table on North America - Year-over-year growth 2022-2027 (%)
- 10.5 APAC - Market size and forecast 2022-2027
- Exhibit 96: Chart on APAC - Market size and forecast 2022-2027 ($ million)
- Exhibit 97: Data Table on APAC - Market size and forecast 2022-2027 ($ million)
- Exhibit 98: Chart on APAC - Year-over-year growth 2022-2027 (%)
- Exhibit 99: Data Table on APAC - Year-over-year growth 2022-2027 (%)
- 10.6 South America - Market size and forecast 2022-2027
- Exhibit 100: Chart on South America - Market size and forecast 2022-2027 ($ million)
- Exhibit 101: Data Table on South America - Market size and forecast 2022-2027 ($ million)
- Exhibit 102: Chart on South America - Year-over-year growth 2022-2027 (%)
- Exhibit 103: Data Table on South America - Year-over-year growth 2022-2027 (%)
- 10.7 Middle East and Africa - Market size and forecast 2022-2027
- Exhibit 104: Chart on Middle East and Africa - Market size and forecast 2022-2027 ($ million)
- Exhibit 105: Data Table on Middle East and Africa - Market size and forecast 2022-2027 ($ million)
- Exhibit 106: Chart on Middle East and Africa - Year-over-year growth 2022-2027 (%)
- Exhibit 107: Data Table on Middle East and Africa - Year-over-year growth 2022-2027 (%)
- 10.8 US - Market size and forecast 2022-2027
- Exhibit 108: Chart on US - Market size and forecast 2022-2027 ($ million)
- Exhibit 109: Data Table on US - Market size and forecast 2022-2027 ($ million)
- Exhibit 110: Chart on US - Year-over-year growth 2022-2027 (%)
- Exhibit 111: Data Table on US - Year-over-year growth 2022-2027 (%)
- 10.9 China - Market size and forecast 2022-2027
- Exhibit 112: Chart on China - Market size and forecast 2022-2027 ($ million)
- Exhibit 113: Data Table on China - Market size and forecast 2022-2027 ($ million)
- Exhibit 114: Chart on China - Year-over-year growth 2022-2027 (%)
- Exhibit 115: Data Table on China - Year-over-year growth 2022-2027 (%)
- 10.10 Germany - Market size and forecast 2022-2027
- Exhibit 116: Chart on Germany - Market size and forecast 2022-2027 ($ million)
- Exhibit 117: Data Table on Germany - Market size and forecast 2022-2027 ($ million)
- Exhibit 118: Chart on Germany - Year-over-year growth 2022-2027 (%)
- Exhibit 119: Data Table on Germany - Year-over-year growth 2022-2027 (%)
- 10.11 UK - Market size and forecast 2022-2027
- Exhibit 120: Chart on UK - Market size and forecast 2022-2027 ($ million)
- Exhibit 121: Data Table on UK - Market size and forecast 2022-2027 ($ million)
- Exhibit 122: Chart on UK - Year-over-year growth 2022-2027 (%)
- Exhibit 123: Data Table on UK - Year-over-year growth 2022-2027 (%)
- 10.12 Japan - Market size and forecast 2022-2027
- Exhibit 124: Chart on Japan - Market size and forecast 2022-2027 ($ million)
- Exhibit 125: Data Table on Japan - Market size and forecast 2022-2027 ($ million)
- Exhibit 126: Chart on Japan - Year-over-year growth 2022-2027 (%)
- Exhibit 127: Data Table on Japan - Year-over-year growth 2022-2027 (%)
- 10.13 Market opportunity by geography
- Exhibit 128: Market opportunity by geography ($ million)
11 Drivers, Challenges, and Trends
- 11.1 Market drivers
- 11.2 Market challenges
- 11.3 Impact of drivers and challenges
- Exhibit 129: Impact of drivers and challenges in 2022 and 2027
- 11.4 Market trends
12 Vendor Landscape
- 12.1 Overview
- 12.2 Vendor landscape
- Exhibit 130: Overview on Criticality of inputs and Factors of differentiation
- 12.3 Landscape disruption
- Exhibit 131: Overview on factors of disruption
- 12.4 Industry risks
- Exhibit 132: Impact of key risks on business
13 Vendor Analysis
- 13.1 Vendors covered
- Exhibit 133: Vendors covered
- 13.2 Market positioning of vendors
- Exhibit 134: Matrix on vendor position and classification
- 13.3 3M Co.
- Exhibit 135: 3M Co. - Overview
- Exhibit 136: 3M Co. - Business segments
- Exhibit 137: 3M Co. - Key offerings
- Exhibit 138: 3M Co. - Segment focus
- 13.4 Beiersdorf AG
- Exhibit 139: Beiersdorf AG - Overview
- Exhibit 140: Beiersdorf AG - Business segments
- Exhibit 141: Beiersdorf AG - Key news
- Exhibit 142: Beiersdorf AG - Key offerings
- Exhibit 143: Beiersdorf AG - Segment focus
- 13.5 Daio Paper Corp.
- Exhibit 144: Daio Paper Corp. - Overview
- Exhibit 145: Daio Paper Corp. - Product / Service
- Exhibit 146: Daio Paper Corp. - Key offerings
- 13.6 DR. Fischer Ltd.
- Exhibit 147: DR. Fischer Ltd. - Overview
- Exhibit 148: DR. Fischer Ltd. - Product / Service
- Exhibit 149: DR. Fischer Ltd. - Key offerings
- 13.7 Edgewell Personal Care Co.
- Exhibit 150: Edgewell Personal Care Co. - Overview
- Exhibit 151: Edgewell Personal Care Co. - Business segments
- Exhibit 152: Edgewell Personal Care Co. - Key offerings
- Exhibit 153: Edgewell Personal Care Co. - Segment focus
- 13.8 Essity Aktiebolag
- Exhibit 154: Essity Aktiebolag - Overview
- Exhibit 155: Essity Aktiebolag - Business segments
- Exhibit 156: Essity Aktiebolag - Key news
- Exhibit 157: Essity Aktiebolag - Key offerings
- Exhibit 158: Essity Aktiebolag - Segment focus
- 13.9 GAMA Healthcare Ltd.
- Exhibit 159: GAMA Healthcare Ltd. - Overview
- Exhibit 160: GAMA Healthcare Ltd. - Product / Service
- Exhibit 161: GAMA Healthcare Ltd. - Key offerings
- 13.10 Henkel AG and Co. KGaA
- Exhibit 162: Henkel AG and Co. KGaA - Overview
- Exhibit 163: Henkel AG and Co. KGaA - Business segments
- Exhibit 164: Henkel AG and Co. KGaA - Key news
- Exhibit 165: Henkel AG and Co. KGaA - Key offerings
- Exhibit 166: Henkel AG and Co. KGaA - Segment focus
- 13.11 Johnson and Johnson Services Inc.
- Exhibit 167: Johnson and Johnson Services Inc. - Overview
- Exhibit 168: Johnson and Johnson Services Inc. - Business segments
- Exhibit 169: Johnson and Johnson Services Inc. - Key news
- Exhibit 170: Johnson and Johnson Services Inc. - Key offerings
- Exhibit 171: Johnson and Johnson Services Inc. - Segment focus
- 13.12 Kimberly Clark Corp.
- Exhibit 172: Kimberly Clark Corp. - Overview
- Exhibit 173: Kimberly Clark Corp. - Business segments
- Exhibit 174: Kimberly Clark Corp. - Key news
- Exhibit 175: Kimberly Clark Corp. - Key offerings
- Exhibit 176: Kimberly Clark Corp. - Segment focus
- 13.13 S.C. Johnson and Son Inc.
- Exhibit 177: S.C. Johnson and Son Inc. - Overview
- Exhibit 178: S.C. Johnson and Son Inc. - Product / Service
- Exhibit 179: S.C. Johnson and Son Inc. - Key offerings
- 13.14 The Clorox Co.
- Exhibit 180: The Clorox Co. - Overview
- Exhibit 181: The Clorox Co. - Business segments
- Exhibit 182: The Clorox Co. - Key offerings
- Exhibit 183: The Clorox Co. - Segment focus
- 13.15 The Procter and Gamble Co.
- Exhibit 184: The Procter and Gamble Co. - Overview
- Exhibit 185: The Procter and Gamble Co. - Business segments
- Exhibit 186: The Procter and Gamble Co. - Key news
- Exhibit 187: The Procter and Gamble Co. - Key offerings
- Exhibit 188: The Procter and Gamble Co. - Segment focus
- 13.16 Unicharm Corp.
- Exhibit 189: Unicharm Corp. - Overview
- Exhibit 190: Unicharm Corp. - Business segments
- Exhibit 191: Unicharm Corp. - Key offerings
- Exhibit 192: Unicharm Corp. - Segment focus
- 13.17 Unilever PLC
- Exhibit 193: Unilever PLC - Overview
- Exhibit 194: Unilever PLC - Business segments
- Exhibit 195: Unilever PLC - Key news
- Exhibit 196: Unilever PLC - Key offerings
- Exhibit 197: Unilever PLC - Segment focus
14 Appendix
- 14.1 Scope of the report
- 14.2 Inclusions and exclusions checklist
- Exhibit 198: Inclusions checklist
- Exhibit 199: Exclusions checklist
- 14.3 Currency conversion rates for US$
- Exhibit 200: Currency conversion rates for US$
- 14.4 Research methodology
- Exhibit 201: Research methodology
- Exhibit 202: Validation techniques employed for market sizing
- Exhibit 203: Information sources
- 14.5 List of abbreviations
- Exhibit 204: List of abbreviations
About Us
Technavio is a leading global technology research and advisory company. Their research and analysis focus on emerging market trends and provide actionable insights to help businesses identify market opportunities and develop effective strategies to optimize their market positions. With over 500 specialized analysts, Technavio's report library consists of more than 17,000 reports and counting, covering 800 technologies, spanning across 50 countries. Their client base consists of enterprises of all sizes, including more than 100 Fortune 500 companies. This growing client base relies on Technavio's comprehensive coverage, extensive research, and actionable market insights to identify opportunities in existing and potential markets and assess their competitive positions within changing market scenarios.
Contact
Technavio Research
Jesse Maida
Media & Marketing Executive
US: +1 844 364 1100
UK: +44 203 893 3200
Email: media@technavio.com
Website: www.technavio.com/
")
View original content to download multimedia:https://www.prnewswire.com/news-releases/wet-tissue-and-wipe-market-to-grow-at-a-cagr-of-6-9-by-2027--growing-concerns-regarding-hygiene-will-drive-growth---technavio-301746027.html
SOURCE Technavio
Uncategorized
Pharma industry reputation remains steady at a ‘new normal’ after Covid, Harris Poll finds
The pharma industry is hanging on to reputation gains notched during the Covid-19 pandemic. Positive perception of the pharma industry is steady at 45%…
Share this:


The pharma industry is hanging on to reputation gains notched during the Covid-19 pandemic. Positive perception of the pharma industry is steady at 45% of US respondents in 2023, according to the latest Harris Poll data. That’s exactly the same as the previous year.
Pharma’s highest point was in February 2021 — as Covid vaccines began to roll out — with a 62% positive US perception, and helping the industry land at an average 55% positive sentiment at the end of the year in Harris’ 2021 annual assessment of industries. The pharma industry’s reputation hit its most recent low at 32% in 2019, but it had hovered around 30% for more than a decade prior.
“Pharma has sustained a lot of the gains, now basically one and half times higher than pre-Covid,” said Harris Poll managing director Rob Jekielek. “There is a question mark around how sustained it will be, but right now it feels like a new normal.”
The Harris survey spans 11 global markets and covers 13 industries. Pharma perception is even better abroad, with an average 58% of respondents notching favorable sentiments in 2023, just a slight slip from 60% in each of the two previous years.
Pharma’s solid global reputation puts it in the middle of the pack among international industries, ranking higher than government at 37% positive, insurance at 48%, financial services at 51% and health insurance at 52%. Pharma ranks just behind automotive (62%), manufacturing (63%) and consumer products (63%), although it lags behind leading industries like tech at 75% positive in the first spot, followed by grocery at 67%.
The bright spotlight on the pharma industry during Covid vaccine and drug development boosted its reputation, but Jekielek said there’s maybe an argument to be made that pharma is continuing to develop innovative drugs outside that spotlight.
“When you look at pharma reputation during Covid, you have clear sense of a very dynamic industry working very quickly and getting therapies and products to market. If you’re looking at things happening now, you could argue that pharma still probably doesn’t get enough credit for its advances, for example, in oncology treatments,” he said.
vaccine pandemic covid-19Uncategorized
Q4 Update: Delinquencies, Foreclosures and REO
Today, in the Calculated Risk Real Estate Newsletter: Q4 Update: Delinquencies, Foreclosures and REO
A brief excerpt: I’ve argued repeatedly that we would NOT see a surge in foreclosures that would significantly impact house prices (as happened followi…
Share this:


A brief excerpt:
I’ve argued repeatedly that we would NOT see a surge in foreclosures that would significantly impact house prices (as happened following the housing bubble). The two key reasons are mortgage lending has been solid, and most homeowners have substantial equity in their homes..There is much more in the article. You can subscribe at https://calculatedrisk.substack.com/ mortgage rates real estate mortgages pandemic interest rates
...
And on mortgage rates, here is some data from the FHFA’s National Mortgage Database showing the distribution of interest rates on closed-end, fixed-rate 1-4 family mortgages outstanding at the end of each quarter since Q1 2013 through Q3 2023 (Q4 2023 data will be released in a two weeks).
This shows the surge in the percent of loans under 3%, and also under 4%, starting in early 2020 as mortgage rates declined sharply during the pandemic. Currently 22.6% of loans are under 3%, 59.4% are under 4%, and 78.7% are under 5%.
With substantial equity, and low mortgage rates (mostly at a fixed rates), few homeowners will have financial difficulties.
Uncategorized
‘Bougie Broke’ – The Financial Reality Behind The Facade
‘Bougie Broke’ – The Financial Reality Behind The Facade
Authored by Michael Lebowitz via RealInvestmentAdvice.com,
Social media users claiming…
Share this:


Authored by Michael Lebowitz via RealInvestmentAdvice.com,
Social media users claiming to be Bougie Broke share pictures of their fancy cars, high-fashion clothing, and selfies in exotic locations and expensive restaurants. Yet they complain about living paycheck to paycheck and lacking the means to support their lifestyle.
Bougie broke is like “keeping up with the Joneses,” spending beyond one’s means to impress others.
Bougie Broke gives us a glimpse into the financial condition of a growing number of consumers. Since personal consumption represents about two-thirds of economic activity, it’s worth diving into the Bougie Broke fad to appreciate if a large subset of the population can continue to consume at current rates.
The Wealth Divide Disclaimer
Forecasting personal consumption is always tricky, but it has become even more challenging in the post-pandemic era. To appreciate why we share a joke told by Mike Green.
Bill Gates and I walk into the bar…
Bartender: “Wow… a couple of billionaires on average!”
Bill Gates, Jeff Bezos, Elon Musk, Mark Zuckerberg, and other billionaires make us all much richer, on average. Unfortunately, we can’t use the average to pay our bills.
According to Wikipedia, Bill Gates is one of 756 billionaires living in the United States. Many of these billionaires became much wealthier due to the pandemic as their investment fortunes proliferated.
To appreciate the wealth divide, consider the graph below courtesy of Statista. 1% of the U.S. population holds 30% of the wealth. The wealthiest 10% of households have two-thirds of the wealth. The bottom half of the population accounts for less than 3% of the wealth.
The uber-wealthy grossly distorts consumption and savings data. And, with the sharp increase in their wealth over the past few years, the consumption and savings data are more distorted.
Furthermore, and critical to appreciate, the spending by the wealthy doesn’t fluctuate with the economy. Therefore, the spending of the lower wealth classes drives marginal changes in consumption. As such, the condition of the not-so-wealthy is most important for forecasting changes in consumption.
Revenge Spending
Deciphering personal data has also become more difficult because our spending habits have changed due to the pandemic.
A great example is revenge spending. Per the New York Times:
Ola Majekodunmi, the founder of All Things Money, a finance site for young adults, explained revenge spending as expenditures meant to make up for “lost time” after an event like the pandemic.
So, between the growing wealth divide and irregular spending habits, let’s quantify personal savings, debt usage, and real wages to appreciate better if Bougie Broke is a mass movement or a silly meme.
The Means To Consume
Savings, debt, and wages are the three primary sources that give consumers the ability to consume.
Savings
The graph below shows the rollercoaster on which personal savings have been since the pandemic. The savings rate is hovering at the lowest rate since those seen before the 2008 recession. The total amount of personal savings is back to 2017 levels. But, on an inflation-adjusted basis, it’s at 10-year lows. On average, most consumers are drawing down their savings or less. Given that wages are increasing and unemployment is historically low, they must be consuming more.
Now, strip out the savings of the uber-wealthy, and it’s probable that the amount of personal savings for much of the population is negligible. A survey by Payroll.org estimates that 78% of Americans live paycheck to paycheck.

More on Insufficient Savings
The Fed’s latest, albeit old, Report on the Economic Well-Being of U.S. Households from June 2023 claims that over a third of households do not have enough savings to cover an unexpected $400 expense. We venture to guess that number has grown since then. To wit, the number of households with essentially no savings rose 5% from their prior report a year earlier.
Relatively small, unexpected expenses, such as a car repair or a modest medical bill, can be a hardship for many families. When faced with a hypothetical expense of $400, 63 percent of all adults in 2022 said they would have covered it exclusively using cash, savings, or a credit card paid off at the next statement (referred to, altogether, as “cash or its equivalent”). The remainder said they would have paid by borrowing or selling something or said they would not have been able to cover the expense.
Debt
After periods where consumers drained their existing savings and/or devoted less of their paychecks to savings, they either slowed their consumption patterns or borrowed to keep them up. Currently, it seems like many are choosing the latter option. Consumer borrowing is accelerating at a quicker pace than it was before the pandemic.
The first graph below shows outstanding credit card debt fell during the pandemic as the economy cratered. However, after multiple stimulus checks and broad-based economic recovery, consumer confidence rose, and with it, credit card balances surged.
The current trend is steeper than the pre-pandemic trend. Some may be a catch-up, but the current rate is unsustainable. Consequently, borrowing will likely slow down to its pre-pandemic trend or even below it as consumers deal with higher credit card balances and 20+% interest rates on the debt.

The second graph shows that since 2022, credit card balances have grown faster than our incomes. Like the first graph, the credit usage versus income trend is unsustainable, especially with current interest rates.

With many consumers maxing out their credit cards, is it any wonder buy-now-pay-later loans (BNPL) are increasing rapidly?
Insider Intelligence believes that 79 million Americans, or a quarter of those over 18 years old, use BNPL. Lending Tree claims that “nearly 1 in 3 consumers (31%) say they’re at least considering using a buy now, pay later (BNPL) loan this month.”More telling, according to their survey, only 52% of those asked are confident they can pay off their BNPL loan without missing a payment!
Wage Growth
Wages have been growing above trend since the pandemic. Since 2022, the average annual growth in compensation has been 6.28%. Higher incomes support more consumption, but higher prices reduce the amount of goods or services one can buy. Over the same period, real compensation has grown by less than half a percent annually. The average real compensation growth was 2.30% during the three years before the pandemic.
In other words, compensation is just keeping up with inflation instead of outpacing it and providing consumers with the ability to consume, save, or pay down debt.
It’s All About Employment
The unemployment rate is 3.9%, up slightly from recent lows but still among the lowest rates in the last seventy-five years.

The uptick in credit card usage, decline in savings, and the savings rate argue that consumers are slowly running out of room to keep consuming at their current pace.
However, the most significant means by which we consume is income. If the unemployment rate stays low, consumption may moderate. But, if the recent uptick in unemployment continues, a recession is extremely likely, as we have seen every time it turned higher.
It’s not just those losing jobs that consume less. Of greater impact is a loss of confidence by those employed when they see friends or neighbors being laid off.
Accordingly, the labor market is probably the most important leading indicator of consumption and of the ability of the Bougie Broke to continue to be Bougie instead of flat-out broke!
Summary
There are always consumers living above their means. This is often harmless until their means decline or disappear. The Bougie Broke meme and the ability social media gives consumers to flaunt their “wealth” is a new medium for an age-old message.
Diving into the data, it argues that consumption will likely slow in the coming months. Such would allow some consumers to save and whittle down their debt. That situation would be healthy and unlikely to cause a recession.
The potential for the unemployment rate to continue higher is of much greater concern. The combination of a higher unemployment rate and strapped consumers could accentuate a recession.


Q4 Update: Delinquencies, Foreclosures and REO


Pharma industry reputation remains steady at a ‘new normal’ after Covid, Harris Poll finds


Digital Currency And Gold As Speculative Warnings


Bougie Broke The Financial Reality Behind The Facade


Aging at AACR Annual Meeting 2024


Bitcoin on Wheels: The Story of Bitcoinetas


Futures Flat At All-Time High As Bitcoin Surges To Record, Oil Rises


The most potent labor market indicator of all is still strongly positive


‘Bougie Broke’ – The Financial Reality Behind The Facade
-

 Uncategorized3 weeks ago
All Of The Elements Are In Place For An Economic Crisis Of Staggering Proportions
-

 International5 days ago
EyePoint poaches medical chief from Apellis; Sandoz CFO, longtime BioNTech exec to retire
-

 Uncategorized4 weeks ago
California Counties Could Be Forced To Pay $300 Million To Cover COVID-Era Program
-

 Uncategorized3 weeks ago
Apparel Retailer Express Moving Toward Bankruptcy
-

 Uncategorized4 weeks ago
Industrial Production Decreased 0.1% in January
-

 International5 days ago
Walmart launches clever answer to Target’s new membership program
-

 Uncategorized4 weeks ago
RFK Jr: The Wuhan Cover-Up & The Rise Of The Biowarfare-Industrial Complex
-

 Uncategorized3 weeks ago
GOP Efforts To Shore Up Election Security In Swing States Face Challenges