Connect with us

International

Visualizing Remittance Flows & GDP Impact By Country

Visualizing Remittance Flows & GDP Impact By Country

The COVID-19 pandemic slowed down the flow of global immigration by 27%.

And,…

Published

on

Visualizing Remittance Flows & GDP Impact By Country

The COVID-19 pandemic slowed down the flow of global immigration by 27%.

And, as Visual Capitalist's Richie Lionell details below, alongside it, travel restrictions, job losses, and mounting health concerns meant that many migrant workers couldn’t send money in the form of remittances back to families in their home countries.

This flow of remittances received by countries dropped by 1.5% to $711 billion globally in 2020. But over the next two years, things quickly turned back around.

As visa approvals restarted and international borders opened, so did international migration and global remittance flows.

In 2021, total global remittances were estimated at $781 billion and have further risen to $794 billion in 2022.

In these images, Richie Lionell uses the World Bank’s KNOMAD data to visualize this increasing flow of money across international borders in 176 countries.

Why Do Remittances Matter?

Remittances contribute to the economy of nations worldwide, especially low and middle-income countries (LMICs). 

They have been shown to help alleviate poverty, improve nutrition, and even increase school enrollment rates in these nations. Research has also found that these inflows of income can help recipient households become resilient, especially in the face of disasters.

At the same time, it’s worth noting that these transfers aren’t a silver bullet for recipient nations. In fact, some research shows that overreliance on remittances can cause a vicious cycle that doesn’t translate to consistent economic growth over time.

Countries Receiving the Highest Remittances

For the past 15 years, India has consistently topped the chart of the largest remittance beneficiaries.

With an estimated $100 billion in remittances received, India is said to have reached an all-time high in 2022.

This increasing flow of remittances can be partially attributed to migrant Indians switching to high-skilled jobs in high-income countries—including the U.S., the UK, and Singapore—from low-skilled and low-paying jobs in Gulf countries.

Rank Remittance Inflows by Country 2022 (USD)
1 India

$100,000M

2 Mexico $60,300M
3 China $51,000M
4 Philippines $38,000M
5 Egypt, Arab Rep. $32,337M
6 Pakistan $29,000M
7 France $28,520M
8 Bangladesh $21,000M
9 Nigeria $20,945M
10 Vietnam $19,000M
11 Ukraine $18,421M
12 Guatemala $18,112M
13 Germany $18,000M
14 Belgium $13,500M
15 Uzbekistan $13,500M
16 Morocco $11,401M
17 Romania $11,064M
18 Dominican Republic $9,920M
19 Indonesia $9,700M
20 Thailand $9,500M
21 Colombia $9,133M
22 Italy $9,000M
23 Nepal $8,500M
24 Spain $8,500M
25 Honduras $8,284M
26 Poland $8,000M
27 Korea, Rep. $7,877M
28 El Salvador $7,620M
29 Lebanon $6,841M
30 Israel $6,143M
31 United States $6,097M
32 Russian Federation $6,000M
33 Serbia $5,400M
34 Brazil $5,045M
35 Japan $5,000M
36 Portugal $4,694M
37 Ghana $4,664M
38 Jordan $4,646M
39 Czech Republic $4,539M
40 Haiti $4,532M
41 Ecuador $4,468M
42 Georgia $4,100M
43 Kenya $4,091M
44 Croatia $3,701M
45 Peru $3,699M
46 Sri Lanka $3,600M
47 West Bank and Gaza $3,495M
48 Jamaica $3,419M
49 Armenia $3,350M
50 Tajikistan $3,200M
51 Nicaragua $3,126M
52 Kyrgyz Republic $3,050M
53 Senegal $2,711M
54 Austria $2,700M
55 Switzerland $2,631M
56 Sweden $2,565M
57 United Kingdom $2,501M
58 Hungary $2,404M
59 Bosnia and Herzegovina $2,400M
60 Slovak Republic $2,300M
61 Moldova $2,170M
62 Azerbaijan $2,150M
63 Tunisia $2,085M
64 Zimbabwe $2,047M
65 Luxembourg $2,000M
66 Netherlands $2,000M
67 Myanmar $1,900M
68 Algeria $1,829M
69 Albania $1,800M
70 Somalia $1735M
71 Congo, Dem. Rep. $1,664M
72 Malaysia $1,620M
73 Kosovo $1,600M
74 Denmark $1,517M
75 Latvia $1,500M
76 Bolivia $1,403M
77 Belarus $1,350M
78 Cambodia $1,250M
79 Bermuda $1,200M
80 South Sudan $1,187M
81 Uganda $1,131M
82 Mali $1,094M
83 South Africa $1,019M
84 Sudan $1,013M
85 Argentina $966M
86 Montenegro $920M
87 Finland $880M
88 Bulgaria $850M
89 Slovenia $800M
90 Australia $737M
91 Madagascar $718M
92 Turkey $710M
93 Canada $700M
94 Lithuania $700M
95 Togo $668M
96 Greece $665M
97 Costa Rica $654M
98 Estonia $626M
99 Qatar $624M
100 Iraq $624M
101 Gambia, The $615M
102 Tanzania $609M
103 Norway $600M
104 Panama $596M
105 Burkina Faso $589M
106 Hong Kong SAR, China $571M
107 Paraguay $554M
108 Mozambique $545M
109 Niger $534M
110 Cyprus $527M
111 Lesotho $527M
112 Mongolia $500M
113 Rwanda $469M
114 Fiji $450M
115 North Macedonia $450M
116 Guyana $400M
117 Cabo Verde $375M
118 Kazakhstan $370M
119 Cameroon $365M
120 Cote d'Ivoire $360M
121 Liberia $351M
122 Afghanistan $350M
123 Ethiopia $327M
124 Samoa $280M
125 Mauritius $279M
126 Saudi Arabia $273M
127 Malta $271M
128 Malawi $267M
129 Zambia $260M
130 Tonga $250M
131 Comoros $250M
132 Ireland $249M
133 Suriname $221M
134 Benin $209M
135 Lao PDR $200M
136 Timor-Leste $185M
137 Sierra Leone $179M
138 Guinea-Bissau $178M
139 Trinidad and Tobago $172M
140 Mauritania $168M
141 Iceland $164M
142 Eswatini $148M
143 Belize $142M
144 Curacao $131M
145 Uruguay $127M
146 Chile $78M
147 Vanuatu $75M
148 St. Vincent and the Grenadines $70M
149 Grenada $69M
150 Botswana $56M
151 St. Lucia $55M
152 Bhutan $55M
153 Djibouti $55M
154 Dominica $52M
155 Burundi $50M
156 Aruba $44M
157 Namibia $44M
158 Guinea $41M
159 Solomon Islands $40M
160 Oman $39M
161 Antigua and Barbuda $35M
162 St. Kitts and Nevis $33M
163 Marshall Islands $30M
164 Kuwait $27M
165 New Zealand $25M
166 Macao SAR, China $17M
167 Angola $16M
168 Kiribati $15M
169 Cayman Islands $14M
170 Sao Tome and Principe $10M
171 Seychelles $9M
172 Maldives $5M
173 Gabon $4M
174 Palau $2M
175 Papua New Guinea $2M
176 Turkmenistan $1M
Total World $794,059M

Mexico and China round out the top three remittance-receiving nations, with estimated inbound transfers of $60 billion and $51 billion respectively in 2022.

Impact on National GDP

While India tops the list of countries benefitting from remittances, its $100 billion received amounts to only 2.9% of its 2022 GDP.

Meanwhile, low and middle-income countries around the world heavily rely on this source of income to boost their economies in a more substantive way. In 2022, for example, remittances accounted for over 15% of the GDP of 25 countries.

Rank Remittance Inflows by Country % of GDP (2022)
1 Tonga 49.9%
2 Lebanon 37.8%
3 Samoa 33.7%
4 Tajikistan 32.0%
5 Kyrgyz Republic 31.2%
6 Gambia, The 28.3%
7 Honduras 27.1%
8 South Sudan 24.8%
9 El Salvador 23.8%
10 Haiti 22.4%
11 Nepal 21.7%
12 Jamaica 21.2%
13 Lesotho 21.0%
14 Somalia 20.6%
15 Comoros 20.1%
16 Nicaragua 19.9%
17 Guatemala 19.8%
18 Armenia 18.9%
19 West Bank and Gaza 18.5%
20 Cabo Verde 18.2%
21 Kosovo 17.3%
22 Uzbekistan 17.0%
23 Georgia 16.2%
24 Moldova 15.4%
25 Montenegro 15.0%
26 Ukraine 13.8%
27 Marshall Islands 11.0%
28 Guinea-Bissau 10.9%
29 Bosnia and Herzegovina 10.1%
30 Albania 9.8%
31 Senegal 9.8%
32 Jordan 9.6%
33 Philippines 9.4%
34 Fiji 9.2%
35 Liberia 9.0%
36 Dominican Republic 8.8%
37 Dominica 8.6%
38 Serbia 8.6%
39 Togo 7.9%
40 Morocco 7.9%
41 Pakistan 7.7%
42 Vanuatu 7.6%
43 Timor-Leste 7.5%
44 Suriname 7.3%
45 St. Vincent and the Grenadines 7.3%
46 Kiribati 7.2%
47 Egypt, Arab Rep. 6.8%
48 Ghana 6.1%
49 Mali 5.9%
50 Grenada 5.8%
51 Zimbabwe 5.3%
52 Croatia 5.3%
53 Belize 5.3%
54 Sri Lanka 4.8%
55 Madagascar 4.7%
56 Vietnam 4.5%
57 Bangladesh 4.5%
58 Tunisia 4.5%
59 Cambodia 4.4%
60 Sierra Leone 4.3%
61 Mexico 4.2%
62 Nigeria 4.1%
63 Rwanda 3.8%
64 Ecuador 3.8%
65 Latvia 3.6%
66 Romania 3.6%
67 Niger 3.6%
68 Kenya 3.5%
69 Bolivia 3.2%
70 Burkina Faso 3.2%
71 Myanmar 3.1%
72 North Macedonia 3.1%
73 Mongolia 3.1%
74 Eswatini 3.1%
75 Azerbaijan 3.0%
76 Mozambique 3.0%
77 St. Kitts and Nevis 2.9%
78 India 2.8%
79 St. Lucia 2.7%
80 Guyana 2.6%
81 Colombia 2.6%
82 Congo, Dem. Rep. 2.6%
83 Solomon Islands 2.4%
84 Luxembourg 2.4%
85 Mauritius 2.4%
86 Sudan 2.3%
87 Uganda 2.3%
88 Malawi 2.3%
89 Belgium 2.2%
90 Sao Tome and Principe 2.0%
91 Afghanistan 2.0%
92 Slovak Republic 2.0%
93 Antigua and Barbuda 2.0%
94 Bhutan 2.0%
95 Cyprus 1.9%
96 Portugal 1.8%
97 Thailand 1.7%
98 Belarus 1.6%
99 Mauritania 1.6%
100 Estonia 1.6%
101 Malta 1.5%
102 Peru 1.5%
103 Czech Republic 1.5%
104 Djibouti 1.4%
105 Burundi 1.3%
106 Paraguay 1.3%
107 Hungary 1.3%
108 Slovenia 1.2%
109 Aruba 1.2%
110 Lao PDR 1.2%
111 Benin 1.1%
112 Israel 1.1%
113 Poland 1.1%
114 Lithuania 1.0%
115 France 1.0%
116 Bulgaria 0.9%
117 Algeria 0.9%
118 Zambia 0.9%
119 Costa Rica 0.9%
120 Palau 0.8%
121 Panama 0.8%
122 Cameroon 0.8%
123 Tanzania 0.7%
124 Indonesia 0.7%
125 Spain 0.6%
126 Iceland 0.5%
127 Trinidad and Tobago 0.5%
128 Austria 0.5%
129 Cote d'Ivoire 0.5%
130 Seychelles 0.4%
131 Korea, Rep. 0.4%
132 Italy 0.4%
133 Germany 0.4%
134 Sweden 0.4%
135 Denmark 0.3%
136 Malaysia 0.3%
137 Namibia 0.3%
138 Switzerland 0.3%
139 Finland 0.3%
140 Botswana 0.3%
141 Greece 0.2%
142 Ethiopia 0.2%
143 Qatar 0.2%
144 Russian Federation 0.2%
145 Brazil 0.2%
146 China 0.2%
147 South Africa 0.2%
148 Iraq 0.2%
149 Guinea 0.2%
150 Netherlands 0.2%
151 Uruguay 0.1%
152 Kazakhstan 0.1%
153 Hong Kong SAR, China 0.1%
154 Argentina 0.1%
155 Norway 0.1%
156 Japan 0.1%
157 Maldives 0.08%
158 Turkey 0.08%
159 United Kingdom 0.07%
160 Macao SAR, China 0.07%
161 Ireland 0.05%
162 Australia 0.04%
163 Oman 0.04%
164 Saudi Arabia 0.03%
165 Chile 0.02%
166 United States 0.02%
167 Gabon 0.02%
168 Kuwait 0.01%
169 Angola 0.01%
170 New Zealand 0.01%
171 Papua New Guinea 0.01%
172 Turkmenistan 0.001%

Known primarily as a tourist destination, the Polynesian country of Tonga banks on remittance inflows to support its economy. In 2022, the country’s incoming remittance flows were equal to almost 50% of its GDP.

Next on this list is Lebanon. The country received $6.8 billion in remittances in 2022, estimated to equal almost 38% of its GDP and making it a key support to the nation’s shrinking economy.

Tyler Durden Fri, 01/27/2023 - 23:25

Read More

Continue Reading

International

US Spent More Than Double What It Collected In February, As 2024 Deficit Is Second Highest Ever… And Debt Explodes

US Spent More Than Double What It Collected In February, As 2024 Deficit Is Second Highest Ever… And Debt Explodes

Earlier today, CNBC’s…

Published

on

US Spent More Than Double What It Collected In February, As 2024 Deficit Is Second Highest Ever... And Debt Explodes

Earlier today, CNBC's Brian Sullivan took a horse dose of Red Pills when, about six months after our readers, he learned that the US is issuing $1 trillion in debt every 100 days, which prompted him to rage tweet, (or rageX, not sure what the proper term is here) the following:

We’ve added 60% to national debt since 2018. Germany - a country with major economic woes - added ‘just’ 32%.   

Maybe it will never matter.   Maybe MMT is real.   Maybe we just cancel or inflate it out. Maybe career real estate borrowers or career politicians aren’t the answer.

I have no idea.  Only time will tell.   But it’s going to be fascinating to watch it play out.

He is right: it will be fascinating, and the latest budget deficit data simply confirmed that the day of reckoning will come very soon, certainly sooner than the two years that One River's Eric Peters predicted this weekend for the coming "US debt sustainability crisis."

According to the US Treasury, in February, the US collected $271 billion in various tax receipts, and spent $567 billion, more than double what it collected.

The two charts below show the divergence in US tax receipts which have flatlined (on a trailing 6M basis) since the covid pandemic in 2020 (with occasional stimmy-driven surges)...

... and spending which is about 50% higher compared to where it was in 2020.

The end result is that in February, the budget deficit rose to $296.3 billion, up 12.9% from a year prior, and the second highest February deficit on record.

And the punchline: on a cumulative basis, the budget deficit in fiscal 2024 which began on October 1, 2023 is now $828 billion, the second largest cumulative deficit through February on record, surpassed only by the peak covid year of 2021.

But wait there's more: because in a world where the US is spending more than twice what it is collecting, the endgame is clear: debt collapse, and while it won't be tomorrow, or the week after, it is coming... and it's also why the US is now selling $1 trillion in debt every 100 days just to keep operating (and absorbing all those millions of illegal immigrants who will keep voting democrat to preserve the socialist system of the US, so beloved by the Soros clan).

And it gets even worse, because we are now in the ponzi finance stage of the Minsky cycle, with total interest on the debt annualizing well above $1 trillion, and rising every day

... having already surpassed total US defense spending and soon to surpass total health spending and, finally all social security spending, the largest spending category of all, which means that US debt will now rise exponentially higher until the inevitable moment when the US dollar loses its reserve status and it all comes crashing down.

We conclude with another observation by CNBC's Brian Sullivan, who quotes an email by a DC strategist...

.. which lays out the proposed Biden budget as follows:

The budget deficit will growth another $16 TRILLION over next 10 years. Thats *with* the proposed massive tax hikes.

Without them the deficit will grow $19 trillion.

That's why you will hear the "deficit is being reduced by $3 trillion" over the decade.

No family budget or business could exist with this kind of math.

Of course, in the long run, neither can the US... and since neither party will ever cut the spending which everyone by now is so addicted to, the best anyone can do is start planning for the endgame.

Tyler Durden Tue, 03/12/2024 - 18:40

Read More

Continue Reading

Government

Buried Project Veritas Recording Shows Top Pfizer Scientists Suppressed Concerns Over COVID-19 Boosters, MRNA Tech

Buried Project Veritas Recording Shows Top Pfizer Scientists Suppressed Concerns Over COVID-19 Boosters, MRNA Tech

Submitted by Liam Cosgrove

Former…

Published

on

Buried Project Veritas Recording Shows Top Pfizer Scientists Suppressed Concerns Over COVID-19 Boosters, MRNA Tech

Submitted by Liam Cosgrove

Former Project Veritas & O’Keefe Media Group operative and Pfizer formulation analyst scientist Justin Leslie revealed previously unpublished recordings showing Pfizer’s top vaccine researchers discussing major concerns surrounding COVID-19 vaccines. Leslie delivered these recordings to Veritas in late 2021, but they were never published:

Featured in Leslie’s footage is Kanwal Gill, a principal scientist at Pfizer. Gill was weary of MRNA technology given its long research history yet lack of approved commercial products. She called the vaccines “sneaky,” suggesting latent side effects could emerge in time.

Gill goes on to illustrate how the vaccine formulation process was dramatically rushed under the FDA’s Emergency Use Authorization and adds that profit incentives likely played a role:

"It’s going to affect my heart, and I’m going to die. And nobody’s talking about that."

Leslie recorded another colleague, Pfizer’s pharmaceutical formulation scientist Ramin Darvari, who raised the since-validated concern that repeat booster intake could damage the cardiovascular system:

None of these claims will be shocking to hear in 2024, but it is telling that high-level Pfizer researchers were discussing these topics in private while the company assured the public of “no serious safety concerns” upon the jab’s release:

Vaccine for Children is a Different Formulation

Leslie sent me a little-known FDA-Pfizer conference — a 7-hour Zoom meeting published in tandem with the approval of the vaccine for 5 – 11 year-olds — during which Pfizer’s vice presidents of vaccine research and development, Nicholas Warne and William Gruber, discussed a last-minute change to the vaccine’s “buffer” — from “PBS” to “Tris” — to improve its shelf life. For about 30 seconds of these 7 hours, Gruber acknowledged that the new formula was NOT the one used in clinical trials (emphasis mine):


“The studies were done using the same volume… but contained the PBS buffer. We obviously had extensive consultations with the FDA and it was determined that the clinical studies were not required because, again, the LNP and the MRNA are the same and the behavior — in terms of reactogenicity and efficacy — are expected to be the same.

According to Leslie, the tweaked “buffer” dramatically changed the temperature needed for storage: “Before they changed this last step of the formulation, the formula was to be kept at -80 degrees Celsius. After they changed the last step, we kept them at 2 to 8 degrees celsius,” Leslie told me.

The claims are backed up in the referenced video presentation:

I’m no vaccinologist but an 80-degree temperature delta — and a 5x shelf-life in a warmer climate — seems like a significant change that might warrant clinical trials before commercial release.

Despite this information technically being public, there has been virtually no media scrutiny or even coverage — and in fact, most were told the vaccine for children was the same formula but just a smaller dose — which is perhaps due to a combination of the information being buried within a 7-hour jargon-filled presentation and our media being totally dysfunctional.

Bohemian Grove?

Leslie’s 2-hour long documentary on his experience at both Pfizer and O’Keefe’s companies concludes on an interesting note: James O’Keefe attended an outing at the Bohemian Grove.

Leslie offers this photo of James’ Bohemian Grove “GATE” slip as evidence, left on his work desk atop a copy of his book, “American Muckraker”:

My thoughts on the Bohemian Grove: my good friend’s dad was its general manager for several decades. From what I have gathered through that connection, the Bohemian Grove is not some version of the Illuminati, at least not in the institutional sense.

Do powerful elites hangout there? Absolutely. Do they discuss their plans for the world while hanging out there? I’m sure it has happened. Do they have a weird ritual with a giant owl? Yep, Alex Jones showed that to the world.

My perspective is based on conversations with my friend and my belief that his father is not lying to him. I could be wrong and am open to evidence — like if boxer Ryan Garcia decides to produce evidence regarding his rape claims — and I do find it a bit strange the club would invite O’Keefe who is notorious for covertly filming, but Occam’s razor would lead me to believe the club is — as it was under my friend’s dad — run by boomer conservatives the extent of whose politics include disliking wokeness, immigration, and Biden (common subjects of O’Keefe’s work).

Therefore, I don’t find O’Keefe’s visit to the club indicative that he is some sort of Operation Mockingbird asset as Leslie tries to depict (however Mockingbird is a 100% legitimate conspiracy). I have also met James several times and even came close to joining OMG. While I disagreed with James on the significance of many of his stories — finding some to be overhyped and showy — I never doubted his conviction in them.

As for why Leslie’s story was squashed… all my sources told me it was to avoid jail time for Veritas executives.

Feel free to watch Leslie’s full documentary here and decide for yourself.

Fun fact — Justin Leslie was also the operative behind this mega-viral Project Veritas story where Pfizer’s director of R&D claimed the company was privately mutating COVID-19 behind closed doors:

Tyler Durden Tue, 03/12/2024 - 13:40

Read More

Continue Reading

International

Association of prenatal vitamins and metals with epigenetic aging at birth and in childhood

“[…] our findings support the hypothesis that the intrauterine environment, particularly essential and non-essential metals, affect epigenetic aging…

Published

on

“[…] our findings support the hypothesis that the intrauterine environment, particularly essential and non-essential metals, affect epigenetic aging biomarkers across the life course.”

Credit: 2024 Bozack et al.

“[…] our findings support the hypothesis that the intrauterine environment, particularly essential and non-essential metals, affect epigenetic aging biomarkers across the life course.”

BUFFALO, NY- March 12, 2024 – A new research paper was published in Aging (listed by MEDLINE/PubMed as “Aging (Albany NY)” and “Aging-US” by Web of Science) Volume 16, Issue 4, entitled, “Associations of prenatal one-carbon metabolism nutrients and metals with epigenetic aging biomarkers at birth and in childhood in a US cohort.”

Epigenetic gestational age acceleration (EGAA) at birth and epigenetic age acceleration (EAA) in childhood may be biomarkers of the intrauterine environment. In this new study, researchers Anne K. Bozack, Sheryl L. Rifas-Shiman, Andrea A. Baccarelli, Robert O. Wright, Diane R. Gold, Emily Oken, Marie-France Hivert, and Andres Cardenas from Stanford University School of Medicine, Harvard Medical School, Harvard T.H. Chan School of Public Health, Columbia University, and Icahn School of Medicine at Mount Sinai investigated the extent to which first-trimester folate, B12, 5 essential and 7 non-essential metals in maternal circulation are associated with EGAA and EAA in early life. 

“[…] we hypothesized that OCM [one-carbon metabolism] nutrients and essential metals would be positively associated with EGAA and non-essential metals would be negatively associated with EGAA. We also investigated nonlinear associations and associations with mixtures of micronutrients and metals.”

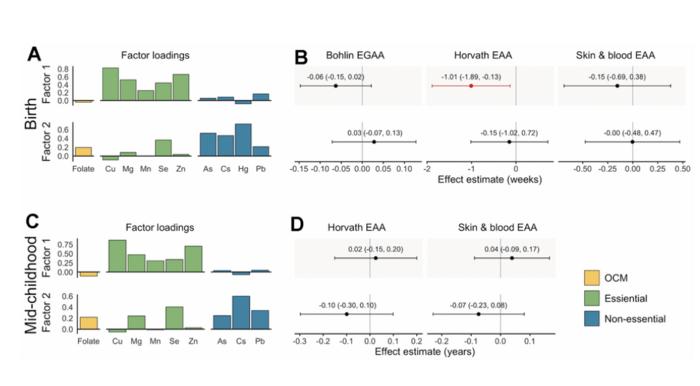
Bohlin EGAA and Horvath pan-tissue and skin and blood EAA were calculated using DNA methylation measured in cord blood (N=351) and mid-childhood blood (N=326; median age = 7.7 years) in the Project Viva pre-birth cohort. A one standard deviation increase in individual essential metals (copper, manganese, and zinc) was associated with 0.94-1.2 weeks lower Horvath EAA at birth, and patterns of exposures identified by exploratory factor analysis suggested that a common source of essential metals was associated with Horvath EAA. The researchers also observed evidence of nonlinear associations of zinc with Bohlin EGAA, magnesium and lead with Horvath EAA, and cesium with skin and blood EAA at birth. Overall, associations at birth did not persist in mid-childhood; however, arsenic was associated with greater EAA at birth and in childhood. 

“Prenatal metals, including essential metals and arsenic, are associated with epigenetic aging in early life, which might be associated with future health.”


Read the full paper: DOI: https://doi.org/10.18632/aging.205602 

Corresponding Author: Andres Cardenas

Corresponding Email: andres.cardenas@stanford.edu 

Keywords: epigenetic age acceleration, metals, folate, B12, prenatal exposures

Click here to sign up for free Altmetric alerts about this article.


About Aging:

Launched in 2009, Aging publishes papers of general interest and biological significance in all fields of aging research and age-related diseases, including cancer—and now, with a special focus on COVID-19 vulnerability as an age-dependent syndrome. Topics in Aging go beyond traditional gerontology, including, but not limited to, cellular and molecular biology, human age-related diseases, pathology in model organisms, signal transduction pathways (e.g., p53, sirtuins, and PI-3K/AKT/mTOR, among others), and approaches to modulating these signaling pathways.

Please visit our website at www.Aging-US.com​​ and connect with us:

  • Facebook
  • X, formerly Twitter
  • Instagram
  • YouTube
  • LinkedIn
  • Reddit
  • Pinterest
  • Spotify, and available wherever you listen to podcasts


Click here to subscribe to Aging publication updates.

For media inquiries, please contact media@impactjournals.com.


Aging (Aging-US) Journal Office

6666 E. Quaker Str., Suite 1B

Orchard Park, NY 14127

Phone: 1-800-922-0957, option 1

###


Read More

Continue Reading

Trending