Valuing the S&P 500: Pre and post virus
Valuing the S&P 500: Pre and post virus
Share this:

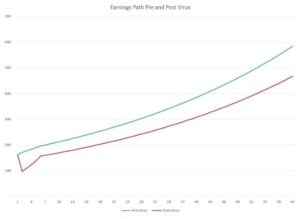

In a previous article, I presented a rough approximation to help illuminate how the Covid-19 outbreak might affect the value of American stocks as represented by the S&P 500 Index. Here I take a deeper drive and provide a full spreadsheet model. In the model, the virus has two fundamental effects. First, it depresses earnings next year and second it prevents earnings from ever meeting pre-virus expectations. The best way to see how this works is with reference to the graph below.

Q4 2019 hedge fund letters, conferences and more

Value of the S&P 500 explained
The green line shows the expected path of earnings for the S&P 500 stocks as of early February 2020 when stock prices were near their peak. The line starts at $163; the effective earnings per share of the S&P 500 during the previous twelve months. It then grows 5.52% the next year and 3.36% the following four years. These growth rates are derived from analyst forecasts available in early February 2020. Finally, from year six forward the growth rate falls to a level of 2.00% which is maintained into perpetuity. I note that this is a relatively low long-run growth rate, approximately equal to the long-run expected rate of inflation.
The red line differs from the green line in two respects, both of which the reader can vary using a slider in the spreadsheet (download below). The first difference is that rather than rising in the first year, earnings are expected to fall. In the graph, the assumed drop is 40%, equal to the decline in annual earnings observed at the height of the great 2008 recession. The second variable is the fraction of year five pre-virus earnings are that earned in year five in the post-virus world.
In the graph, this is assumed to be 80% of the pre-virus year five earnings. In year six and beyond, earnings are assumed to grow at 2.00% just as they do in the pre-virus case. However, because of the 20% earnings gap in year five, the assumption of the same long-run growth rate means that the differential between the pre-virus and post-virus lines widens in dollar terms going forward.
What will stocks do next
To convert the graph into an estimate of the intrinsic value of the S&P 500 index using discounted cash flow analysis requires two added inputs. The first is the fraction of earnings that are paid out to shareholders as dividends or buybacks. The second is a discount rate for calculating present value. With regard to the fraction of earnings paid out, I use estimates posted by Professor Aswath Damodaran on his website.
I use the same payout fractions for both pre- and post-virus calculations. One might argue that the payout rates will be depressed, even as a fraction of the lower earnings, post-virus. The reader is free to make that alteration in the spreadsheet. Finally, I use a discount rate of 6.70% in both the pre- and post-virus case. The low discount rate reflects the current low level of interest rates. Once again, the reader should feel free to replace my estimate with his or her choice in the spreadsheet.
Given the earnings path shown by the redline, the cash payout rates, and the discount rate described above, the intrinsic value of the S&P 500 comes to 3,220.54. This is only slightly less than the average level of the actual index in the month before the virus collapse began which is approximately 3,300. This suggests that overall, the model inputs are consistent with what the market was thinking at the time.
Value of the S&P 500 assumptions
Using my assumptions that earnings would drop 40% in the first year and only recover to 80% of their expected pre-virus level by year five, the intrinsic value of the S&P 500 index drops to 2,491.69. In comparison, the index closed at 2,541.47 on Friday, March 27. Once again, the numbers are reasonably close to market values. If one used more optimistic assumptions, for example, a 15% drop in earnings growth the first year and recovering by 95% in year five, then the intrinsic value jumps up to 3,007.67, for a decline of only 6.6%.
The analysis using my assumptions implies that virus has caused the intrinsic value of the stocks in the S&P 500 index to fall by 22.6%. Applying this percentage to the approximate value of all stocks listed in the United States translates into a dollar loss of about $9.5 trillion dollars. In a famous TED presentation that Bill Gates made in 2015, he suggested that the world was unprepared for a pandemic and, therefore, global costs could be $3 trillion. Apparently, he significantly underestimated the cost. However, that conclusion is sensitive to the assumptions used in the discounted cash flow model. I urge the reader to download the spreadsheet and play with the inputs so as to reach his or her own conclusion as to the intrinsic value of the S&P 500 index.
Click here to download interactive excel spreadsheet.
The post Valuing the S&P 500: Pre and post virus appeared first on ValueWalk.
Uncategorized
Homes listed for sale in early June sell for $7,700 more
New Zillow research suggests the spring home shopping season may see a second wave this summer if mortgage rates fall
The post Homes listed for sale in…
Share this:


- A Zillow analysis of 2023 home sales finds homes listed in the first two weeks of June sold for 2.3% more.
- The best time to list a home for sale is a month later than it was in 2019, likely driven by mortgage rates.
- The best time to list can be as early as the second half of February in San Francisco, and as late as the first half of July in New York and Philadelphia.
Spring home sellers looking to maximize their sale price may want to wait it out and list their home for sale in the first half of June. A new Zillow® analysis of 2023 sales found that homes listed in the first two weeks of June sold for 2.3% more, a $7,700 boost on a typical U.S. home.
The best time to list consistently had been early May in the years leading up to the pandemic. The shift to June suggests mortgage rates are strongly influencing demand on top of the usual seasonality that brings buyers to the market in the spring. This home-shopping season is poised to follow a similar pattern as that in 2023, with the potential for a second wave if the Federal Reserve lowers interest rates midyear or later.
The 2.3% sale price premium registered last June followed the first spring in more than 15 years with mortgage rates over 6% on a 30-year fixed-rate loan. The high rates put home buyers on the back foot, and as rates continued upward through May, they were still reassessing and less likely to bid boldly. In June, however, rates pulled back a little from 6.79% to 6.67%, which likely presented an opportunity for determined buyers heading into summer. More buyers understood their market position and could afford to transact, boosting competition and sale prices.
The old logic was that sellers could earn a premium by listing in late spring, when search activity hit its peak. Now, with persistently low inventory, mortgage rate fluctuations make their own seasonality. First-time home buyers who are on the edge of qualifying for a home loan may dip in and out of the market, depending on what’s happening with rates. It is almost certain the Federal Reserve will push back any interest-rate cuts to mid-2024 at the earliest. If mortgage rates follow, that could bring another surge of buyers later this year.
Mortgage rates have been impacting affordability and sale prices since they began rising rapidly two years ago. In 2022, sellers nationwide saw the highest sale premium when they listed their home in late March, right before rates barreled past 5% and continued climbing.
Zillow’s research finds the best time to list can vary widely by metropolitan area. In 2023, it was as early as the second half of February in San Francisco, and as late as the first half of July in New York. Thirty of the top 35 largest metro areas saw for-sale listings command the highest sale prices between May and early July last year.
Zillow also found a wide range in the sale price premiums associated with homes listed during those peak periods. At the hottest time of the year in San Jose, homes sold for 5.5% more, a $88,000 boost on a typical home. Meanwhile, homes in San Antonio sold for 1.9% more during that same time period.
| Metropolitan Area | Best Time to List | Price Premium | Dollar Boost |
| United States | First half of June | 2.3% | $7,700 |
| New York, NY | First half of July | 2.4% | $15,500 |
| Los Angeles, CA | First half of May | 4.1% | $39,300 |
| Chicago, IL | First half of June | 2.8% | $8,800 |
| Dallas, TX | First half of June | 2.5% | $9,200 |
| Houston, TX | Second half of April | 2.0% | $6,200 |
| Washington, DC | Second half of June | 2.2% | $12,700 |
| Philadelphia, PA | First half of July | 2.4% | $8,200 |
| Miami, FL | First half of June | 2.3% | $12,900 |
| Atlanta, GA | Second half of June | 2.3% | $8,700 |
| Boston, MA | Second half of May | 3.5% | $23,600 |
| Phoenix, AZ | First half of June | 3.2% | $14,700 |
| San Francisco, CA | Second half of February | 4.2% | $50,300 |
| Riverside, CA | First half of May | 2.7% | $15,600 |
| Detroit, MI | First half of July | 3.3% | $7,900 |
| Seattle, WA | First half of June | 4.3% | $31,500 |
| Minneapolis, MN | Second half of May | 3.7% | $13,400 |
| San Diego, CA | Second half of April | 3.1% | $29,600 |
| Tampa, FL | Second half of June | 2.1% | $8,000 |
| Denver, CO | Second half of May | 2.9% | $16,900 |
| Baltimore, MD | First half of July | 2.2% | $8,200 |
| St. Louis, MO | First half of June | 2.9% | $7,000 |
| Orlando, FL | First half of June | 2.2% | $8,700 |
| Charlotte, NC | Second half of May | 3.0% | $11,000 |
| San Antonio, TX | First half of June | 1.9% | $5,400 |
| Portland, OR | Second half of April | 2.6% | $14,300 |
| Sacramento, CA | First half of June | 3.2% | $17,900 |
| Pittsburgh, PA | Second half of June | 2.3% | $4,700 |
| Cincinnati, OH | Second half of April | 2.7% | $7,500 |
| Austin, TX | Second half of May | 2.8% | $12,600 |
| Las Vegas, NV | First half of June | 3.4% | $14,600 |
| Kansas City, MO | Second half of May | 2.5% | $7,300 |
| Columbus, OH | Second half of June | 3.3% | $10,400 |
| Indianapolis, IN | First half of July | 3.0% | $8,100 |
| Cleveland, OH | First half of July | 3.4% | $7,400 |
| San Jose, CA | First half of June | 5.5% | $88,400 |
The post Homes listed for sale in early June sell for $7,700 more appeared first on Zillow Research.
federal reserve pandemic home sales mortgage rates interest ratesGovernment
Survey Shows Declining Concerns Among Americans About COVID-19
Survey Shows Declining Concerns Among Americans About COVID-19
A new survey reveals that only 20% of Americans view covid-19 as "a major threat"…
Share this:


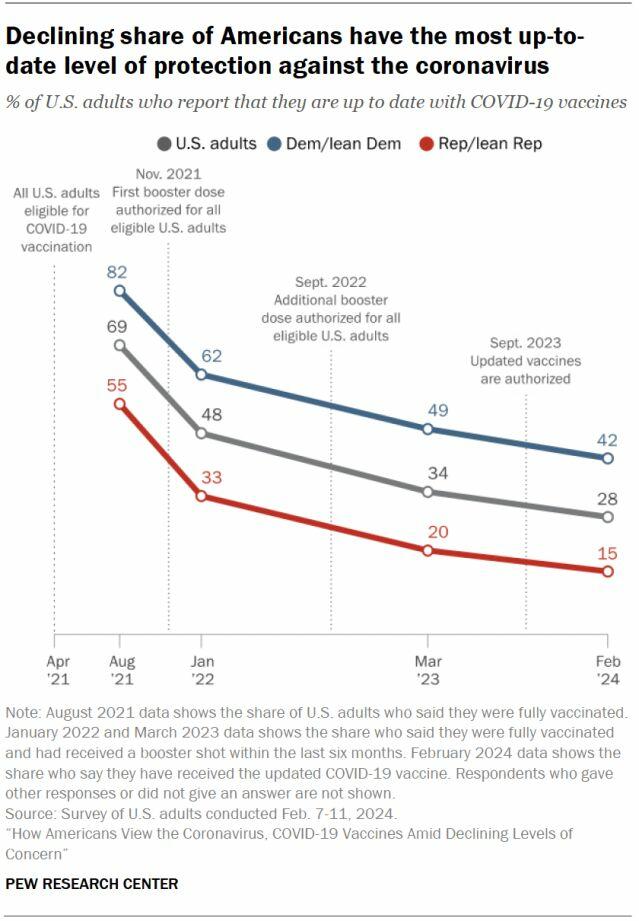
A new survey reveals that only 20% of Americans view covid-19 as "a major threat" to the health of the US population - a sharp decline from a high of 67% in July 2020.
What's more, the Pew Research Center survey conducted from Feb. 7 to Feb. 11 showed that just 10% of Americans are concerned that they will catch the disease and require hospitalization.
"This data represents a low ebb of public concern about the virus that reached its height in the summer and fall of 2020, when as many as two-thirds of Americans viewed COVID-19 as a major threat to public health," reads the report, which was published March 7.
According to the survey, half of the participants understand the significance of researchers and healthcare providers in understanding and treating long COVID - however 27% of participants consider this issue less important, while 22% of Americans are unaware of long COVID.
What's more, while Democrats were far more worried than Republicans in the past, that gap has narrowed significantly.
"In the pandemic’s first year, Democrats were routinely about 40 points more likely than Republicans to view the coronavirus as a major threat to the health of the U.S. population. This gap has waned as overall levels of concern have fallen," reads the report.
More via the Epoch Times;
The survey found that three in ten Democrats under 50 have received an updated COVID-19 vaccine, compared with 66 percent of Democrats ages 65 and older.
Moreover, 66 percent of Democrats ages 65 and older have received the updated COVID-19 vaccine, while only 24 percent of Republicans ages 65 and older have done so.
“This 42-point partisan gap is much wider now than at other points since the start of the outbreak. For instance, in August 2021, 93 percent of older Democrats and 78 percent of older Republicans said they had received all the shots needed to be fully vaccinated (a 15-point gap),” it noted.
COVID-19 No Longer an Emergency
The U.S. Centers for Disease Control and Prevention (CDC) recently issued its updated recommendations for the virus, which no longer require people to stay home for five days after testing positive for COVID-19.
The updated guidance recommends that people who contracted a respiratory virus stay home, and they can resume normal activities when their symptoms improve overall and their fever subsides for 24 hours without medication.
“We still must use the commonsense solutions we know work to protect ourselves and others from serious illness from respiratory viruses, this includes vaccination, treatment, and staying home when we get sick,” CDC director Dr. Mandy Cohen said in a statement.
The CDC said that while the virus remains a threat, it is now less likely to cause severe illness because of widespread immunity and improved tools to prevent and treat the disease.
“Importantly, states and countries that have already adjusted recommended isolation times have not seen increased hospitalizations or deaths related to COVID-19,” it stated.
The federal government suspended its free at-home COVID-19 test program on March 8, according to a website set up by the government, following a decrease in COVID-19-related hospitalizations.
According to the CDC, hospitalization rates for COVID-19 and influenza diseases remain “elevated” but are decreasing in some parts of the United States.
Government
Rand Paul Teases Senate GOP Leader Run – Musk Says “I Would Support”
Rand Paul Teases Senate GOP Leader Run – Musk Says "I Would Support"
Republican Kentucky Senator Rand Paul on Friday hinted that he may jump…
Share this:

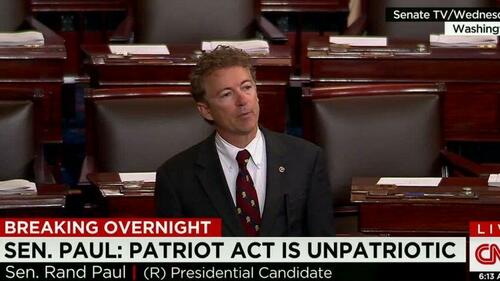
Republican Kentucky Senator Rand Paul on Friday hinted that he may jump into the race to become the next Senate GOP leader, and Elon Musk was quick to support the idea. Republicans must find a successor for periodically malfunctioning Mitch McConnell, who recently announced he'll step down in November, though intending to keep his Senate seat until his term ends in January 2027, when he'd be within weeks of turning 86.
So far, the announced field consists of two quintessential establishment types: John Cornyn of Texas and John Thune of South Dakota. While John Barrasso's name had been thrown around as one of "The Three Johns" considered top contenders, the Wyoming senator on Tuesday said he'll instead seek the number two slot as party whip.
Paul used X to tease his potential bid for the position which -- if the GOP takes back the upper chamber in November -- could graduate from Minority Leader to Majority Leader. He started by telling his 5.1 million followers he'd had lots of people asking him about his interest in running...
Thousands of people have been asking if I'd run for Senate leadership...
— Rand Paul (@RandPaul) March 8, 2024
...then followed up with a poll in which he predictably annihilated Cornyn and Thune, taking a 96% share as of Friday night, with the other two below 2% each.
????????️VOTE NOW ????️ ???? Who would you like to be the next Senate leader?
— Rand Paul (@RandPaul) March 8, 2024
Elon Musk was quick to back the idea of Paul as GOP leader, while daring Cornyn and Thune to follow Paul's lead by throwing their names out for consideration by the Twitter-verse X-verse.
I would support Rand Paul and suspect that other candidates will not actually run polls out of concern for the results, but let’s see if they will!
— Elon Musk (@elonmusk) March 8, 2024
Paul has been a stalwart opponent of security-state mass surveillance, foreign interventionism -- to include shoveling billions of dollars into the proxy war in Ukraine -- and out-of-control spending in general. He demonstrated the latter passion on the Senate floor this week as he ridiculed the latest kick-the-can spending package:
This bill is an insult to the American people. The earmarks are all the wasteful spending that you could ever hope to see, and it should be defeated. Read more: https://t.co/Jt8K5iucA4 pic.twitter.com/I5okd4QgDg
— Senator Rand Paul (@SenRandPaul) March 8, 2024
In February, Paul used Senate rules to force his colleagues into a grueling Super Bowl weekend of votes, as he worked to derail a $95 billion foreign aid bill. "I think we should stay here as long as it takes,” said Paul. “If it takes a week or a month, I’ll force them to stay here to discuss why they think the border of Ukraine is more important than the US border.”
Don't expect a Majority Leader Paul to ditch the filibuster -- he's been a hardy user of the legislative delay tactic. In 2013, he spoke for 13 hours to fight the nomination of John Brennan as CIA director. In 2015, he orated for 10-and-a-half-hours to oppose extension of the Patriot Act.
Among the general public, Paul is probably best known as Capitol Hill's chief tormentor of Dr. Anthony Fauci, who was director of the National Institute of Allergy and Infectious Disease during the Covid-19 pandemic. Paul says the evidence indicates the virus emerged from China's Wuhan Institute of Virology. He's accused Fauci and other members of the US government public health apparatus of evading questions about their funding of the Chinese lab's "gain of function" research, which takes natural viruses and morphs them into something more dangerous. Paul has pointedly said that Fauci committed perjury in congressional hearings and that he belongs in jail "without question."
Musk is neither the only nor the first noteworthy figure to back Paul for party leader. Just hours after McConnell announced his upcoming step-down from leadership, independent 2024 presidential candidate Robert F. Kennedy, Jr voiced his support:
Mitch McConnell, who has served in the Senate for almost 40 years, announced he'll step down this November.
— Robert F. Kennedy Jr (@RobertKennedyJr) February 28, 2024
Part of public service is about knowing when to usher in a new generation. It’s time to promote leaders in Washington, DC who won’t kowtow to the military contractors or…
In a testament to the extent to which the establishment recoils at the libertarian-minded Paul, mainstream media outlets -- which have been quick to report on other developments in the majority leader race -- pretended not to notice that Paul had signaled his interest in the job. More than 24 hours after Paul's test-the-waters tweet-fest began, not a single major outlet had brought it to the attention of their audience.
That may be his strongest endorsement yet.


Veterans Affairs Kept COVID-19 Vaccine Mandate In Place Without Evidence


The Coming Of The Police State In America


‘I couldn’t stand the pain’: the Turkish holiday resort that’s become an emergency dental centre for Britons who can’t get treated at home


Beloved mall retailer files Chapter 7 bankruptcy, will liquidate


February Employment Situation


Low Iron Levels In Blood Could Trigger Long COVID: Study


Rand Paul Teases Senate GOP Leader Run – Musk Says “I Would Support”


Another beloved brewery files Chapter 11 bankruptcy


Walmart has really good news for shoppers (and Joe Biden)
Walmart joins Costco in sharing key pricing news
-

 Uncategorized3 weeks ago
All Of The Elements Are In Place For An Economic Crisis Of Staggering Proportions
-

 Uncategorized1 month ago
Cathie Wood sells a major tech stock (again)
-

 Uncategorized3 weeks ago
California Counties Could Be Forced To Pay $300 Million To Cover COVID-Era Program
-

 Uncategorized2 weeks ago
Apparel Retailer Express Moving Toward Bankruptcy
-

 Uncategorized4 weeks ago
Industrial Production Decreased 0.1% in January
-

 International3 days ago
Walmart launches clever answer to Target’s new membership program
-

 International3 days ago
EyePoint poaches medical chief from Apellis; Sandoz CFO, longtime BioNTech exec to retire
-

 Uncategorized3 weeks ago
RFK Jr: The Wuhan Cover-Up & The Rise Of The Biowarfare-Industrial Complex