Connect with us

Tverberg: Why A Great Reset Based On Green Energy Isn’t Possible

Tverberg: Why A Great Reset Based On Green Energy Isn’t Possible

Published

on

Tverberg: Why A Great Reset Based On Green Energy Isn't Possible Tyler Durden Sat, 07/18/2020 - 13:30

Authored by Gail Tverberg via Our Finite World blog,

It seems like a reset of an economy should work like a reset of your computer: Turn it off and turn it back on again; most problems should be fixed. However, it doesn’t really work that way. Let’s look at a few of the misunderstandings that lead people to believe that the world economy can move to a Green Energy future.

[1] The economy isn’t really like a computer that can be switched on and off; it is more comparable to a human body that is dead, once it is switched off.

A computer is something that is made by humans. There is a beginning and an end to the process of making it. The computer works because energy in the form of electrical current flows through it. We can turn the electricity off and back on again. Somehow, almost like magic, software issues are resolved, and the system works better after the reset than before.

Even though the economy looks like something made by humans, it really is extremely different. In physics terms, it is a “dissipative structure.” It is able to “grow” only because of energy consumption, such as oil to power trucks and electricity to power machines.

The system is self-organizing in the sense that new businesses are formed based on the resources available and the apparent market for products made using these resources. Old businesses disappear when their products are no longer needed. Customers make decisions regarding what to buy based on their incomes, the amount of debt available to them, and the choice of goods available in the marketplace.

There are many other dissipative structures. Hurricanes and tornadoes are dissipative structures. So are stars. Plants and animals are dissipative structures. Ecosystems of all kinds are dissipative structures. All of these things grow for a time and eventually collapse. If their energy source is taken away, they fail quite quickly. The energy source for humans is food of various types; for plants it is generally sunlight.

Thinking that we can switch the economy off and on again comes close to assuming that we can resurrect human beings after they die. Perhaps this is possible in a religious sense. But assuming that we can do this with an economy requires a huge leap of faith.

[2] Economic growth has a definite pattern to it, rather than simply increasing without limit. 

Many people have developed models reflecting the fact that economic growth seems to come in waves or cycles. Ray Dalio shows a chart describing his view of the economic cycle in a preview to his upcoming book, The Changing World Order. Figure 1 is Dalio’s chart, with some annotations I have added in blue.

Figure 1. New World Order chart by Ray Dalio from an introduction to his theory called The Changing World Order. Annotations in blue added by Gail Tverberg.

Modelers of all kinds would like to think that there are no limits in this world. Actually, there are many limits. It is the fact that economies have to work around limits that leads to cycles such as these. Some examples of limits include inadequate arable land for a growing population, inability to fight off pathogens, and an energy supply that becomes excessively expensive to produce. Cycles can be expected to vary in steepness, both on the upside and the downside of the cycle.

The danger of ignoring these cycles is that researchers tend to create models of future economic growth and future energy consumption that are far out of sync with what really can be expected. Accurate models need to include at least some limited version of overshoot and collapse on a regular basis. Models of the future economy tend to be based on what politicians would like to believe will happen, rather than what actually can be expected to happen in the real world.

[3] Commodity prices behave differently at different stages of the economic cycle. During the second half of the economic cycle, it becomes difficult to keep commodity prices high enough for producers. 

There is a common belief that demand for energy products will always be high, because everyone knows we need energy. Thus, according to this belief, if we have the technology to extract fossil fuels, prices will eventually rise high enough that fossil fuels resources can easily be extracted. Many people have been concerned the we might “run out” of oil. They expect that oil prices will rise to compensate for the shortages. Thus, many people believe that in order to maintain adequate supply, we should be concerned about supplementing fossil fuels with nuclear power and renewable energy.

If we examine oil prices (Figure 2), we see that at least recently, this is not the way oil prices actually behave. Since the spike in oil prices in 2008, the big problem has been prices that fall too low for oil producers. At prices well below $100 per barrel, development of many new oil fields is not economic. Low oil prices are especially a problem in 2020 because travel restrictions associated with the coronavirus pandemic reduce oil demand (and prices) even below where they were previously.

Figure 2. Weekly average spot oil prices for Brent, based on data of the US Energy Information Administration.

Strangely enough, coal prices (Figure 3) seem to follow a very similar pattern to oil prices, even though coal is commonly believed to be available in huge supply, and oil is commonly believed to be in short supply.

Figure 3. Selected Spot Coal Prices, from BP’s 2020 Statistical Review of World Energy. Prices are annual averages. Price for China is Qinhuangdao spot price; price for US is Central Appalachian coal spot index; price for Europe is Northwest European marker price.

Comparing Figures 2 and 3, we see that prices for both oil and coal rose to a peak in 2008, then fell back sharply. The timing of this drop in prices corresponds with the “debt bust” in late 2008 that is shown in Figure 1.

Prices then rose to another peak in 2011, after several years of Quantitative Easing (QE). QE is intended to hold the cost of borrowing down, encouraging the use of more debt. This debt can be used by citizens to buy more goods made with coal and oil (such as cars and solar panels). Thus, QE is a way to increase demand and thus help raise energy prices. In the 2011-2014 period, oil was able to maintain its price better than coal, perhaps because of its short supply. Once the United States discontinued its QE program in 2014, oil prices dropped like a rock (Figure 2).

Prices were very low in 2015 and 2016 for both coal and oil. China stimulated its economy, and prices for both coal and oil were able to rise again in 2017 and 2018. By 2019, prices for both oil and coal were falling again. Figure 2 shows that in 2020, oil prices have fallen again, as the result of all of the demand destruction caused by all of the pandemic shutdowns. Coal prices have also fallen in 2020, according to Trading Economics.

[4] The low prices since mid-2008 seem to be leading to both peak crude oil and peak coal. Crude oil production started falling in 2019 and can be expected to continue falling in 2020. Coal extraction seems likely to start falling in 2020.

In the last section, I showed that crude oil and coal both have the same problem: Prices tend to be too low for producers to make a profit extracting them. For this reason, investment in new oil wells is being reduced, and unprofitable coal mines are being closed.

Figure 4 shows that world crude oil production has not grown much since 2004. In fact, OPEC’s production has not grown much since 2004, even though OPEC countries report high oil reserves so, in theory, they could pump more oil if they chose to.

Figure 4. World crude oil production (including condensate) based on data from BP’s 2020 Statistical Review of World Energy. Russia+ refers to the group Commonwealth of Independent States.

In total, BP data shows that world crude oil production fell by 582,000 barrels per day, comparing 2019 to 2018. This represents a drop of 2.0 million barrels per day in OPEC production, offset by smaller increases in production for the US, Canada, and Russia. Crude oil production is expected to fall further in 2020, because of low demand and prices.

Because of continued low coal prices, world coal production has been on a bumpy plateau since 2011. Prices seem to be even lower in 2020 than in 2019, putting further downward pressure on coal extraction in 2020.

Figure 5. World coal production based on data from BP’s 2020 Statistical Review of World Energy.

[5] Modelers missed the fact that fossil fuel extraction would disappear because of low prices, leaving nearly all reserves and other resources in the ground. Modelers instead assumed that renewables would always be an extension of a fossil fuel-powered system.

The thing that most people do not understand is that commodity prices are set by the laws of physics, so that supply and demand are in balance. Demand is really very close to “affordability.” If there is too much wage/wealth disparity, commodity prices tend to fall too low. In a globalized world, many workers earn only a few dollars a day. Because of their low wages, these low-paid workers cannot afford to purchase very much of the world’s goods and services. The use of robots tends to produce a similar result because robots can’t actually purchase goods and services made by the economy.

Thus, modelers looking at Energy Return on Energy Invested (EROI) for wind and for solar assumed that they would always be used inside of a fossil fuel powered system that could provide heavily subsidized balancing for their intermittent output. They made calculations as if intermittent electricity is equivalent to electricity that can be controlled to provide electricity when it is needed. Their calculations seemed to suggest that making wind and solar would be useful. The thing that was overlooked was that this was only possible within a system where other fuels would provide balancing at a very low cost.

[6] The same issue of low demand leading to low prices affects commodities of all kinds. As a result, many of the future resources that modelers count on, and that companies depend upon as the basis for borrowing, are unlikely to really be available.

Commodities of all kinds are being affected by low demand and low selling prices. The problem giving rise to low prices seems to be related to excessive specialization, excessive use of capital goods to replace labor, and excessive use of globalization. These issues are all related to the needs of a world economy that depends on a high level of technology. In such an economy, too much of the output of the economy goes to producing devices and to paying highly trained workers. Little is left for non-elite workers.

The low selling prices of commodities makes it impossible for employers to pay adequate wages to most of their workers. These low wages, in turn, feed through to the uprisings we have been seeing in the last couple of years. These uprisings are part of “Revolutions and Wars” mentioned in Figure 1. It is difficult to see how this problem will disappear without a major change in the “World Order,” mentioned in the same figure.

Because the problem of low commodity prices is widespread, our ability to produce electrical backup of all kinds, including the ability to make batteries, can be expected to become an increasing problem. Commodities, such as lithium, suffer from low prices, not unlike the low prices for coal and oil. These low prices lead to cutbacks in their production and local uprisings.

[7] On a stand-alone basis, intermittent renewables have very limited usefulness. Their true value is close to zero.

If electricity is only available when the sun is shining, or when the wind is blowing, industry cannot plan for its use. Its use must be limited to applications where intermittency doesn’t matter, such as pumping water for animals to drink or desalinating water. No one would attempt to smelt metals with intermittent electricity because the metals would set at the wrong time, if the intermittent electricity suddenly disappeared. No one would power an elevator with intermittent electricity, because a person could easily be trapped between floors. Homeowners would not use electricity to power refrigerators, because, as likely as not, the food would spoil when electricity was off for long periods. Traffic signals would work sometimes, but not others.

Lebanon is an example of a country whose electricity system works only intermittently. It is hard to imagine that any other country would want to imitate Lebanon. Lack of reliable electricity supply leads to protests in Lebanon.

[8] The true cost of wind and solar has been hidden from everyone, using subsidies whose total cost is hard to determine.

Each country has its own way of providing subsidies to renewables. Most countries give wind and solar the subsidy of “going first.” They are often given a fixed rate as well. Both of these are subsidies. In the US, other subsidies are buried in the tax system. Recently, there has been talk of using QE to help wind and solar providers lower their cost of borrowing.

Newspapers regularly report that the price of wind and solar is at “grid parity,” but this is not an apples to apples comparison. To be useful, electricity needs to be available when users need it. The cost of storage is far too high to allow us to store electricity for weeks and months at a time.

If we were to use intermittent electricity as a substitute for fossil fuels in general, we would need to use intermittent electricity to heat homes and offices in winter. Sunshine is abundant in the summer, but not in the winter. Without storage, solar panels cannot even be counted on to provide homeowners with heat for cooking dinner after the sun sets in the evening. An incredibly huge amount of storage would be needed for storing heat from summer to winter.

China reports that it has $42 billion in unpaid clean energy subsidies, and this amount is getting larger each year. Countries are now becoming poorer and the taxes they are able to collect are lower. Their ability to subsidize a high cost, unreliable electricity system is disappearing.

[9] Wind, solar, and hydroelectric today only comprise a little under 10% of the world’s energy supply. 

We are deluding ourselves if we think we can get along on such a tiny total energy supply.

Figure 6. Hydroelectric, wind, and solar electricity as a percentage of world energy supply, based on BP’s 2020 Statistical Review of World Energy.

Few people understand what a small share of the world’s energy supply wind and solar provide today. The amounts shown in Figure 6 assume that the denominator is total energy (including oil, for example) not just electricity. In 2019, hydroelectric accounts for 6.4% of world energy supply. Wind accounts for 2.2%, and solar accounts for 1.1%. The three together amount to 9.7% of world energy supply.

None of these three energy types is suited for producing food. Oil is currently used for tilling fields, making herbicides and pesticides, and transporting refrigerated crops to market.

[10] Few people understand how important energy supply is for giving humans control over other species and pathogens.

Control over other species and pathogens has been a multistage effort. In recent years, this effort has involved antibiotics, antivirals and vaccines. Pasteurization became an important technique in the 1800s.

Human’s control over other species started over 100,000 years ago, when humans learned to burn biomass for many uses, including cooking foods, scaring away predators, and burning down entire forests to improve their food supply. In my 2018 post, Supplemental energy puts humans in charge, I wrote about one proof of the importance of humans’ control of fire. In the lower layers of a cave in South Africa, big cats were in charge: There were no carbon deposits from fire and gnawed human bones were scattered around the cave. In the upper layers of the same cave, humans were in clearly charge. There were carbon deposits from fires, and bones of big cats that had been gnawed by humans were scattered around the cave.

We are dealing with COVID-19 now. Today’s hospitals are only possible thanks to a modern mix of energy supply. Drugs are very often made using oil. Personal protective equipment is made in factories around the world and shipped to where it is used, generally using oil for transport.

Conclusion

We do indeed appear to be headed for a Great Reset. There is little chance that Green Energy can play more than a small role, however. Leaders are often confused because of the erroneous modeling that has been done. Given that the world’s oil and coal supply seem to be declining in the near term, the chance that fossil fuel production will ever rise as high as assumptions made in the IPCC reports seems very slim.

It is true that some Green Energy devices may continue to operate for a time. But, as the world economy continues to head downhill, it will be increasingly difficult to make new renewable devices and to repair existing systems. Wholesale electricity prices can be expected to stay very low, leading to the need for continued subsidies for wind and solar.

Figure 1 indicates that we can expect more revolutions and wars at this stage in the cycle. At least part of this unrest will be related to low commodity prices and low wages. Globalization will tend to disappear. Keeping transmission lines repaired will become an increasing problem, as will many other tasks associated with keeping energy supplies available.

Read More

Continue Reading

International

Analyzing Capital Market Trends

As the industrial market sees some cooling from pandemic-era highs and financing tightens, what should owners and investors expect over the next 12-18…

Published

on

As the industrial market sees some cooling from pandemic-era highs and financing tightens, what should owners and investors expect over the next 12-18 months? Four national experts took the stage at I.CON West to discuss what lies ahead for this popular asset class.  

Capital Raising is Down, Cash is King 

Overall, institutional capital raising was down 30-40% in 2023. Institutional investors have been wary of open-ended funds, portfolios have been trimmed and deals are happening increasingly in cash. Considering the current lending environment, more investors prefer unlevered deals.  

“I’m always surprised how many groups out there are willing to buy all cash,” said Christy Gahr, director of capital markets, North America, Realterm. “It’s taken off over the last year, especially when the cost of debt is 6%.” 

The private equity market is active, and panelists said they see more investment coming from end users. On the debt side, banks are shying away from speculative development projects and focused on smaller transactions last year. Some investors are taking more of a “rifle shot” approach by focusing on targeted, specific projects rather than casting a wide net. There is also interest from life companies that have some liquidity to invest in stabilized industrial product in first-tier markets. 

Not Much Distress, But More Scrutiny 

PJ Charlton, chief investment officer, CenterPoint Properties, commented he wasn’t seeing much distress and certainly not at 2009 levels. However, there are motivated sellers. It is a suitable time to sell assets out of a fund due to the high leasing rates and spectacular rent growth. “Most sellers today have a reason,” said Tim Walsh, chief investment officer, Dermody, “whether it’s a balance sheet-motivated, whether it’s related to some sort of tax structuring or promises they’ve made to investors.” 

What has changed over the past 2-3 years is the approach of investment committees. “Back then it was about aggregation,” said Charlton. “It was all in on industrial… rents were growing 15% a year, cap rates are down another 50 basis points. Interest rates are 3%…  Investment committees are reading every page and scrutinizing every word now. It’s a much more discerning buyer than it was three years ago,” he said. Investment committees are focusing on projects in healthy rent growth markets such as New Jersey, Los Angeles and Miami with $50-$150 million deal ranges.  

“There is a thesis that there’s a slowdown in developments in all our markets,” said Walsh. “Everyone sees it. There are some submarkets where there weren’t any groundbreakings in the first quarter.” However, there will be an overall return to a balanced supply and demand dynamic. 

Embracing ESG 

Investors and tenants are increasingly recognizing the importance of ESG, and the panel agreed bigger credit and quality tenants tend to be more environmentally focused. Dermody has increased its environmental standards, making sure each of their building roofs can structurally support solar panels and installing piping and wiring the parking lots for electric charging. “There is a lot of noise out there when it comes to NIMBYism,” said Walsh, “And I think we need to do more to promote the modern environmentally sensitive product that we’re all building.” 

Additionally, power supply is becoming more of a concern. “Several years ago, everyone was talking about having the right amount of parking. Now the hot topic is having access to power supply,” said Charlton. Several Fortune 500 companies, including FedEx, have promised to reduce their carbon footprint quickly and that means access to electrified parking. “What we’re seeing is that parking is even more important because now you have fleets that need to be able to charge two or three times a day in last-mile distribution facilities,” said Gahr. “It will change aspects of how we invest and how we underwrite and think about what our properties need to be able to provide our users.”  

Nearshoring and Onshoring  

Jack Fraker, president and global head of industrial and logistics capital markets for Newmark, turned the discussion to what is happening near the U.S.-Mexico border and asked the panelists what they are seeing in terms of nearshoring. Gahr commented that so much has changed in a short period and cited several statistics. For example, since 2019, China alone has invested in more than 120 projects in Mexico and in over 18 million square feet of industrial space. U.S.-Mexico trade is now outpacing U.S.-China trade by more than 40%.  

“During the first half of 2023, $461 billion of goods passed through the U.S.-Mexico border, which is 44% higher than the value of goods between U.S. and China,” said Gahr. More than 150 foreign companies said in 2023 that they will open a new operation or expand into Mexico. These sectors include automotive, energy, manufacturing and IT.  

Texas cities Laredo and El Paso were identified as active border markets, and the panelists agreed the best-performing assets are going to be as close to the border as possible. In 2023, El Paso had over three million square feet in total net absorption with a market wide vacancy of less than 4%, according to CBRE. The panelists also discussed the tremendous amount of opportunity in Mexico, although many U.S. development companies have not yet chosen to invest there. Onshoring activity, such as a Samsung project in Austin, is also on the rise. 

Overall, the panel remained optimistic about investments, the economy and interest rates. Unemployment is below 4% and the economy is still growing. Additionally, the level of capital that’s sitting in money markets right now is “at $6 trillion – and that’s $2 trillion higher than it was five years ago,” according to Walsh. “So, the giant pile of money persists. And it’s available as soon as people are comfortable coming off the sidelines.” 


This post is brought to you by JLL, the social media and conference blog sponsor of NAIOP’s I.CON West 2024. Learn more about JLL at www.us.jll.com or www.jll.ca.

Read More

Continue Reading

International

Centre for Doctoral Training in Diversity in Data Visualization awarded over £9m funding from the EPSRC

Announced today, a new Centre for Doctoral Training (CDT) has been funded by a grant of over £9 million from the Engineering and Physical Sciences Research…

Published

on

Announced today, a new Centre for Doctoral Training (CDT) has been funded by a grant of over £9 million from the Engineering and Physical Sciences Research Council (EPSRC) to help train the next, diverse generation of research leaders in data visualization.

A collaboration between City, University of London and the University of Warwick, the EPSRC Centre for Doctoral Training in Diversity in Data Visualization (DIVERSE CDT) will train 60 PhD students, in cohorts of 12 students, beginning in October 2025. The set-up phase will begin in July 2024.

The funding announcement is part of a wider UK Research & Innovation (UKRI) announcement of the UK’s biggest-ever investment in engineering and physical sciences postgraduate skills, totalling more than £1 billion.

DIVERSE CDT will be supported by 19 partner organisations, including the Natural History Museum, the Ordnance Survey, and the Centre for Applied Education Research.

Data Visualization is the practice of designing, developing and evaluating representations of complex data – the kinds of data that lie at the heart of every organization – to enable more people to make real-world use of a source of information which is otherwise challenging to access.

Data visualization can be used to synthesise complex data into a clear story upon which actions can be based. From illustrating how the Covid-19 pandemic made countries poorer, to showing how the processing-power of cryptocurrencies may have driven up the price of high-street graphics cards; data visualization is crucial to society obtaining meaning from data.

However, no current CDT focuses upon training its students in data visualization. This is despite government’s Department of Digital, Media, Culture and Sport listing data visualization as one of the top five skills needed by businesses – with 23% of businesses saying that their sector has insufficient capacity. Likewise, Wiley’s Digital Skills Gap Index, 2021, listed data visualization as the third most needed business and organisational skill for employees to succeed in the workplace in the next five years.

Key innovations of DIVERSE CDT will include students:

Credit: Alex Kachkaev and Jo Wood, City, University of London

Announced today, a new Centre for Doctoral Training (CDT) has been funded by a grant of over £9 million from the Engineering and Physical Sciences Research Council (EPSRC) to help train the next, diverse generation of research leaders in data visualization.

A collaboration between City, University of London and the University of Warwick, the EPSRC Centre for Doctoral Training in Diversity in Data Visualization (DIVERSE CDT) will train 60 PhD students, in cohorts of 12 students, beginning in October 2025. The set-up phase will begin in July 2024.

The funding announcement is part of a wider UK Research & Innovation (UKRI) announcement of the UK’s biggest-ever investment in engineering and physical sciences postgraduate skills, totalling more than £1 billion.

DIVERSE CDT will be supported by 19 partner organisations, including the Natural History Museum, the Ordnance Survey, and the Centre for Applied Education Research.

Data Visualization is the practice of designing, developing and evaluating representations of complex data – the kinds of data that lie at the heart of every organization – to enable more people to make real-world use of a source of information which is otherwise challenging to access.

Data visualization can be used to synthesise complex data into a clear story upon which actions can be based. From illustrating how the Covid-19 pandemic made countries poorer, to showing how the processing-power of cryptocurrencies may have driven up the price of high-street graphics cards; data visualization is crucial to society obtaining meaning from data.

However, no current CDT focuses upon training its students in data visualization. This is despite government’s Department of Digital, Media, Culture and Sport listing data visualization as one of the top five skills needed by businesses – with 23% of businesses saying that their sector has insufficient capacity. Likewise, Wiley’s Digital Skills Gap Index, 2021, listed data visualization as the third most needed business and organisational skill for employees to succeed in the workplace in the next five years.

Key innovations of DIVERSE CDT will include students:

  • undertaking and relating a series of applied studies with world-leading industrial and academic partners through a structured internship programme and an exchange programme with 18 leading international labs
     
  • using an interactive digital notebook for recording, reflection and reporting which becomes a “thesis” for examination, in lieu of the traditional doctoral thesis, and in line with current best practice in data visualization methodology
     
  • being provided with tools that mitigate against the dreaded isolation that PhD students fear, including opportunities for cohort reflection and supportive inclusion via enriching and inclusive processes for admissions, support, and a research environment that addresses barriers for students from under-represented backgrounds; specifically students who identify as female, students from ethnic minority backgrounds and students from lower socio-economic groups.

DIVERSE CDT will be led by Professor Stephanie Wilson, Co-Director of the Centre for HCI Design (HCID) and Professor Jason Dykes, Professor of Visualization and Co-Director of the giCentre, both of the School of Science & Technology at City, University of London.

Members of DIVERSE CDT’s interdisciplinary team include:

  • Professor Cagatay Turkay and Dr Gregory McInerny from the Centre for Interdisciplinary Methodologies, University of Warwick
  • Dr Sara Jones, Reader in Creative Interactive System Design, Bayes Business School at City
  • Professor Rachel Cohen, Professor in Sociology, Work and Employment, School of Policy & Global Affairs at City
  • Professor Jo Wood, Professor of Visual Analytics, and Dr Marjahan Begum, Lecturer in Computer Science, School of Science & Technology at City
  • Ian Gibbs, Head of Academic Enterprise at City.
     

Reflecting on DIVERSE CDT, Co-Principal Investigator, Professor Stephanie Wilson said:

“This funding represents a significant investment from the EPSRC and partner organisations in our vision of an innovative approach to doctoral training. We are delighted to have the opportunity to train a new and diverse generation of PhD students to become future leaders in data visualization.”

Professor Cagatay Turkay said:

“I am thrilled to see this investment for this exciting initiative that brings City and Warwick together to train the next generation of data visualization leaders. Together with our stellar partner organisations, DIVERSE CDT will deliver a transformative training programme that will underpin pioneering interdisciplinary data visualization research that not only innovates in methods and techniques but also delivers meaningful change in the world.”

Dr Sara Jones said:

“I’m really excited to be part of this great new initiative, sharing some of the innovative approaches we’ve developed through the interdisciplinary Centre for Creativity in Professional Practice and Masters in Innovation, Creativity and Leadership, and applying them in this important field.”

Professor Rachel Cohen said:

“DIVERSE CDT puts City at the heart of interdisciplinary data visualization. Data are increasingly part of the social science and policy agenda and it is imperative that those charged with visualizing data understand both the technical and social implications of visualization”

“The CDT is committed to developing and widening the group of people who have the cutting-edge skills needed to visualize, interpret and represent key aspects of our everyday lives. As such it marks a huge step forward both in terms of skill development and representation.”

Professor Leanne Aitken, Vice-President (Research), City, University of London, said:

“Growing the number of doctoral students we prepare in the interdisciplinary field of data visualization is core to our research strategy at City. Doctoral students represent the future of research and expand the capacity and impact of our research. The strength of the DIVERSE CDT is that it draws together our commitment to providing a supportive environment for students from all backgrounds to undertake applied research that challenges current practices in partnership with a range of commercial, public and third sector organisations. This represents an exciting expansion in our doctoral training provision.”

Professor Charlotte Deane, Executive Chair of the EPSRC, part of UKRI, said:

“The Centres for Doctoral Training announced today will help to prepare the next generation of researchers, specialists and industry experts across a wide range of sectors and industries.

“Spanning locations across the UK and a wide range of disciplines, the new centres are a vivid illustration of the UK’s depth of expertise and potential, which will help us to tackle large-scale, complex challenges and benefit society and the economy.

“The high calibre of both the new centres and applicants is a testament to the abundance of research excellence across the UK, and EPSRC’s role as part of UKRI is to invest in this excellence to advance knowledge and deliver a sustainable, resilient and prosperous nation.”

Science and Technology Secretary, Michelle Donelan, said:

“As innovators across the world break new ground faster than ever, it is vital that government, business and academia invests in ambitious UK talent, giving them the tools to pioneer new discoveries that benefit all our lives while creating new jobs and growing the economy.

“By targeting critical technologies including artificial intelligence and future telecoms, we are supporting world class universities across the UK to build the skills base we need to unleash the potential of future tech and maintain our country’s reputation as a hub of cutting-edge research and development.”

ENDS

Notes to editors

Contact details:

To speak to City, University of London collaborators, contact Dr Shamim Quadir, Senior Communications Officer, School of Science & Technology, City, University of London. Tel: +44(0) 207 040 8782 Email: shamim.quadir@city.ac.uk. 

To speak to University of Warwick collaborators contact Annie Slinn, Communications Officer, University of Warwick. Tel: +44 (0)7392 125 605 Email: annie.slinn@warwick.ac.uk

Further information

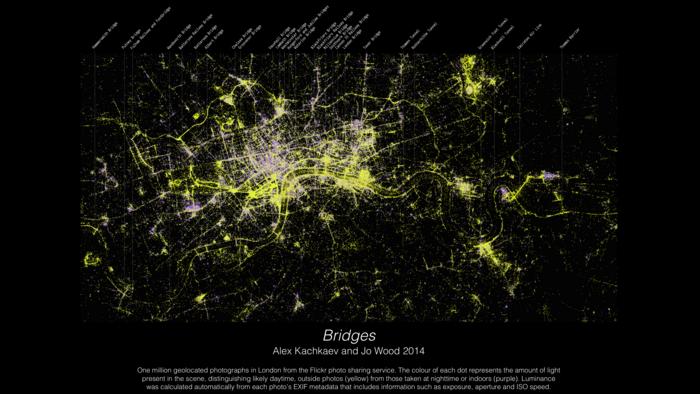
Example data visualization (image)

Bridges – Alex Kachaev and Jo Wood.

Link to image: bit.ly/3Iy3BRz Credit: Alex Kachkaev and Jo Wood, City, University of London

Data visualization for the Museum of London by Alex Kachkaev (a PhD student) with supervisor Joseph Wood, illustrating where people in London congregate in both inside and outside spaces, showing how a creative use of data can be used to build a picture of human behaviour.

Collaborating labs

Collaborators on the international exchange programme comprise the world’s leading visualization research labs, including the Visualization Group at Massachusetts Institute of Technology (MIT), USA,  the Embodied Visualisation Group, Monash University, Australia;  Georgia Tech, USA;  AVIZ, France; the DataXExperience Lab, University of Calgary, Canada,  and the ixLab, Simon Fraser University, Canada.

About the funder

The Engineering and Physical Sciences Research Council (EPSRC) is the main funding body for engineering and physical sciences research in the UK. Our portfolio covers a vast range of fields from digital technologies to clean energy, manufacturing to mathematics, advanced materials to chemistry. 

EPSRC invests in world-leading research and skills, advancing knowledge and delivering a sustainable, resilient and prosperous UK. We support new ideas and transformative technologies which are the foundations of innovation, improving our economy, environment and society. Working in partnership and co-investing with industry, we deliver against national and global priorities.

About City, University of London

City, University of London is the University of business, practice and the professions.  

City attracts around 20,000 students (over 40 per cent at postgraduate level) from more than 150 countries and staff from over 75 countries. In recent years City has made significant investments in its academic staff, its infrastructure, and its estate. 

City’s academic range is broadly-based with world-leading strengths in business; law; health sciences; mathematics; computer science; engineering; social sciences; and the arts including journalism, dance and music. 

Our research is impactful, engaged and at the frontier of practice. In the last REF (2021) 86 per cent of City research was rated as world leading 4* (40%) and internationally excellent 3* (46%).  

We are committed to our students and to supporting them to get good jobs. City was one of the biggest improvers in the top half of the table in the Complete University Guide (CUG) 2023 and is 15th in UK for ‘graduate prospects on track’. 

Over 150,000 former students in 170 countries are members of the City Alumni Network.  

Under the leadership of our new President, Professor Sir Anthony Finkelstein, we have developed an ambitious new strategy that will direct the next phase of our development.  


Read More

Continue Reading

International

Economic Trends, Risks and the Industrial Market

By a show of hands, I.CON West keynote speaker Christine Cooper, Ph.D., managing director and chief U.S. economist with CoStar Group, polled attendees…

Published

on

By a show of hands, I.CON West keynote speaker Christine Cooper, Ph.D., managing director and chief U.S. economist with CoStar Group, polled attendees on their economic outlook – was it bright or bleak? The group responded largely positively, with most indicating they felt the economy was doing better than not.  

Four years ago, the World Health Organization declared COVID-19 a global pandemic, seemingly halting life as we knew it. And although those early days of the pandemic seem like a long time ago, we’re still in recovery from two of its major consequences: 1) the $4 trillion in economic stimulus that the U.S. government showered on consumers; and 2) the aggressive monetary policies that have created ripple effects on the industrial markets. 

Cooper began with an overview of the economic environment, which she called “the good news.” The nation’s GDP is strong, and the economy gained momentum in the second half of 2023 – we saw economic growth of 4.9% and 3.2% in Q3 and Q4 respectively — much higher than expected. “The reason is consumers,” Cooper said. “When things get tough, we go shopping. This generates sales and economic activity. But how long can it last?” 

Consumer sentiment continues to be healthy, and employment is good, although a shortage of workers could impact that moving forward. The U.S. added 275,000 jobs in January, far exceeding expectations. “The Fed raising interest rates hasn’t done what it normally does – slow job growth and the economy,” said Cooper. In addition, the $4 trillion given to keep households afloat during the pandemic has simply padded checking accounts, she said, as consumers couldn’t immediately spend the money because everyone was staying home, and the supply chain was clogged. The money was banked, and there’s still a lot of it to be spent. 

Cooper addressed economic risks and the weak points that industrial real estate professionals should be mindful of right now, including mortgage rates that remain at 20-year highs, stalling the housing market, particularly for new home buyers. Mid-pandemic years of 2020-2021 had strong home sales, driven by people moving out of the city or roommates dividing into two properties for more space and protection against the virus. Homeowners who refinanced in the early stages of the pandemic were fortunate and aren’t willing to list their houses for sale quite yet. 

“The housing market is a big driver of industrial demand – think furniture, appliances and all the durable goods that go into a home. This equates to warehouse space demand,” said Cooper. 

Interest rates on consumer credit are spiking and leading economic indexes are still signaling a recession ahead. Financial markets are indicating the same, with a current probability of 61.5% that we will be in a recession by 2025. However, Cooper said, while all signs point to a recession, economists everywhere say the same thing as the economy seemingly continues to surprise us: “This time is different.” 

Consumers are still holding the economy up with solid job and wage gains, yet higher borrowing costs are weighing on business activity and the housing market. Inflation has eased meaningfully but remains a bit too high for comfort. We’ve so far avoided the recession that everyone predicted, and the Federal Reserve appears ready to cut rates this year.  

For the industrial markets, the good news is that retailer corporate profits are beginning to bounce back after slowing in 2021 and 2022, with retail sales accelerating.  

A slowdown in industrial space absorption was reflected in all the key markets – Atlanta, Chicago, Columbus, Dallas-Fort Worth, Houston, the Inland Empire, Los Angeles, New Jersey and Phoenix – but was worst in the southern California markets, which have since been rebounding.  

“Supply responded to strong demand,” Cooper said. “In 2021, 307 million square feet were delivered, followed by 395 million in 2022. In 2023, we saw 534 million square feet delivered – that’s almost 33% higher than the year before.” 

The top 20 markets for 2023 deliveries measured by square feet are the expected hot spots: Dallas-Fort Worth (71 million square feet) leads the pack by almost double its follower of Chicago (37 million), then Houston (35 million), Phoenix (30 million) and Atlanta (29 million). Measured by share of inventory, emerging markets like Spartanburg, Pennsylvania, topped the list at 15 million square feet, followed by Austin (10 million), Phoenix and Dallas-Fort Worth (7 million), and Columbus (6 million). 

“Developers are more focused on big box distribution projects, and 90% of what’s being delivered is 100,000 square feet or more,” Cooper said. Around 400 million square feet of space currently under construction is unleased, in addition to the around 400,000 square feet that remained unleased in 2023. “Putting supply and demand together, industrial vacancy rate is rising and could peak at 6-7% in 2024,” she said. 

In conclusion, Cooper said that industrial real estate is rebalancing from its boom-and-bust years. Pandemic-related demands and accelerated e-commerce growth created a surge in 2021 and 2022, and the strong supply response that began in 2022 will continue to unfold through 2024. With rising interest rates putting a damper on demand in 2023, vacancies began to move higher and will continue to rise this year.  

“Consumers are spending and will continue to do so, and interest rates are likely to fall this year,” said Cooper. “We can hope for a recovery from the full effects of the pandemic in 2025.” 


This post is brought to you by JLL, the social media and conference blog sponsor of NAIOP’s I.CON West 2024. Learn more about JLL at www.us.jll.com or www.jll.ca.

Read More

Continue Reading

Trending