Uncategorized
The majority of housing markets across the country balancing out with 60 per cent anticipated to be balanced markets next year
The majority of housing markets across the country balancing out with 60 per cent anticipated to be balanced markets next year
Canada NewsWire
Toronto, ON and Kelowna, BC, Nov. 29, 2022
RE/MAX Canada expects average residential prices to decrease b…
Share this:


The majority of housing markets across the country balancing out with 60 per cent anticipated to be balanced markets next year
Canada NewsWire
Toronto, ON and Kelowna, BC, Nov. 29, 2022
RE/MAX Canada expects average residential prices to decrease by 3.3 per cent in 2023
- The biggest price declines across the country are expected in Ontario and Western Canada, where some markets may see average residential sale prices decrease by 10 to 15 per cent
- Price growth outlooks are anticipated in Atlantic Canada markets, with average residential sale prices expected to increase by eight per cent in Halifax and four per cent in St. John's in 2023
- 60 per cent of regions in Canada are expected to be balanced markets in 2023, according to RE/MAX brokers and agents
- 73 per cent of Canadians still say that home ownership is the best long-term investment they can make
Toronto, ON and Kelowna, BC, Nov. 29, 2022 /CNW/ -- Amid rising interest rates, and a looming recession, RE/MAX Canada is anticipating a modest decline of 3.3 per cent in average residential sales prices across the country in 2023. The estimates are based on surveys of RE/MAX brokers and agents from coast to coast, as reflected in RE/MAX's 2023 Canadian Housing Market Outlook Report.
To view the full interactive report, please copy and paste this link into your browser:
https://rem.ax/CanadianOutlook
In sharp contrast to 2022, most regions analyzed in the report will experience more balanced conditions in 2023 – a trend that's already starting to materialize in many regions as a result of current economic conditions.
Download the 2023 Canadian Housing Market Outlook Report Data Table
According to a Leger survey commissioned by RE/MAX as part of the report, Canadians view home ownership as the best long-term investment they can make (73 per cent). Yet, the majority (67 per cent), are feeling less optimistic in the short-term with 67 per cent less inclined to buy in the first half of 2023, and 62 per cent less inclined to sell in that time frame.
"It's good to see the majority of markets moving toward more balanced conditions, which is typically defined by 45 to 90 days on market. This is a much-needed adjustment from the unsustainable price increases and demand we saw early in 2022," says Christopher Alexander, President, RE/MAX Canada. "Many Canadians have understandably expressed hesitancy about engaging in the real estate market early in 2023, in the wake of rising interest rates and broader economic uncertainties. However, despite this, a greater number of Canadians consider real estate to be a solid long-term investment compared to this time last year. As we head into the new year, it's important that governments work collaboratively to support housing affordability and address the supply challenges that Canadians continue to face, in order to make home ownership feasible for those who want it."
"We're confident that as economic conditions improve and the market continues to even out into Q3/Q4 2023, a more-regular pace of activity will resume. It's especially critical during challenging economic times, that staying informed and working with an experienced real estate professional can help Canadians clarify some of the unknowns, help them find a home within their means, and ultimately make the best decision possible," says Elton Ash, Executive Vice President, RE/MAX Canada.
A regional overview: 2023 Canadian housing market insights
RE/MAX brokers and agents in Canada were asked to provide an analysis of their local market in 2022 and share their estimated outlook for 2023. Based on their insights, 60 per cent of housing markets in Canada are expected to be balanced markets in 2023, impacted by modest price declines and less activity.
With the exception of Halifax, NS, Ottawa, ON and the region of Montreal, QC, balanced market conditions are expected in Canada's major city centres, including the Greater Toronto Area (GTA), ON, Greater Vancouver Area (GVA), BC, Calgary, AB, Regina, SK and Winnipeg, MB, in what is being called a healthy development. Move-up and move-over buyers are driving activity in these regions with the exception of Ottawa, ON and Calgary, AB, where first-time buyers are expected to lead. Following a two-year frenzy fuelled by the pandemic, average residential sale prices are anticipated to decrease in Canada's priciest markets – the GVA and GTA.
Greater Toronto Area (GTA), Ontario
The Greater Toronto Area (GTA) is currently a balanced market – a condition that is anticipated to continue into 2023. Move-up and move-over buyers have been driving demand in the region in 2022, in a trend that is expected to carry on in the next year. Meanwhile, single-detached homes remain the dominant housing type, followed by condo apartments. The luxury market in Toronto has slowed down and will likely continue to cool in 2023 due to economic pressures. Meanwhile, new construction projects are being delayed as a result of the widening gap between market prices and construction costs, including the impact that higher interest rates have had on financing these projects.
The average residential sale price in the GTA may decrease by up to 11.8 per cent in 2023, with three main trends that will continue into next year, according to Cameron Forbes, RE/MAX Realtron Realty broker: "Continued interest rate increases and associated price adjustments, rising unemployment due to an economic slowdown, and new opportunities to engage in the market for buyers and sellers because of improved affordability. For buyers, this includes having fewer competitors, reduced prices and an increase in choices in the market. Meanwhile, sellers will have a trade-up advantage, reduced competition of listings, a stronger ability to re-locate to the suburbs, and have all of the advantages that buyers do, too."
"It's important to also consider some key context for the GTA," adds Alexander. "As Canada's largest urban centre, this region in particular has been feeling the effects of feverish demand and a shortage of housing, which resulted in unsustainable price growth and spiraling unaffordability. While recent price adjustments may be hard to swallow for some, what we have here is a return to much more 'normal' market conditions and a moderation that gives consumers the breathing room they need to make a wise decision and investment."
Greater Vancouver Area (GVA), British Columbia
Balanced market conditions in the GVA are anticipated to continue into at least the second quarter of 2023. Move-up and move-over buyers have led consumer demand in the region, with first-time buyers following close behind – a trend that's likely to persist into the beginning of next year.
"A big priority for homebuyers will be weighing value against opportunity in the market, with upsizing being top of mind. On the flip-side first-time homebuyers will be able to take advantage of a cooling market and make offers with conditions," said Tim Hill, RE/MAX All Points Realty agent. "Interestingly, it will be first-time home buyers that will facilitate move-up and move-over buyers to sell their first properties and upsize. I believe this will be a major factor and growing trend in the GVA real estate in 2023."
Single-detached homes remain the dominant housing type in the area, with the "upsizing" trend expected to become increasingly popular among families in 2023. Desirable neighbourhoods in the city are currently based on location, with access to rapid transit playing a large part in purchasing decisions. A continued drop in condo pricing is expected into 2023, while the luxury market is anticipated to have a slow start to the year before balancing out in the latter half of 2023. The average residential sale price in the GVA is anticipated to decrease by five per cent in 2023.
Calgary, Alberta
Much like Vancouver, Calgary's marked is balanced, but is expected to shift into seller's territory in early 2023. First-time buyers are driving demand in the region, with move-up and move-over buyers trailing close behind – a trend that is expected to continue into 2023.
"First-time buyers dealing with higher interest rates have lowered their expectations and downsized their purchases, going from single-detached homes to duplexes or apartments," said Richard Fleming, from RE/MAX Real Estate Mountain View. "We're seeing first-time buyers that still want to get into real estate, they're just adjusting what that looks like."
The average residential sale price increased by 13 per cent from $585,025 in 2021 (January-December) to $658,277 in 2022 (January-October). Condos are currently the dominant housing type in the region, with single-detached homes expected to drive the majority of sales in 2023, as buyers seek additional living space. Inventory is anticipated to remain low in the first quarter of the year, before steadily increasing through the third quarter and finally sloping down again in the final quarter of 2023.
Home sales are steadily increasing and are expected to remain on the rise in 2023. The luxury market has decreased its pace but is likely to pick back up next year. The average residential sale price in Calgary is anticipated to increase by seven per cent in 2023.
Edmonton, Alberta
Similar to the majority of regions across the country, Edmonton is currently experiencing a balanced market, with demand expected to increase in the spring. Move-up and move-over buyers are driving demand in the region and are expected to continue doing so into 2023. The average residential sale price increased by three per cent from $387,614 in 2021 (January-December) to $401,025 in 2022 (January-October). Single-detached homes remain the dominant housing type.
"We're seeing three main trends this year," said John Carter of RE/MAX River City. "Migration from other provinces, increased demand for luxury residential real estate, and balanced market conditions." New construction developments continue to be pressured by ongoing supply chain challenges and inflationary cost issues. Additionally, limitations on skilled labour are contributing to hurdles experienced by many builders.
Edmonton is expected to weather the recession well, as average incomes in the region are some of the highest in the country, according to Carter. Despite rising interest rates, the majority of buyers have not capped their mortgage capacity. Demand for downtown condos is expected to continue rising in 2023, with demand in the luxury segment becoming more robust in the year ahead. The average residential sale price in Edmonton is anticipated to increase by three per cent in 2023.
Regina, Saskatchewan
Regina is considered a balanced market and is anticipated to remain one in 2023. Move-up and move-over buyers have driven demand in the region and are expected to continue doing so into 2023. The average residential sale price in the region decreased by one per cent from $324,650 in 2021 (January-December) to $320,970 in 2022 (January-October). Single-detached homes remain the dominant housing type in the region.
"The market will remain balanced and steady through 2023 and we do not anticipate a major change in the average residential sale price or number of sales in 2023 as a result," said Jeremy Cosette of RE/MAX Crown Real Estate. "We'll see a lot of similarity to 2022 across the board and although housing supply will likely fluctuate throughout the year, overall, it'll level out and remain unchanged in 2023."
Rising interest rates will likely be a dominant theme in 2023, resulting in a slower market for both buyers and sellers. The average residential sale price in Regina is anticipated to remain the same in 2023.
Winnipeg, Manitoba
Winnipeg is currently sitting in a balanced market, but is expected to shift to a buyer's market early in the year before returning to balance in late 2023. Move-up and move-over buyers continue to drive demand in the region, with single-detached homes remaining the dominant housing type in the region – trends that are both expected to intensify in 2023. The average residential sale price increased by 10 per cent from $386,491 in 2021 (January-December) to $423,680 in 2022 (January-October).
"In 2023 we will continue to see an interest in multifamily sales as well commercial, land assembly and land banking," said RE/MAX Executives Realty broker Akash Bedi. "On the residential side, I think we will see a bit of a slowdown with residential rental unit sales."
Rising interest rates are expected to continue placing pressure on affordability and pre-approval amounts in Winnipeg next year. Unlike the majority of regions, Winnipeg is experiencing an increase in joint family and multi-generational family ownership – which can be attributed to ongoing affordability challenges. The condo market is in line with the changes experienced in the overall market. The average residential sale price in Winnipeg is expected to decrease by 8.5 per cent in 2023.
Ottawa, Ontario
Ottawa is currently defined as a seller's market and it is anticipated to remain one into the third quarter of 2023, where subsequently it is anticipated to become balanced. First-time homebuyers are driving demand in the region due to its relative affordability a trend that is expected to carry on next year. The average residential sale price increased by nine per cent from $601,039 in 2021 (January-December) to $656,761 in 2022 (January-October). Townhomes are currently the most in-demand housing-type due to the accessible entry-point they provide buyers.
"We're seeing three main housing trends heading into 2023," said Laura Keller of RE/MAX Affiliates Realty Ltd. "More multigenerational living, less upward movement as housing prices change and many first-time buyers who will look to engage and enter the market." First-time buyers in Ottawa are particular about the finishes, style and location of their homes, with many not wanting to spend money on small renovations. As single-family dwellings have become unaffordable to rent, multi-residential properties and tiny or coach home conversions are expected to increase. Rising interest rates are anticipated to continue cooling the market in the next year. Supply remains an issue in Ottawa, with many new construction developments being halted due to increased development fees and material and labour shortages. The average residential sale price in Ottawa is anticipated to increase by four per cent in 2023.
Montreal Region, Quebec
The Montreal Region is currently a seller's market, but certain types of properties and areas will be going towards a balanced market. These conditions are anticipated to continue into 2023. Currently, move-up and move-over buyers are driving demand in the region – a trend expected to carry over next year. The average residential sale price increased by 13 per cent year-over-year in Montreal (from $490,000 in 2021 (January-December) to $556,000 in 2022 (January-October).
Single-detached homes are the most in-demand housing type in the Montreal Region. "We'll see three main trends this year," said Patricia Hamelin of RE/MAX du Cartier. "Slower movement in the market, an increase in the amount of move-up buyers and the market continuing to balance out in 2023."
Now in the post-pandemic, housing demand is beginning to balance back to pre-pandemic levels. Rising interest rates are anticipated to continue impacting the housing market in 2023 – specifically by reducing its pace. Supply chain, labour shortages and rising costs of materials and labour have caused new construction developments to become delayed. The luxury market is expected to continue to cool in 2023, thus creating more advantageous opportunities for potential buyers.
Halifax, NS
Halifax is currently a seller's market and it is anticipated to remain one in 2023. Move-up and move-over buyers are driving demand in the region and are expected to continue to do so next year. The city saw an 19 per cent increase in year-over-year residential sale prices from $457,741 in 2021 (January-December) to $542,663 in 2022 (January-October). Single-detached homes remain the most in-demand housing type among buyers. Interest rates rising and inter-provincial migration reducing post-pandemic, contributed to the number of sales in the region decreasing by 25 per cent year-over-year, from 6,588 in 2021 (January-December) to 4,912 in 2022 (January-October).
"Halifax is expected to see strong investor activity in 2023 as prices and returns are still attractive, especially compared to other major cities across the country. Amidst inflation, a looming recession and continued adjustments to interest rates, the year is expected to start slow, but pick up its pace in the second half of 2023," says Ryan Hartlen, broker of RE/MAX Nova.
Supply is anticipated to remain tight in 2023 for Halifax, as buyer demand remains high and the city prepares to welcome a wave of new Canadians. Renting rooms and sharing expenses are ways first-time homebuyers are entering the market in Halifax. The luxury market has experienced additional activity and a recent rise in prices, but overall, this segment is expected to cool in 2023.
The average residential sale price in Halifax is anticipated to increase by eight per cent in 2023.
Additional findings from the 2023 RE/MAX Canada Housing Market Outlook Report brokers and agents:
- Western Canada
- In Nanaimo, BC, the Greater Vancouver Area, BC, Kelowna, BC and Winnipeg, MB average residential sale prices are expected to decline by five to 10 per cent in 2023.
- Victoria, BC, Calgary, AB, Edmonton, AB, and Saskatoon, SK are all expected to see average residential sale prices increase between two to seven per cent in 2023.
- The average residential sale price is not expected to fluctuate in Regina, SK in 2023.
- 44 per cent of regions in Western Canada are considered balanced markets, including Victoria, BC, GVA, BC, Edmonton, AB, Regina, SK and Winnipeg, MB.
- Nanaimo, BC and Kelowna, BC are both considered to be buyer's markets, while Saskatoon, SK, is categorized as a seller's market for single-detached properties and a buyer's market for condominiums; and Calgary, AB, across all property types.
- Ontario
- In London, Kitchener-Waterloo, Barrie, the GTA, Durham, and Lakelands West (Georgian Bay area) average residential sale prices are expected to decline by two to 15 per cent in 2023.
- Sudbury, Hamilton-Burlington, Oakville, Brampton, Ottawa, Mississauga, Muskoka, Niagara, Windsor, York Region, Haliburton, Peterborough and The Kawarthas, and Kingston are all expected to see average residential sale prices increase between two to eight per cent in 2023.
- 57 per cent of regions in Ontario Canada are considered balanced markets, including London, Kitchener-Waterloo, Oakville, Barrie, GTA, Mississauga, Windsor, Lakelands West and Kingston.
- Hamilton-Burlington, Brampton, and Niagara are all considered buyer's markets, while Sudbury, Muskoka, Durham York Region, Haliburton, Ottawa and Peterborough and the Kawarthas favour sellers.
- Quebec
- In Quebec City, average residential sale prices are expected to decline by 10 per cent respectively.
- The region of Montreal is balanced in some regions, while Quebec City is a balanced market.
- Atlantic Canada
- In Moncton, NB, Saint John, NB and Fredericton, NB, average residential sale prices are expected to decline between 3.5 and five per cent in 2023.
- Halifax, NS and St. John's, NL are both expected to see average residential sale price increases in 2023, rising eight and four per cent respectively, while sale prices are anticipated to remain unchanged in Charlottetown, PEI.
- With the exception of St. John's, NL (a balanced market), all regions in Atlantic Canada are considered to favour sellers.
Additional key insights from the Leger survey:
- Although rising interest rates have cooled/stabilized the real estate market, 45 per cent of Canadians are concerned that further increases will impact their ability to engage in the real estate market in 2023
- 54 per cent of Canadians believe that the two-year ban on foreign investors purchasing property which will come into effect on Jan. 1, will increase the availability of affordable housing for local homebuyers
- 15 per cent of Canadians are considering moving to another province in 2023 to find better housing affordability and liveability
- 54 per cent of Canadians feel confident that their financial situation will remain steady in 2023
About the 2023 Canadian Housing Market Outlook Report:
RE/MAX's 2023 Canadian Housing Market Outlook Report includes data and insights from RE/MAX brokerages. RE/MAX brokers and agents are surveyed on market activity and local developments. The overall outlook is based on the average of all regions surveyed, weighted by the number of transactions in each region.
About Leger
Leger is the largest Canadian-owned full-service market research firm. An online survey of 1,544 Canadians was completed between November 4-6, 2022, using Leger's online panel. Leger's online panel has approximately 400,000 members nationally and has a retention rate of 90 per cent. A probability sample of the same size would yield a margin of error of +/- 2.5 per cent, 19 times out of 20.
About the RE/MAX Network
As one of the leading global real estate franchisors, RE/MAX, LLC is a subsidiary of RE/MAX Holdings (NYSE: RMAX) with more than 140,000 agents in almost 9,000 offices with a presence in more than 110 countries and territories. RE/MAX Canada refers to RE/MAX of Western Canada (1998), LLC and RE/MAX Ontario-Atlantic Canada, Inc., and RE/MAX Promotions, Inc., each of which are affiliates of RE/MAX, LLC. Nobody in the world sells more real estate than RE/MAX, as measured by residential transaction sides.
RE/MAX was founded in 1973 by Dave and Gail Liniger, with an innovative, entrepreneurial culture affording its agents and franchisees the flexibility to operate their businesses with great independence. RE/MAX agents have lived, worked and served in their local communities for decades, raising millions of dollars every year for Children's Miracle Network Hospitals® and other charities. To learn more about RE/MAX, to search home listings or find an agent in your community, please visit remax.ca. For the latest news from RE/MAX Canada, please visit blog.remax.ca.
Forward looking statements
This report includes "forward-looking statements" within the meaning of the "safe harbour" provisions of the United States Private Securities Litigation Reform Act of 1995. Forward-looking statements may be identified by the use of words such as "believe," "intend," "expect," "estimate," "plan," "outlook," "project," and other similar words and expressions that predict or indicate future events or trends that are not statements of historical matters. These forward-looking statements include statements regarding housing market conditions and the Company's results of operations, performance and growth. Forward-looking statements should not be read as guarantees of future performance or results. Forward-looking statements are based on information available at the time those statements are made and/or management's good faith belief as of that time with respect to future events and are subject to risks and uncertainties that could cause actual performance or results to differ materially from those expressed in or suggested by the forward-looking statements. These risks and uncertainties include (1) the global COVID-19 pandemic, which has impacted the Company and continues to pose significant and widespread risks to the Company's business, the Company's ability to successfully close the anticipated reacquisition and to integrate the reacquired regions into its business, (3) changes in the real estate market or interest rates and availability of financing, (4) changes in business and economic activity in general, (5) the Company's ability to attract and retain quality franchisees, (6) the Company's franchisees' ability to recruit and retain real estate agents and mortgage loan originators, (7) changes in laws and regulations, (8) the Company's ability to enhance, market, and protect the RE/MAX and Motto Mortgage brands, (9) the Company's ability to implement its technology initiatives, and (10) fluctuations in foreign currency exchange rates, and those risks and uncertainties described in the sections entitled "Risk Factors" and "Management's Discussion and Analysis of Financial Condition and Results of Operations" in the most recent Annual Report on Form 10-K and Quarterly Reports on Form 10-Q filed with the Securities and Exchange Commission ("SEC") and similar disclosures in subsequent periodic and current reports filed with the SEC, which are available on the investor relations page of the Company's website at www.remax.com and on the SEC website at www.sec.gov. Readers are cautioned not to place undue reliance on forward-looking statements, which speak only as of the date on which they are made. Except as required by law, the Company does not intend, and undertakes no duty, to update this information to reflect future events or circumstances.
SOURCE RE/MAX Canada
Uncategorized
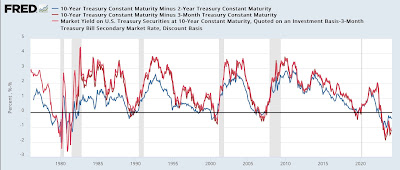
Manufacturing and construction vs. the still-inverted yield curve
– by New Deal democratProf. Menzie Chinn at Econbrowser makes the point that the yield curve is still inverted, and has not yet eclipsed the longest…
Share this:

- by New Deal democrat
Prof. Menzie Chinn at Econbrowser makes the point that the yield curve is still inverted, and has not yet eclipsed the longest previous time between onset of such an inversion and a recession. So he believes the threat of recession is still on the table.


Uncategorized
Half Of Downtown Pittsburgh Office Space Could Be Empty In 4 Years
Half Of Downtown Pittsburgh Office Space Could Be Empty In 4 Years
Authored by Mike Shedlock via MishTalk.com,
The CRE implosion is picking…
Share this:


Authored by Mike Shedlock via MishTalk.com,
The CRE implosion is picking up steam.
Check out the grim stats on Pittsburgh.
Unions are also a problem in Pittsburgh as they are in Illinois and California.
Downtown Pittsburgh Implosion
The Post Gazette reports nearly half of Downtown Pittsburgh office space could be empty in 4 years.
Confidential real estate information obtained by the Pittsburgh Post-Gazette estimates that 17 buildings are in “significant distress” and another nine are in “pending distress,” meaning they are either approaching foreclosure or at risk of foreclosure. Those properties represent 63% of the Downtown office stock and account for $30.5 million in real estate taxes, according to the data.
It also calculates the current office vacancy rate at 27% when subleases are factored in — one of the highest in the country.
And with an additional three million square feet of unoccupied leased space becoming available over the next five years, the vacancy rate could soar to 46% by 2028, based on the data.
Property assessments on 10 buildings, including U.S. Steel Tower, PPG Place, and the Tower at PNC Plaza, have been slashed by $364.4 million for the 2023 tax year, as high vacancies drive down their income.
Another factor has been the steep drop — to 63.5% from 87.5% — in the common level ratio, the number used to compute taxable value in county assessment appeal hearings.
The assessment cuts have the potential to cost the city, the county, and the Pittsburgh schools nearly $8.4 million in tax refunds for that year alone. Downtown represents nearly 25% of the city’s overall tax base.
In response Pittsburgh City Councilman Bobby Wilson wants to remove a $250,000 limit on the amount of tax relief available to a building owner or developer as long as a project creates at least 50 full-time equivalent jobs.
It’s unclear if the proposal will be enough. Annual interest costs to borrow $1 million have soared from $32,500 at the start of the pandemic in 2020 to $85,000 on March 1. Local construction costs have increased by about 30% since 2019.
But the city is doomed if it does nothing. Aaron Stauber, president of Rugby Realty said it will probably empty out Gulf Tower and mothball it once all existing leases expire.
“It’s cheaper to just shut the lights off,” he said. “At some point, we would move on to greener pastures.”
Where’s There’s Smoke There’s Unions
In addition to the commercial real estate woes, the city is also wrestling with union contracts.
Please consider Sounding the alarm: Pittsburgh Controller’s letter should kick off fiscal soul-searching
It’s only March, and Pittsburgh’s 2024 house-of-cards operating budget is already falling down. That’s the clear implication of a letter sent by new City Controller Rachael Heisler to Mayor Ed Gainey and members of City Council on Wednesday afternoon.
The letter is a rare and welcome expression of urgency in a city government that has fallen in complacency — and is close to falling into fiscal disaster.
The approaching crisis was thrown into sharp relief this week, when City Council approved amendments to the operating budget accounting for a pricey new contract with the firefighters union. The Post-Gazette Editorial Board had predicted that this contract — plus two others yet to be announced and approved — would demonstrate the dishonesty of Mayor Ed Gainey’s budget, and that’s exactly what’s happening: The new contract is adding $11 million to the administration’s artificially low 5-year spending projections, bringing expected 2028 reserves to just barely the legal limit.
But there’s still two big contracts to go, with the EMS union and the Pittsburgh Joint Collective Bargaining Committee, which covers Public Works workers. Worse, there are tens — possibly hundreds — of millions in unrealistic revenues still on the books. On this, Ms. Heisler’s letter only scratched the surface.
Similarly, as we have observed, the budget’s real estate tax revenue projections are radically inconsistent with reality. Due to high vacancies and a sharp reduction in the common level ratio, a significant drop in revenues was predictable — but not reflected in the budget. Ms. Heisler’s estimate of a 20% drop in revenues from Downtown property, or $5.3 million a year, may even be optimistic: Other estimates peg the loss at twice that, or more.
Left unmentioned in the letter are massive property tax refunds the city will owe, as well as fanciful projections of interest income that are inconsistent with the dwindling reserves, and drawing-down of federal COVID relief funds, predicted in the budget itself. That’s another unrealistic $80 million over five years.
Pittsburgh exited Act 47 state oversight after nearly 15 years on Feb. 12, 2018, with a clean bill of fiscal health.
It has already ruined that bill of health.
Act 47 in Pittsburgh
Flashback February 21, 2018: Act 47 in Pittsburgh: What Was Accomplished?
Pittsburgh’s tax structure was a much-complained-about topic leading up to the Act 47 declaration. The year following Pittsburgh’s designation as financially distressed under Act 47 it levied taxes on real estate, real estate transfers, parking, earned income, business gross receipts (business privilege and mercantile), occupational privilege and amusements. The General Assembly enacted tax reforms in 2004 giving the city authority to levy a payroll preparation tax in exchange for the immediate elimination of the mercantile tax and the phase out of the business privilege tax. The tax reforms increased the amount of the occupational privilege tax from $10 to $52 (this is today known as the local services tax and all municipalities outside of Philadelphia levy it and could raise it thanks to the change for Pittsburgh).
The coordinators recommended an increase in the deed transfer tax, which occurred in late 2004 (it was just increased again by City Council) and in the real estate tax, which increased in 2015.
Legacy costs, principally debt and underfunded pensions, were the primary focus of the 2009 amended recovery plan. The city’s pension funded ratio has increased significantly from where it stood a decade ago, rising from the mid-30 percent range to over 60 percent at last measurement.
The obvious question? Will the city stick to the steps taken to improve financially and avoid slipping back into distressed status? If Pittsburgh once stood “on the precipice of full-blown crisis,” as described in the first recovery plan, hopefully it won’t return to that position.
The Obvious Question
I could have answered the 2018 obvious question with the obvious answer. Hell no.
No matter how much you raise taxes, it will never be enough because public unions will suck every penny and want more.
On top of union graft, and insanely woke policies in California, we have an additional huge problem.
Hybrid Work Leaves Offices Empty and Building Owners Reeling
Hybrid work has put office building owners in a bind and could pose a risk to banks. Landlords are now confronting the fact that some of their office buildings have become obsolete, if not worthless.
Meanwhile, in Illinois …
Chicago Teachers’ Union Seeks $50 Billion Despite $700 Million City Deficit
Please note the Chicago Teachers’ Union Seeks $50 Billion Despite $700 Million City Deficit
The CTU wants to raise taxes across the board, especially targeting real estate.
My suggestion, get the hell out...
Uncategorized
Profits over patients: For-profit nursing home chains are draining resources from care while shifting huge sums to owners’ pockets
Owners of midsize nursing home chains harm the elderly and drain huge sums of money from facilities using opaque accounting practices while government…
Share this:


The care at Landmark of Louisville Rehabilitation and Nursing was abysmal when state inspectors filed their survey report of the Kentucky facility on July 3, 2021.
Residents wandered the halls in a facility that can house up to 250 people, yelling at each other and stealing blankets. One resident beat a roommate with a stick, causing bruising and skin tears. Another was found in bed with a broken finger and a bloody forehead gash. That person was allowed to roam and enter the beds of other residents. In another case, there was sexual touching in the dayroom between residents, according to the report.
Meals were served from filthy meal carts on plastic foam trays, and residents struggled to cut their food with dull plastic cutlery. Broken tiles lined showers, and a mysterious black gunk marred the floors. The director of housekeeping reported that the dining room was unsanitary. Overall, there was a critical lack of training, staff and supervision.
The inspectors tagged Landmark as deficient in 29 areas, including six that put residents in immediate jeopardy of serious harm and three where actual harm was found. The issues were so severe that the government slapped Landmark with a fine of over US$319,000 − more than 29 times the average for a nursing home in 2021 − and suspended payments to the home from federal Medicaid and Medicare funds.
But problems persisted. Five months later, inspectors levied six additional deficiencies of immediate jeopardy − the highest level.
Landmark is just one of the 58 facilities run by parent company Infinity Healthcare Management across five states. The government issued penalties to the company almost 4½ times the national average, according to bimonthly data that the Centers for Medicare & Medicaid Services first started to make available in late 2022. All told, Infinity paid nearly $10 million in fines since 2021, the highest among nursing home chains with fewer than 100 facilities.
Infinity Healthcare Management and its executives did not respond to multiple requests for comment.
Race to the bottom
Such sanctions are nothing new for Infinity or other for-profit nursing home chains that have dominated an industry long known for cutting corners in pursuit of profits for private owners. But this race to the bottom to extract profits is accelerating, despite demands by government officials, health care experts and advocacy groups to protect the nation’s most vulnerable citizens.
To uncover the reasons why, The Conversation delved into the nursing home industry, where for-profit facilities make up more than 72% of the nation’s nearly 14,900 facilities. The probe, which paired an academic expert with an investigative reporter, used the most recent government data on ownership, facility information and penalties, combined with CMS data on affiliated entities for nursing homes.
The investigation revealed an industry that places a premium on cost cutting and big profits, with low staffing and poor quality, often to the detriment of patient well-being. Operating under weak and poorly enforced regulations with financially insignificant penalties, the for-profit sector fosters an environment where corners are frequently cut, compromising the quality of care and endangering patient health.
Meanwhile, owners make the facilities look less profitable by siphoning money from the homes through byzantine networks of interconnected corporations. Federal regulators have neglected the problem as each year likely billions of dollars are funneled out of nursing homes through related parties and into owners’ pockets.
More trouble at midsize
Analyzing newly released government data, our investigation found that these problems are most pronounced in nursing homes like Infinity − midsize chains that operate between 11 and 100 facilities. This subsection of the industry has higher average fines per home, lower overall quality ratings, and are more likely to be tagged with resident abuse compared with both the larger and smaller networks. Indeed, while such chains account for about 39% of all facilities, they operate 11 of the 15 most-fined facilities.
With few impediments, private investors who own the midsize chains have swooped in to purchase underperforming homes, expanding their holdings even as larger chains divest and close facilities.
“They are really bad, but the names − we don’t know these names,” said Toby Edelman, senior policy attorney with the Center for Medicare Advocacy, a nonprofit law organization.
In response to The Conversation’s findings on nursing homes and request for an interview, a CMS spokesperson emailed a statement that said the CMS is “unwavering in its commitment to improve safety and quality of care for the more than 1.2 million residents receiving care in Medicare- and Medicaid-certified nursing homes.”
“We support transparency and accountability,” the American Health Care Association/National Center for Assisted Living, a trade organization representing the nursing home industry, wrote in response to The Conversation‘s request for comment. “But neither ownership nor line items on a budget sheet prove whether a nursing home is committed to its residents.”
Ripe for abuse
It often takes years to improve a poor nursing home − or run one into the ground. The analysis of midsize chains shows that most owners have been associated with their current facilities for less than eight years, making it difficult to separate operators who have taken long-term investments in resident care from those who are looking to quickly extract money and resources before closing them down or moving on. These chains control roughly 41% of nursing home beds in the U.S., according to CMS’s provider data, making the lack of transparency especially ripe for abuse.
A churn of nursing home purchases even during the pandemic shows that investors view the sector as highly profitable, especially when staffing costs are kept low and fines for poor care can easily be covered by the money extracted from residents, their families and taxpayers.
A March 2024 study from Lehigh University and the University of California, Los Angeles also shows that costs were inflated when nursing home owners switched to contractors they controlled directly or indirectly. Overall, spending on real estate increased 20.4% and spending on management increased 24.6% when the businesses were affiliated, the research showed.
“This is the model of their care: They come in, they understaff and they make their money,” said Sam Brooks, director of public policy at the Consumer Voice, a national resident advocacy organization. “Then they multiply it over a series of different facilities.”
This is a condensed version of an article from The Conversation’s investigative unit. To find out more about the rise of for-profit nursing homes, financial trickery and what could make the nation’s most vulnerable citizens safer, read the complete version.
Campbell is an adjunct assistant professor at Columbia University and a contributing writer at the Garrison Project, an independent news organization that focuses on mass incarceration and criminal justice.
Harrington is an advisory board member of the nonprofit Veteran's Health Policy Institute and a board member of the nonprofit Center for Health Information and Policy. Harrington served as an expert witness on nursing home litigation cases by residents against facilities owned or operated by Brius and Shlomo Rechnitz in the past and in 2022. She also served as an expert witness in a case against The Citadel Salisbury in North Carolina in 2021.
real estate pandemic

Default: San Francisco Four Seasons Hotel Investors $3 Million Late On Loan As Foreclosure Looms


Manufacturing and construction vs. the still-inverted yield curve


Correcting the Washington Post’s 11 Charts That Are Supposed to Tell Us How the Economy Changed Since Covid


Half Of Downtown Pittsburgh Office Space Could Be Empty In 4 Years


Airline, travel companies face Chapter 11 bankruptcy, default risk


Profits over patients: For-profit nursing home chains are draining resources from care while shifting huge sums to owners’ pockets
-

 Uncategorized4 weeks ago
All Of The Elements Are In Place For An Economic Crisis Of Staggering Proportions
-

 Spread & Containment5 days ago
IFM’s Hat Trick and Reflections On Option-To-Buy M&A
-

 International1 week ago
EyePoint poaches medical chief from Apellis; Sandoz CFO, longtime BioNTech exec to retire
-

 Uncategorized1 month ago
California Counties Could Be Forced To Pay $300 Million To Cover COVID-Era Program
-

 Uncategorized3 weeks ago
Apparel Retailer Express Moving Toward Bankruptcy
-

 Uncategorized1 month ago
Industrial Production Decreased 0.1% in January
-

 International1 week ago
Walmart launches clever answer to Target’s new membership program
-

 Uncategorized1 month ago
RFK Jr: The Wuhan Cover-Up & The Rise Of The Biowarfare-Industrial Complex