Sun Life Reports Second Quarter 2022 Results
Sun Life Reports Second Quarter 2022 Results
Canada NewsWire
TORONTO, Aug. 3, 2022
Sun Life Financial Inc. (“SLF Inc.”), its subsidiaries and, where applicable, its joint ventures and associates are collectively referred to as “the Company”, “Sun L…
Share this:

Sun Life Reports Second Quarter 2022 Results
Canada NewsWire
TORONTO, Aug. 3, 2022
Sun Life Financial Inc. ("SLF Inc."), its subsidiaries and, where applicable, its joint ventures and associates are collectively referred to as "the Company", "Sun Life", "we", "our", and "us". We manage our operations and report our financial results in five business segments: Canada, United States ("U.S."), Asset Management, Asia, and Corporate. The information in this document is based on the unaudited interim financial results of SLF Inc. for the period ended June 30, 2022 and should be read in conjunction with the interim management's discussion and analysis ("MD&A") and our unaudited interim consolidated financial statements and accompanying notes ("Interim Consolidated Financial Statements") for the period ended June 30, 2022, prepared in accordance with International Financial Reporting Standards ("IFRS"). We report certain financial information using non-IFRS financial measures. For more details, refer to the Non-IFRS Financial Measures section in this document. Additional information relating to SLF Inc. is available on www.sunlife.com under Investors – Financial results and reports, on the SEDAR website at www.sedar.com, and on the U.S. Securities and Exchange Commission's website at www.sec.gov. Reported net income (loss) refers to Common shareholders' net income (loss) determined in accordance with IFRS. Unless otherwise noted, all amounts are in Canadian dollars. |
TORONTO, Aug. 3, 2022 /CNW/ - Sun Life Financial Inc. (TSX: SLF) (NYSE: SLF) announced its results for the second quarter ended June 30, 2022.
- Q2'22 reported net income of $785 million decreased 13% and underlying net income(1) of $892 million increased 1% from Q2'21.
- Q2'22 reported EPS(2) was $1.34 and underlying EPS(1)(2) was $1.52.
- Q2'22 reported ROE(1) was 13.1% and underlying ROE(1) was 14.9%.
"Sun Life's second quarter results reflect the strength and resilience of our diversified business mix in the face of market volatility and a challenging external environment," said Kevin Strain, President and CEO of Sun Life.
"We're helping our Clients achieve lifetime financial security and live healthier lives through several strategic initiatives. In the U.S., we completed our acquisition of DentaQuest, a values-driven industry leader. In Canada and Malaysia, we announced new Shariah-based products that provide our Clients with more choice when it comes to their wealth-solution needs. We also renewed our bancassurance partnership with RCBC in the Philippines for an additional 10 years. And capital raising of $5.7 billion at SLC Management during the quarter reflects strong demand for our alternative investment capabilities."
Quarterly results | Year-to-date | ||||
Profitability | Q2'22 | Q2'21 | 2022 | 2021 | |
Reported net income - Common shareholders ($ millions) | 785 | 900 | 1,643 | 1,837 | |
Underlying net income ($ millions)(1) | 892 | 883 | 1,735 | 1,733 | |
Reported EPS ($)(2) | 1.34 | 1.53 | 2.80 | 3.12 | |
Underlying EPS ($)(1)(2) | 1.52 | 1.50 | 2.97 | 2.95 | |
Reported return on equity ("ROE")(1) | 13.1 % | 16.3 % | 13.7 % | 16.5 % | |
Underlying ROE(1) | 14.9 % | 16.0 % | 14.5 % | 15.5 % | |
Growth | Q2'22 | Q2'21 | 2022 | 2021 | |
Insurance sales ($ millions)(1) | 736 | 710 | 1,535 | 1,440 | |
Wealth sales and asset management gross flows ($ millions)(1) | 57,376 | 55,013 | 115,263 | 120,975 | |
Value of new business ("VNB") ($ millions)(1) | 271 | 284 | 529 | 562 | |
Assets under management ("AUM") ($ billions)(1)(3) | 1,261 | 1,361 | |||
Financial Strength | Q2'22 | Q2'21 | |||
LICAT ratios (at period end)(4) | |||||
Sun Life Financial Inc. | 128 % | 147 % | |||
Sun Life Assurance(5) | 124 % | 125 % | |||
Financial leverage ratio (at period end)(1) | 25.7 % | 24.7 % | |||
_________________ | |
(1) | Represents a non-IFRS financial measure. For more details, see the Non-IFRS Financial Measures section in this document and in our MD&A for the period ended June 30, 2022 ("Q2'22 MD&A"). |
(2) | All earnings per share ("EPS") measures refer to fully diluted EPS, unless otherwise stated. |
(3) | AUM is comprised of General Funds and Segregated Funds on our Statements of Financial Position, and other third-party assets managed by the Company ("other AUM"). For more details, see the Non-IFRS Financial Measures section in this document and in our Q2'22 MD&A. |
(4) | For further information on the Life Insurance Capital Adequacy Test ("LICAT"), see section E - Financial Strength in our Q2'22 MD&A. Our LICAT ratios are calculated in accordance with OSFI-mandated guideline, Life Insurance Capital Adequacy Test. |
(5) | Sun Life Assurance Company of Canada ("Sun Life Assurance") is SLF Inc.'s principal operating life insurance subsidiary. |
Financial and Operational Highlights - Quarterly Comparison (Q2 2022 vs. Q2 2021)
Our strategy is focused on key business segments, where we aim to be a leader in the markets in which we operate.
($ millions, unless otherwise noted) | ||||||||||||
Reported net income (loss) - | Underlying | Insurance | Wealth sales and asset | |||||||||
Q2'22 | Q2'21 | change | Q2'22 | Q2'21 | change | Q2'22 | Q2'21 | change | Q2'22 | Q2'21 | change | |
Canada | 160 | 404 | (60) % | 344 | 290 | 19 % | 218 | 196 | 11 % | 4,438 | 3,825 | 16 % |
U.S. | 213 | 157 | 36 % | 154 | 165 | (7) % | 213 | 191 | 12 % | — | — | — |
Asset Management | 296 | 221 | 34 % | 270 | 311 | (13) % | — | — | — | 49,640 | 47,164 | 5 % |
Asia | 131 | 143 | (8) % | 148 | 152 | (3) % | 305 | 323 | (6) % | 3,298 | 4,024 | (18) % |
Corporate | (15) | (25) | nm(2) | (24) | (35) | nm(2) | — | — | — | — | — | — |
Total | 785 | 900 | (13) % | 892 | 883 | 1 % | 736 | 710 | 4 % | 57,376 | 55,013 | 4 % |
(1) Represents a non-IFRS financial measure. See the Non-IFRS Financial Measures section in this document and in the Q2'22 MD&A. |
(2) Not meaningful. |
Reported net income of $785 million decreased $115 million or 13% from prior year, reflecting unfavourable market-related impacts and DentaQuest acquisition costs, partially offset by fair value changes on MFS' share-based payment awards(1) and a gain on the sale-leaseback of our Wellesley office in the U.S. Underlying net income of $892 million(2) was up slightly, driven by business growth, new business gains, contribution from the DentaQuest acquisition, and lower incentive compensation expenses. This was largely offset by Asset Management results reflecting a decline in global equity markets driving lower average net assets ("ANA"), lower available-for-sale ("AFS") gains and morbidity experience in the U.S.
Canada: A leader in insurance and asset management
Canada reported net income of $160 million decreased $244 million or 60% from prior year, reflecting lower equity markets and rising interest rates, partially offset by an increase in underlying net income of $54 million. Underlying net income of $344 million increased 19%, driven by business growth, higher new business gains and experience-related items. Experience in the quarter included favourable credit, investment gains and morbidity. Sun Life Health morbidity reflected improved disability experience in the quarter, driven by lower claims volumes and shorter claims durations.
Canada insurance sales were $218 million, up 11% year-over-year, driven by large case group benefits sales in Sun Life Health. Canada wealth sales were $4 billion, up 16%, driven by defined contribution(3) and defined benefit solutions sales in Group Retirement Services ("GRS"), partially offset by lower individual wealth sales.
We continue to innovate and provide Clients with wealth solutions that are tailored to their personal needs. This quarter, SLGI Asset Management announced the launch of the Sun Life Crescent Specialty Credit Private Pool fund, providing Clients access to an alternative yield source. Group Retirement Services also launched its first Shariah-based pool fund(4), which gives Canadian plan members an option that reflects Islamic principles while providing diversified access to equity markets.
U.S.: A leader in health and benefits
U.S. reported net income of $213 million increased $56 million or 36% from prior year, driven by a gain on the sale-leaseback of our Wellesley office and favourable market-related impacts, partially offset by DentaQuest acquisition costs. Underlying net income of $154 million decreased $11 million or 7%, reflecting experience-related items and lower AFS gains, partially offset by business growth including contribution from the DentaQuest acquisition. Experience in the quarter included favourable medical stop-loss margins, investment gains and favourable credit, partially offset by long-term disability claims. Mortality experience in Group Benefits improved driven by lower COVID-19-related claims.
Foreign exchange translation led to an increase of $8 million and $6 million in reported net income and underlying net income, respectively.
U.S. insurance sales were $213 million, up 12% year-over-year, driven by higher dental(5) and medical stop-loss sales.
On June 1, we completed our acquisition of DentaQuest, the second-largest dental benefits provider in the U.S(6). The transaction advances our strategy of being a leader in health and benefits in the U.S. With this acquisition, Sun Life U.S now serves more than 50 million Americans, and is expected to generate more than US$7 billion in total annual benefits revenues(7).
This quarter, we released our 10th annual medical stop-loss research report on high-cost medical claims. As the largest independent stop-loss provider in the U.S., we leveraged our extensive data, analytics, and health expertise to highlight current medical trends. The findings in the report help employers make better health plan decisions for their employees, leading to improved outcomes.
______________________ | |
(1) | MFS Investment Management ("MFS"). |
(2) | Refer to section C - Profitability in the Q2'22 MD&A for more information about experience-related items and the Non-IFRS Financial Measures section in this document for a reconciliation between reported net income and underlying net income. |
(3) | Defined contribution sales include retained business sales. |
(4) | BlackRock MSCI ACWI Islamic Equity Index Fund. |
(5) | For more details, see section F - Performance by Business Segment in the Q2'22 MD&A. |
(6) | By membership. |
(7) | For more details, see the Forward-looking Statements section in this document and in the Q2'22 MD&A. |
Asset Management: A global leader in both public and alternative asset classes through MFS and SLC Management
Asset Management reported net income of $296 million increased $75 million or 34% from prior year, driven by fair value changes on MFS' share-based payment awards. Underlying net income of $270 million decreased $41 million or 13%, due to lower results in MFS reflecting a decline in global equity markets driving lower ANA.
Foreign exchange translation led to an increase of $10 million in reported net income and $9 million in underlying net income.
Asset Management ended Q2'22 with $905 billion in AUM, consisting of $712 billion (US$553 billion) in MFS and $194 billion in SLC Management. Total Asset Management net inflows of $0.3 billion in Q2'22 reflected SLC Management net inflows of approximately $7.3 billion, largely offset by MFS net outflows of approximately $7.0 billion (US$5.5 billion).
In the second quarter of 2022, 98%, 71% and 49% of MFS' U.S. retail mutual fund assets ranked in the top half of their Morningstar categories based on ten-, five- and three-year performance, respectively. The MFS pre-tax net operating profit margin(1) was 36% for Q2'22, compared to 39% in the prior year, driven by the decline in ANA. The SLC Management fee-related earnings margin(1)(2) was 23%, down from 25%.
Our Asset Management businesses built on their commitment to integrating climate strategies as we continue our sustainability journey. In July 2022, MFS set an interim target to align 90% of in-scope assets(3) with the Net Zero Asset Managers initiative(4). During the second quarter, BentallGreenOak ("BGO") was also awarded the 2022 ENERGY STAR Partner of the Year – Sustained Excellence Award by the U.S. Environmental Protection Agency and the U.S. Department of Energy ("DOE") for the 12th consecutive year, and received Gold Recognition in the 2022 Green Lease Leaders program organized by the Institute for Market Transformation and the DOE's Better Buildings Alliance.
Asia: A regional leader focused on fast-growing markets
Asia reported net income of $131 million decreased $12 million or 8% from prior year. Underlying net income of $148 million decreased $4 million or 3% from prior year, reflecting policyholder behaviour experience primarily in Vietnam, and new business strain in Hong Kong as COVID-19 restrictions drove lower sales, partially offset by new business gains in International.
Foreign exchange translation led to a decline of $1 million in reported net income and underlying net income.
Asia insurance sales were $305 million, down 6% year-over-year, reflecting lower sales in International and Hong Kong, partially offset by sales growth in all other markets. Asia wealth sales were $3 billion, down 18%, reflecting lower sales in India and Hong Kong, partially offset by higher sales in the Philippines.
We continue to leverage Sun Life's global asset management capabilities and execute on our growth strategy through strategic partnerships. In India, Aditya Birla Sun Life AMC Limited ("ABSLAMC") partnered with BGO, a subsidiary of SLC Management, to form a real estate-focused investment vehicle. This collaboration brings together two leading investment managers with extensive track records in both the domestic and international markets, to create new investment opportunities for Clients.
In the Philippines, our joint venture, Sun Life Grepa Financial, renewed its bancassurance partnership with Rizal Commercial Banking Corporation ("RCBC"), one of the country's leading commercial banks. The 10-year renewal, through to 2033, allows more Filipinos to access financial protection products, leveraging the strength of RCBC's extensive sales network of over 430 branches and almost 2 million customers.
Corporate
Corporate reported net loss of $15 million improved $10 million from prior year. Underlying net loss of $24 million improved by $11 million, driven by lower expenses, partially offset by losses on seed investments and AFS assets.
IFRS 17 Insurance Contracts ("IFRS 17") and IFRS 9 Financial Instruments ("IFRS 9") to be Adopted in 2023
For periods beginning on or after January 1, 2023, we will be adopting IFRS 17, which replaces IFRS 4 Insurance Contracts. IFRS 17 establishes the principles for the recognition, measurement, presentation and disclosure of insurance contracts. Effective January 1, 2023, we will also be adopting IFRS 9, which replaces IAS 39 Financial Instruments: Recognition and Measurement.
The adoption of IFRS 17 and IFRS 9 has no material implication on our business strategies, however, upon transition at January 1, 2022, the changes in measurement of insurance contract liabilities and timing of recognition of earnings would have resulted in the following impacts:
- A net transfer of approximately $4.5 billion from shareholders' equity, primarily driven by the establishment of the contractual service margin ("CSM") on the balance sheet, among other items.
- As we restate the comparative year on an IFRS 17 basis, we expect a mid-single digit decrease in our 2022 underlying net income.
The CSM balance will qualify as Tier 1 available capital. On July 21, 2022, OSFI finalized the LICAT guidelines to reflect the IFRS 17 adoption, effective January 1, 2023. We expect our LICAT ratio to improve on adoption and we also expect capital generation and capital volatility to be relatively unchanged under the new regime.
______________________ | |
(1) | Represents a non-IFRS financial measure. For more details, see the Non-IFRS Financial Measures section in this document and in the Q2'22 MD&A. |
(2) | Based on a trailing 12-month basis. |
(3) | Approximately 92% of MFS' AUM balance as at June 30, 2022. |
(4) | An international group of asset managers committed to supporting the goal of achieving net zero carbon emissions by 2050 or sooner. |
Our medium-term financial objectives following the adoption of IFRS 17 and 9 will be:
- Underlying EPS growth: 8-10%
- Underlying ROE: 18%+ (an increase from 16%+ prior to transition)
- Underlying Dividend payout ratio: 40-50%
We continue to assess the impact that the adoption of IFRS 17 and IFRS 9 will have on our Consolidated Financial Statements and estimates of the financial impacts are subject to change as we continue to assess the implications of adopting both standards. For additional details, refer to Note 2 in the Interim Consolidated Financial Statements.
Earnings Conference Call
The Company's Q2'22 financial results will be reviewed at a conference call on Thursday, August 4, 2022, at 10:00 a.m. ET. To listen to the call via live audio webcast and to view the presentation slides, as well as related information, please visit www.sunlife.com and click on the link to Quarterly reports under Investors – Financial results & reports 10 minutes prior to the start of the call. Individuals participating in the call in a listen-only mode are encouraged to connect via our webcast. Following the call, the webcast and presentation will be archived and made available on the Company's website, www.sunlife.com, until the Q2 2023 period end. The conference call can also be accessed by phone by dialing 412-902-4130 (International) or 1-833-634-2605 (toll–free within North America) and referencing the Sun Life Q2 earnings call. A replay of the conference call will be available from Thursday, August 4, 2022 at 1:00 p.m. ET until 1:00 p.m. ET on Thursday, August 18, 2022 by calling 412-317-0088 or 1-877-344-7529 (toll–free within North America) using access code: 2586651.
Media Relations Contact: | Investor Relations Contact: |
Krista Wilson | Yaniv Bitton |
Director, Corporate Communications | Vice-President, Head of Investor Relations and Capital Markets |
Tel: 226-751-2391 | Tel: 416-979-6496 |
krista.wilson@sunlife.com | yaniv.bitton@sunlife.com |
Non-IFRS Financial Measures | ||
We report certain financial information using non-IFRS financial measures, as we believe that these measures provide information that is useful to investors in understanding our performance and facilitate a comparison of our quarterly and full year results from period to period. These non-IFRS financial measures do not have any standardized meaning and may not be comparable with similar measures used by other companies. For certain non-IFRS financial measures, there are no directly comparable amounts under IFRS. These non-IFRS financial measures should not be viewed in isolation from or as alternatives to measures of financial performance determined in accordance with IFRS. Additional information concerning non-IFRS financial measures and, if applicable, reconciliations to the closest IFRS measures are available in Q2 2022 MD&A under the heading M - Non-IFRS Financial Measures, in our annual MD&A under the heading L - Non-IFRS Financial Measures and the Supplementary Financial Information packages that are available on www.sunlife.com under Investors – Financial results and reports. | ||
1. Underlying Net Income and Underlying EPS | ||
Underlying net income (loss) and financial measures based on underlying net income (loss), including underlying EPS or underlying loss per share, and underlying ROE, are non-IFRS financial measures. Underlying net income (loss) removes from reported net income (loss) the impacts of the following items in our results under IFRS and when removed assist in explaining our results from period to period: | ||
(a) | market-related impacts that differ from our best estimate assumptions, which include: (i) impacts of returns in equity markets, net of hedging, for which our best estimate assumptions are approximately 2% per quarter. This also includes the impact of the basis risk inherent in our hedging program, which is the difference between the return on underlying funds of products that provide benefit guarantees and the return on the derivative assets used to hedge those benefit guarantees; (ii) the impacts of changes in interest rates in the reporting period and on the value of derivative instruments used in our hedging programs including changes in credit and swap spreads, and any changes to the assumed fixed income reinvestment rates in determining the actuarial liabilities; and (iii) the impacts of changes in the fair value of investment properties in the reporting period; | |
(b) | assumption changes and management actions, which include: (i) the impacts of revisions to the methods and assumptions used in determining our liabilities for insurance contracts and investment contracts; and (ii) the impacts on insurance contracts and investment contracts of actions taken by management in the current reporting period, referred to as management actions which include, for example, changes in the prices of in-force products, new or revised reinsurance on in-force business, and material changes to investment policies for assets supporting our liabilities; and | |
(c) | other adjustments: | |
i) | fair value adjustments on MFS' share-based payment awards that are settled with MFS' own shares and accounted for as liabilities and measured at fair value each reporting period until they are vested, exercised and repurchased - this adjustment enhances the comparability of MFS' results with publicly traded asset managers in the United States; | |
ii) | acquisition, integration and restructuring costs - this adjustment enhances comparability of our results from period to period, by removing the impacts of costs, including the unwinding of the discount for certain liabilities related to acquisitions, that are not ongoing in nature and are incurred with the intent to generate benefits in future periods; | |
iii) | certain hedges in Canada that do not qualify for hedge accounting - this adjustment enhances the comparability of our results from period to period, as it reduces volatility to the extent it will be offset over the duration of the hedges; and | |
iv) | other items that are unusual or exceptional in nature. | |
All factors discussed in this document that impact our underlying net income are also applicable to reported net income. All EPS measures in this document refer to fully diluted EPS, unless otherwise stated. As noted below, underlying EPS excludes the dilutive impacts of convertible instruments. | ||
The following table sets out the post-tax amounts that were excluded from our underlying net income (loss) and underlying EPS and provides a reconciliation to our reported net income (loss) and EPS based on IFRS. | ||
Reconciliations of Select Net Income Measures | Quarterly results | Year-to-date | ||
($ millions, unless otherwise noted) | Q2'22 | Q2'21 | 2022 | 2021 |
Reported net income - Common shareholders | 785 | 900 | 1,643 | 1,837 |
Market-related impacts | ||||
Equity market impacts | ||||
Impacts from equity market changes | (169) | 95 | (193) | 162 |
Basis risk impacts | 10 | 4 | 32 | 9 |
Equity market impacts | (159) | 99 | (161) | 171 |
Interest rate impacts(1) | ||||
Impacts of interest rate changes | (93) | (50) | (150) | 111 |
Impacts of credit spread movements | 20 | (10) | 60 | (18) |
Impacts of swap spread movements | 5 | 24 | (8) | 12 |
Interest rate impacts | (68) | (36) | (98) | 105 |
Impacts of changes in the fair value of investment properties | 75 | 28 | 145 | 24 |
Less: Market-related impacts | (152) | 91 | (114) | 300 |
Less: Assumption changes and management actions | — | 2 | 1 | (2) |
Other adjustments | ||||
Fair value adjustments on MFS' share-based payment awards | 44 | (52) | 41 | (96) |
Acquisition, integration and restructuring(2)(3) | (74) | (13) | (95) | (87) |
Other(4)(5) | 75 | (11) | 75 | (11) |
Less: Total of other adjustments | 45 | (76) | 21 | (194) |
Underlying net income | 892 | 883 | 1,735 | 1,733 |
Reported EPS (diluted) ($) | 1.34 | 1.53 | 2.80 | 3.12 |
Less: Market-related impacts ($) | (0.26) | 0.16 | (0.20) | 0.50 |
Assumption changes and management actions ($) | — | — | — | — |
Fair value adjustments on MFS' share-based payment awards ($) | 0.08 | (0.09) | 0.07 | (0.16) |
Acquisition, integration and restructuring ($) | (0.13) | (0.02) | (0.16) | (0.15) |
Other ($) | 0.13 | (0.02) | 0.13 | (0.02) |
Impact of convertible securities on diluted EPS ($) | — | — | (0.01) | — |
Underlying EPS (diluted) ($) | 1.52 | 1.50 | 2.97 | 2.95 |
(1) | Our exposure to interest rates varies by product type, line of business, and geography. Given the long-term nature of our business, we have a higher degree of sensitivity in respect of interest rates at long durations. |
(2) | Amounts relate to acquisition costs for our SLC affiliates, BentallGreenOak, InfraRed Capital Partners and Crescent Capital Group LP, which include the unwinding of the discount for Other financial liabilities of $16 million in Q2'22 and $32 million for the first six months of 2022 (Q2'21 - $13 million; the first six months of 2021 - $27 million). |
(3) | The restructuring charge of $57 million in Q1'21 related to our strategy for our workspace and redefining the role of the office. |
(4) | Relates to a Q2'22 gain on the sale-leaseback of our Wellesley office in the U.S. |
(5) | Amounts relate to the UK Finance Act that was signed into law on June 10, 2021, increasing the corporate tax rate from 19% to 25%, which will take effect for future tax periods beginning April 1, 2023. As a result, reported net income decreased by $11 million in Q2'21. |
The following table shows the pre-tax amount of underlying net income adjustments: |
Quarterly results | Year-to-date | |||
($ millions, unless otherwise noted) | Q2'22 | Q2'21 | 2022 | 2021 |
Reported net income - Common shareholders (after-tax) | 785 | 900 | 1,643 | 1,837 |
Underlying net income adjustments (pre-tax): | ||||
Less: Market-related impacts | (109) | 85 | 84 | 465 |
Assumption changes and management actions | — | 2 | 1 | (4) |
Other adjustments(1) | 57 | (64) | 31 | (208) |
Total underlying net income adjustments (pre-tax) | (52) | 23 | 116 | 253 |
Less: Taxes related to underlying net income adjustments(1) | (55) | (6) | (208) | (149) |
Underlying net income (after-tax) | 892 | 883 | 1,735 | 1,733 |
(1) | Effective January 1, 2022, there was a change in presentation for the fair value adjustments on MFS' share-based payment awards. We have updated prior periods to reflect this change in presentation. The post-tax basis presentation was not affected. |
Taxes related to underlying net income adjustments may vary from the expected effective tax rate range reflecting the mix of business based on the Company's international operations. |
2. Additional Non-IFRS Financial Measures |
Assets under management. AUM is a non-IFRS financial measure that indicates the size of our company's asset management, wealth, and insurance assets. There is no standardized financial measure under IFRS. In addition to the most directly comparable IFRS measures, which are the balance of General funds and Segregated funds on our Statements of Financial Position, AUM also includes Other AUM. |
Other AUM is composed of retail, institutional and other-third party assets, as well as general fund and segregated fund assets managed by our joint ventures. In Canada, other AUM includes Client assets in retail mutual fund products of Sun Life Global Investments. In Asia, other AUM includes Client assets in Hong Kong managed fund products, International wealth products, Philippines mutual and managed fund products, Aditya Birla Sun Life AMC Limited equity and fixed income mutual fund products, Sun Life Everbright Asset Management products and our joint ventures' general fund and segregated fund assets based on our proportionate equity interest. In Asset Management, other AUM includes Client assets for retail and institutional Clients, as well as capital raising, such as uncalled commitments and fund leverage in SLC Management. There is no directly comparable IFRS financial measure. |
Effective January 1, 2022, certain components of Other AUM were renamed to "Retail" and "Institutional and managed funds" to align with market naming conventions. Previously, these components were referred to as Mutual funds and Managed funds, respectively, in our interim and annual MD&A. While labeling changes have modified certain terminology, the composition of these components has not been affected. |
Quarterly results | ||
($ millions) | Q2'22 | Q2'21 |
General fund assets | 195,382 | 195,689 |
Segregated funds | 120,098 | 133,249 |
Other AUM | 945,554 | 1,031,753 |
Total assets under management | 1,261,034 | 1,360,691 |
Assumption changes and management actions. In this document the impacts of ACMA on shareholders' net income (after-tax) is included in reported net income and is excluded from underlying net income, as described in section C - Profitability in the Q2'22 MD&A. |
Note 6.A of the Interim Consolidated Financial Statements for the period ended June 30, 2022 shows the pre-tax impacts of method and assumption changes on shareholders' and participating policyholders' insurance contract liabilities net of reinsurance assets, excluding changes in other policy liabilities and assets. The view in this document of ACMA is the impacts on shareholders' reported net income (after-tax). The Consolidated Financial Statements view is a component of the change in total company liabilities. |
The following table provides a reconciliation of the differences between the two measures. |
Quarterly results | Year-to-date | |||
($ millions) | Q2'22 | Q2'21 | 2022 | 2021 |
Impacts of method and assumption changes on insurance contract liabilities (pre-tax) | — | (26) | 5 | (34) |
Less: Participating policyholders(1) | — | (26) | 4 | (30) |
Impacts of method and assumption changes excluding participating policyholders (pre-tax) | — | — | 1 | (4) |
Less: Tax | — | — | — | (2) |
Impacts of method and assumption changes excluding participating policyholders (after-tax) | — | — | 1 | (2) |
Add: Management actions (after-tax)(2) | — | 2 | — | — |
Other (after-tax)(3) | — | — | — | — |
Assumption changes and management actions (after-tax)(4)(5) | — | 2 | 1 | (2) |
(1) | Adjustment to remove the pre-tax impacts of method and assumption changes on amounts attributed to participating policyholders. |
(2) | Adjustment to include the after-tax impacts of management actions on insurance contract liabilities and investment contract liabilities which include, for example, changes in the prices of in-force products, new or revised reinsurance on in-force business, and material changes to investment policies for assets supporting our liabilities. The pre-tax impact of management actions to Method and assumption changes on insurance contract liabilities was $nil in Q2'22 and $nil for the first six months of 2022 (Q2'21 - an increase of $2 million; the first six months of 2021 - $nil). |
(3) | Adjustments to include the after-tax impacts of method and assumption changes on investment contracts and other policy liabilities, and the pre-tax impact to Method and assumption changes on insurance contract liabilities was $nil in Q2'22 and $nil for the first six months of 2022 (Q2'21 - $nil; the first six months of 2021 - $nil). |
(4) | Includes the tax impacts of ACMA on insurance contract liabilities and investment contract liabilities, reflecting the tax rates in the jurisdictions in which we do business. |
(5) | ACMA is included in reported net income and is excluded in calculating underlying net income, as described in section C - Profitability in the Q2'22 MD&A. |
Cash and other liquid assets. This measure is comprised of cash, cash equivalents, short-term investments, and publicly traded securities, net of loans related to acquisitions that are held at SLF Inc. (the ultimate parent company), and its wholly owned holding companies. This measure represents available funds for capital re-deployment to support business growth. | |
($ millions) | As at June 30, 2022 | As at December 31, 2021 |
Cash, cash equivalents & short-term securities | 580 | 2,383 |
Debt securities(1) | 1,428 | 1,421 |
Equity securities(2) | 98 | 861 |
Sub-total(3) | 2,106 | 4,665 |
Less: Loans related to acquisitions (held at SLF Inc. and its wholly owned holding companies)(4) | (1,109) | — |
Cash and other liquid assets (held at SLF Inc. and its wholly owned holding companies)(5) | 997 | 4,665 |
(1) | Includes publicly traded bonds. |
(2) | Includes ETF Investments. |
(3) | Q4'21 amounts included $2.0 billion of proceeds from the subordinated debt offerings completed in November 2021, of which $1.5 billion did not qualify as LICAT capital at issuance as it was subjected to contractual terms requiring us to redeem the underlying securities in full, if the closing of the DentaQuest acquisition did not occur. We completed our acquisition of DentaQuest on June 1, 2022. |
(4) | Loans related to acquisitions have been included as an adjustment to Cash and other liquid assets, as they reflect funding for the DentaQuest acquisition. |
(5) | Represents available funds for capital re-deployment. |
3. Reconciliations of Select Non-IFRS Financial Measures | |
Reported Net Income to Underlying Net Income Reconciliation - Pre-tax by Business Group | |
Q2'22 | |||||||||||||||
($ millions) | Canada | U.S. | Asset Management | Asia | Corporate | Total | |||||||||
Reported net income (loss) - Common shareholders | 160 | 213 | 296 | 131 | (15) | 785 | |||||||||
Less: Market-related impacts (pre-tax)(1) | (143) | 43 | — | (12) | 3 | (109) | |||||||||
ACMA (pre-tax) | — | — | — | — | — | — | |||||||||
Other adjustments (pre-tax)(1)(2) | (1) | 32 | 32 | (6) | — | 57 | |||||||||
Tax expense (benefit) on above items(2) | (40) | (16) | (6) | 1 | 6 | (55) | |||||||||
Underlying net income (loss) | 344 | 154 | 270 | 148 | (24) | 892 | |||||||||
Q2'21 | |||||||||||||||
Reported net income (loss) - Common shareholders | 404 | 157 | 221 | 143 | (25) | 900 | |||||||||
Less: Market-related impacts (pre-tax)(1) | 106 | (7) | — | (11) | (3) | 85 | |||||||||
ACMA (pre-tax) | — | — | — | 2 | — | 2 | |||||||||
Other adjustments (pre-tax)(1)(2) | — | (2) | (70) | — | 8 | (64) | |||||||||
Tax expense (benefit) on above items(2) | 8 | 1 | (20) | — | 5 | (6) | |||||||||
Underlying net income (loss) | 290 | 165 | 311 | 152 | (35) | 883 | |||||||||
(1) | For a breakdown of this adjustment made to arrive at a non-IFRS financial measure, see the heading Underlying Net Income and Underlying EPS. |
(2) | Effective January 1, 2022, there was a change in presentation for the fair value adjustments on MFS' share-based payment awards. We have updated prior periods to reflect this change in presentation. The post-tax basis presentation was not affected. |
Forward-looking Statements
From time to time, the Company makes written or oral forward-looking statements within the meaning of certain securities laws, including the "safe harbour" provisions of the United States Private Securities Litigation Reform Act of 1995 and applicable Canadian securities legislation. Forward-looking statements contained in this document include statements (i) relating to our strategies; (ii) relating to our growth initiatives and other business objectives; (iii) relating to our targets and commitments (including with respect to net zero emissions); (iv) relating to the plans we have implemented in response to the COVID-19 pandemic and related economic conditions and their impact on the Company, (v) that are predictive in nature or that depend upon or refer to future events or conditions, and (vi) that include words such as "achieve", "aim", "ambition", "anticipate", "aspiration", "assumption", "believe", "could", "estimate", "expect", "goal", "initiatives", "intend", "may", "objective", "outlook", "plan", "project", "seek", "should", "strategy", "strive", "target", "will", and similar expressions. Forward-looking statements include the information concerning our possible or assumed future results of operations. These statements represent our current expectations, estimates, and projections regarding future events and are not historical facts, and remain subject to change, particularly in light of the ongoing and developing COVID-19 pandemic and its impact on the global economy and its uncertain impact on our business.
Forward-looking statements are not a guarantee of future performance and involve risks and uncertainties that are difficult to predict. Future results and shareholder value may differ materially from those expressed in these forward-looking statements due to, among other factors, the impact of the COVID-19 pandemic and related economic conditions on our operations, liquidity, financial conditions or results and the matters set out in the Q2'22 MD&A under the headings C - Profitability - 5 - Income taxes, E - Financial Strength and H - Risk Management and in SLF Inc.'s 2021 AIF under the heading Risk Factors, and the factors detailed in SLF Inc.'s other filings with Canadian and U.S. securities regulators, which are available for review at www.sedar.com and www.sec.gov, respectively.
Important risk factors that could cause our assumptions and estimates, and expectations and projections to be inaccurate and our actual results or events to differ materially from those expressed in or implied by the forward-looking statements contained in this document, are set out below. The realization of our forward-looking statements, essentially depends on our business performance which, in turn, is subject to many risks, which have been further heightened with the current COVID-19 pandemic given the uncertainty of its duration and impact. Factors that could cause actual results to differ materially from expectations include, but are not limited to: market risks - related to the performance of equity markets; changes or volatility in interest rates or credit spreads or swap spreads; real estate investments; and fluctuations in foreign currency exchange rates; insurance risks - related to policyholder behaviour; mortality experience, morbidity experience and longevity; product design and pricing; the impact of higher-than-expected future expenses; and the availability, cost and effectiveness of reinsurance; credit risks - related to issuers of securities held in our investment portfolio, debtors, structured securities, reinsurers, counterparties, other financial institutions and other entities; business and strategic risks - related to global economic and political conditions; the design and implementation of business strategies; changes in distribution channels or Client behaviour including risks relating to market conduct by intermediaries and agents; the impact of competition; the performance of our investments and investment portfolios managed for Clients such as segregated and mutual funds; shifts in investing trends and Client preference towards products that differ from our investment products and strategies; changes in the legal or regulatory environment, including capital requirements and tax laws; the environment, environmental laws and regulations; operational risks - related to breaches or failure of information system security and privacy, including cyber-attacks; our ability to attract and retain employees; legal, regulatory compliance and market conduct, including the impact of regulatory inquiries and investigations; the execution and integration of mergers, acquisitions, strategic investments and divestitures; our information technology infrastructure; a failure of information systems and Internet-enabled technology; dependence on third-party relationships, including outsourcing arrangements; business continuity; model errors; information management; liquidity risks - the possibility that we will not be able to fund all cash outflow commitments as they fall due; and other risks - COVID-19 matters, including the severity, duration and spread of COVID-19; its impact on the global economy, and its impact on Sun Life's business, financial condition and or results; risks associated with IFRS 17 Insurance Contracts and IFRS 9 Financial Instruments; our international operations, including our joint ventures; market conditions that affect our capital position or ability to raise capital; downgrades in financial strength or credit ratings; and tax matters, including estimates and judgements used in calculating taxes.
The Company does not undertake any obligation to update or revise its forward-looking statements to reflect events or circumstances after the date of this document or to reflect the occurrence of unanticipated events, except as required by law.
About Sun Life
Sun Life is a leading international financial services organization providing asset management, wealth, insurance and health solutions to individual and institutional Clients. Sun Life has operations in a number of markets worldwide, including Canada, the United States, the United Kingdom, Ireland, Hong Kong, the Philippines, Japan, Indonesia, India, China, Australia, Singapore, Vietnam, Malaysia and Bermuda. As of June 30, 2022, Sun Life had total assets under management of $1.26 trillion. For more information, please visit www.sunlife.com.
Sun Life Financial Inc. trades on the Toronto (TSX), New York (NYSE) and Philippine (PSE) stock exchanges under the ticker symbol SLF.
View original content to download multimedia:https://www.prnewswire.com/news-releases/sun-life-reports-second-quarter-2022-results-301599448.html
SOURCE Sun Life Financial Inc.
Government
CDC Warns Thousands Of Children Sent To ER After Taking Common Sleep Aid
CDC Warns Thousands Of Children Sent To ER After Taking Common Sleep Aid
Authored by Jack Phillips via The Epoch Times (emphasis ours),
A…
Share this:


Authored by Jack Phillips via The Epoch Times (emphasis ours),
A U.S. Centers for Disease Control (CDC) paper released Thursday found that thousands of young children have been taken to the emergency room over the past several years after taking the very common sleep-aid supplement melatonin.
The agency said that melatonin, which can come in gummies that are meant for adults, was implicated in about 7 percent of all emergency room visits for young children and infants “for unsupervised medication ingestions,” adding that many incidents were linked to the ingestion of gummy formulations that were flavored. Those incidents occurred between the years 2019 and 2022.
Melatonin is a hormone produced by the human body to regulate its sleep cycle. Supplements, which are sold in a number of different formulas, are generally taken before falling asleep and are popular among people suffering from insomnia, jet lag, chronic pain, or other problems.
The supplement isn’t regulated by the U.S. Food and Drug Administration and does not require child-resistant packaging. However, a number of supplement companies include caps or lids that are difficult for children to open.
The CDC report said that a significant number of melatonin-ingestion cases among young children were due to the children opening bottles that had not been properly closed or were within their reach. Thursday’s report, the agency said, “highlights the importance of educating parents and other caregivers about keeping all medications and supplements (including gummies) out of children’s reach and sight,” including melatonin.
The approximately 11,000 emergency department visits for unsupervised melatonin ingestions by infants and young children during 2019–2022 highlight the importance of educating parents and other caregivers about keeping all medications and supplements (including gummies) out of children’s reach and sight.
The CDC notes that melatonin use among Americans has increased five-fold over the past 25 years or so. That has coincided with a 530 percent increase in poison center calls for melatonin exposures to children between 2012 and 2021, it said, as well as a 420 percent increase in emergency visits for unsupervised melatonin ingestion by young children or infants between 2009 and 2020.
Some health officials advise that children under the age of 3 should avoid taking melatonin unless a doctor says otherwise. Side effects include drowsiness, headaches, agitation, dizziness, and bed wetting.
Other symptoms of too much melatonin include nausea, diarrhea, joint pain, anxiety, and irritability. The supplement can also impact blood pressure.
However, there is no established threshold for a melatonin overdose, officials have said. Most adult melatonin supplements contain a maximum of 10 milligrams of melatonin per serving, and some contain less.
Many people can tolerate even relatively large doses of melatonin without significant harm, officials say. But there is no antidote for an overdose. In cases of a child accidentally ingesting melatonin, doctors often ask a reliable adult to monitor them at home.
Dr. Cora Collette Breuner, with the Seattle Children’s Hospital at the University of Washington, told CNN that parents should speak with a doctor before giving their children the supplement.
“I also tell families, this is not something your child should take forever. Nobody knows what the long-term effects of taking this is on your child’s growth and development,” she told the outlet. “Taking away blue-light-emitting smartphones, tablets, laptops, and television at least two hours before bed will keep melatonin production humming along, as will reading or listening to bedtime stories in a softly lit room, taking a warm bath, or doing light stretches.”
In 2022, researchers found that in 2021, U.S. poison control centers received more than 52,000 calls about children consuming worrisome amounts of the dietary supplement. That’s a six-fold increase from about a decade earlier. Most such calls are about young children who accidentally got into bottles of melatonin, some of which come in the form of gummies for kids, the report said.
Dr. Karima Lelak, an emergency physician at Children’s Hospital of Michigan and the lead author of the study published in 2022 by the CDC, found that in about 83 percent of those calls, the children did not show any symptoms.
However, other children had vomiting, altered breathing, or other symptoms. Over the 10 years studied, more than 4,000 children were hospitalized, five were put on machines to help them breathe, and two children under the age of two died. Most of the hospitalized children were teenagers, and many of those ingestions were thought to be suicide attempts.
Those researchers also suggested that COVID-19 lockdowns and virtual learning forced more children to be at home all day, meaning there were more opportunities for kids to access melatonin. Also, those restrictions may have caused sleep-disrupting stress and anxiety, leading more families to consider melatonin, they suggested.
The Associated Press contributed to this report.
International
Red Candle In The Wind
Red Candle In The Wind
By Benjamin PIcton of Rabobank
February non-farm payrolls superficially exceeded market expectations on Friday by…
Share this:

By Benjamin PIcton of Rabobank
February non-farm payrolls superficially exceeded market expectations on Friday by printing at 275,000 against a consensus call of 200,000. We say superficially, because the downward revisions to prior months totalled 167,000 for December and January, taking the total change in employed persons well below the implied forecast, and helping the unemployment rate to pop two-ticks to 3.9%. The U6 underemployment rate also rose from 7.2% to 7.3%, while average hourly earnings growth fell to 0.2% m-o-m and average weekly hours worked languished at 34.3, equalling pre-pandemic lows.
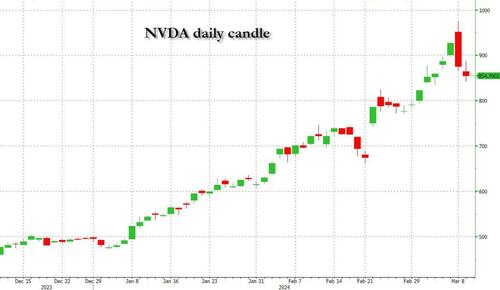
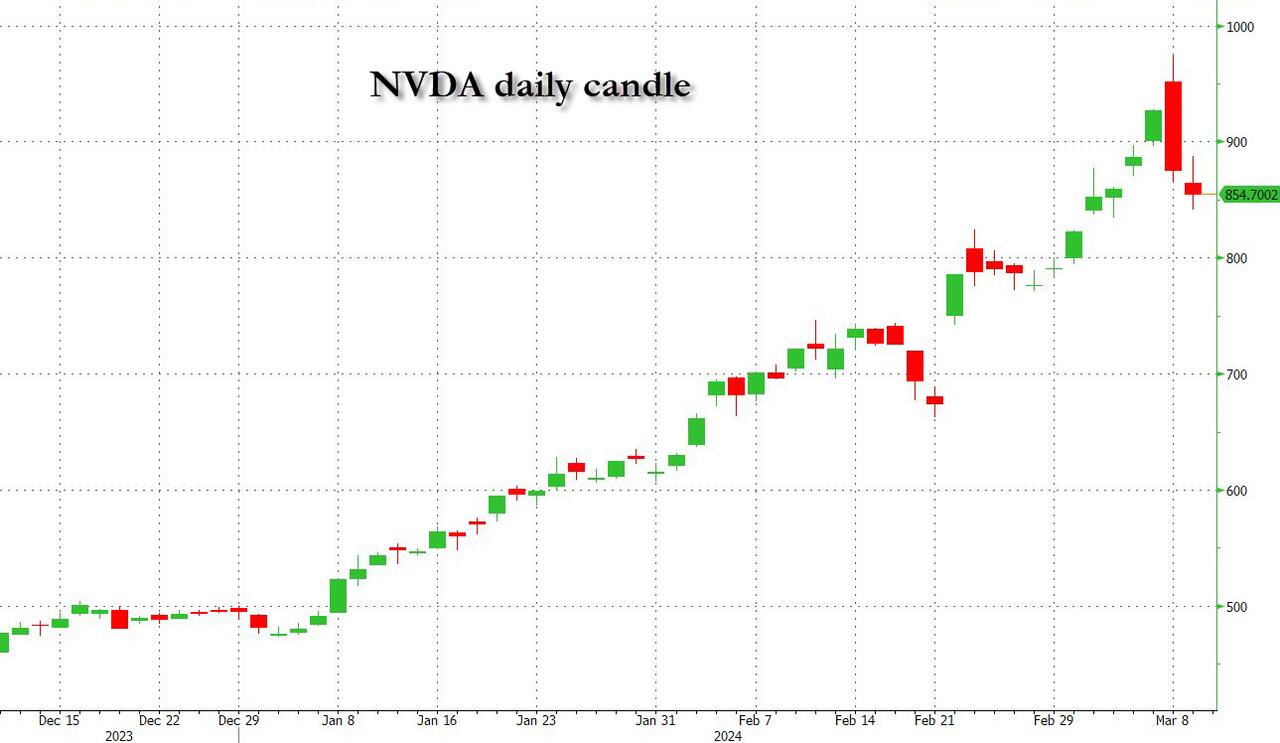
Undeterred by the devil in the detail, the algos sprang into action once exchanges opened. Market darling NVIDIA hit a new intraday high of $974 before (presumably) the humans took over and sold the stock down more than 10% to close at $875.28. If our suspicions are correct that it was the AIs buying before the humans started selling (no doubt triggering trailing stops on the way down), the irony is not lost on us.
The 1-day chart for NVIDIA now makes for interesting viewing, because the red candle posted on Friday presents quite a strong bearish engulfing signal. Volume traded on the day was almost double the 15-day simple moving average, and similar price action is observable on the 1-day charts for both Intel and AMD. Regular readers will be aware that we have expressed incredulity in the past about the durability the AI thematic melt-up, so it will be interesting to see whether Friday’s sell off is just a profit-taking blip, or a genuine trend reversal.
AI equities aside, this week ought to be important for markets because the BTFP program expires today. That means that the Fed will no longer be loaning cash to the banking system in exchange for collateral pledged at-par. The KBW Regional Banking index has so far taken this in its stride and is trading 30% above the lows established during the mini banking crisis of this time last year, but the Fed’s liquidity facility was effectively an exercise in can-kicking that makes regional banks a sector of the market worth paying attention to in the weeks ahead. Even here in Sydney, regulators are warning of external risks posed to the banking sector from scheduled refinancing of commercial real estate loans following sharp falls in valuations.
Markets are sending signals in other sectors, too. Gold closed at a new record-high of $2178/oz on Friday after trading above $2200/oz briefly. Gold has been going ballistic since the Friday before last, posting gains even on days where 2-year Treasury yields have risen. Gold bugs are buying as real yields fall from the October highs and inflation breakevens creep higher. This is particularly interesting as gold ETFs have been recording net outflows; suggesting that price gains aren’t being driven by a retail pile-in. Are gold buyers now betting on a stagflationary outcome where the Fed cuts without inflation being anchored at the 2% target? The price action around the US CPI release tomorrow ought to be illuminating.
Leaving the day-to-day movements to one side, we are also seeing further signs of structural change at the macro level. The UK budget last week included a provision for the creation of a British ISA. That is, an Individual Savings Account that provides tax breaks to savers who invest their money in the stock of British companies. This follows moves last year to encourage pension funds to head up the risk curve by allocating 5% of their capital to unlisted investments.
As a Hail Mary option for a government cruising toward an electoral drubbing it’s a curious choice, but it’s worth highlighting as cash-strapped governments increasingly see private savings pools as a funding solution for their spending priorities.
Of course, the UK is not alone in making creeping moves towards financial repression. In contrast to announcements today of increased trade liberalisation, Australian Treasurer Jim Chalmers has in the recent past flagged his interest in tapping private pension savings to fund state spending priorities, including defence, public housing and renewable energy projects. Both the UK and Australia appear intent on finding ways to open up the lungs of their economies, but government wants more say in directing private capital flows for state goals.
So, how far is the blurring of the lines between free markets and state planning likely to go? Given the immense and varied budgetary (and security) pressures that governments are facing, could we see a re-up of WWII-era Victory bonds, where private investors are encouraged to do their patriotic duty by directly financing government at negative real rates?
That would really light a fire under the gold market.
Government
Fauci Deputy Warned Him Against Vaccine Mandates: Email
Fauci Deputy Warned Him Against Vaccine Mandates: Email
Authored by Zachary Stieber via The Epoch Times (emphasis ours),
Mandating COVID-19…
Share this:


Authored by Zachary Stieber via The Epoch Times (emphasis ours),
Mandating COVID-19 vaccination was a mistake due to ethical and other concerns, a top government doctor warned Dr. Anthony Fauci after Dr. Fauci promoted mass vaccination.
“Coercing or forcing people to take a vaccine can have negative consequences from a biological, sociological, psychological, economical, and ethical standpoint and is not worth the cost even if the vaccine is 100% safe,” Dr. Matthew Memoli, director of the Laboratory of Infectious Diseases clinical studies unit at the U.S. National Institute of Allergy and Infectious Diseases (NIAID), told Dr. Fauci in an email.
“A more prudent approach that considers these issues would be to focus our efforts on those at high risk of severe disease and death, such as the elderly and obese, and do not push vaccination on the young and healthy any further.”
Employing that strategy would help prevent loss of public trust and political capital, Dr. Memoli said.
The email was sent on July 30, 2021, after Dr. Fauci, director of the NIAID, claimed that communities would be safer if more people received one of the COVID-19 vaccines and that mass vaccination would lead to the end of the COVID-19 pandemic.
“We’re on a really good track now to really crush this outbreak, and the more people we get vaccinated, the more assuredness that we’re going to have that we’re going to be able to do that,” Dr. Fauci said on CNN the month prior.
Dr. Memoli, who has studied influenza vaccination for years, disagreed, telling Dr. Fauci that research in the field has indicated yearly shots sometimes drive the evolution of influenza.
Vaccinating people who have not been infected with COVID-19, he said, could potentially impact the evolution of the virus that causes COVID-19 in unexpected ways.
“At best what we are doing with mandated mass vaccination does nothing and the variants emerge evading immunity anyway as they would have without the vaccine,” Dr. Memoli wrote. “At worst it drives evolution of the virus in a way that is different from nature and possibly detrimental, prolonging the pandemic or causing more morbidity and mortality than it should.”
The vaccination strategy was flawed because it relied on a single antigen, introducing immunity that only lasted for a certain period of time, Dr. Memoli said. When the immunity weakened, the virus was given an opportunity to evolve.
Some other experts, including virologist Geert Vanden Bossche, have offered similar views. Others in the scientific community, such as U.S. Centers for Disease Control and Prevention scientists, say vaccination prevents virus evolution, though the agency has acknowledged it doesn’t have records supporting its position.
Other Messages
Dr. Memoli sent the email to Dr. Fauci and two other top NIAID officials, Drs. Hugh Auchincloss and Clifford Lane. The message was first reported by the Wall Street Journal, though the publication did not publish the message. The Epoch Times obtained the email and 199 other pages of Dr. Memoli’s emails through a Freedom of Information Act request. There were no indications that Dr. Fauci ever responded to Dr. Memoli.
Later in 2021, the NIAID’s parent agency, the U.S. National Institutes of Health (NIH), and all other federal government agencies began requiring COVID-19 vaccination, under direction from President Joe Biden.
In other messages, Dr. Memoli said the mandates were unethical and that he was hopeful legal cases brought against the mandates would ultimately let people “make their own healthcare decisions.”
“I am certainly doing everything in my power to influence that,” he wrote on Nov. 2, 2021, to an unknown recipient. Dr. Memoli also disclosed that both he and his wife had applied for exemptions from the mandates imposed by the NIH and his wife’s employer. While her request had been granted, his had not as of yet, Dr. Memoli said. It’s not clear if it ever was.
According to Dr. Memoli, officials had not gone over the bioethics of the mandates. He wrote to the NIH’s Department of Bioethics, pointing out that the protection from the vaccines waned over time, that the shots can cause serious health issues such as myocarditis, or heart inflammation, and that vaccinated people were just as likely to spread COVID-19 as unvaccinated people.
He cited multiple studies in his emails, including one that found a resurgence of COVID-19 cases in a California health care system despite a high rate of vaccination and another that showed transmission rates were similar among the vaccinated and unvaccinated.
Dr. Memoli said he was “particularly interested in the bioethics of a mandate when the vaccine doesn’t have the ability to stop spread of the disease, which is the purpose of the mandate.”
The message led to Dr. Memoli speaking during an NIH event in December 2021, several weeks after he went public with his concerns about mandating vaccines.
“Vaccine mandates should be rare and considered only with a strong justification,” Dr. Memoli said in the debate. He suggested that the justification was not there for COVID-19 vaccines, given their fleeting effectiveness.
Julie Ledgerwood, another NIAID official who also spoke at the event, said that the vaccines were highly effective and that the side effects that had been detected were not significant. She did acknowledge that vaccinated people needed boosters after a period of time.
The NIH, and many other government agencies, removed their mandates in 2023 with the end of the COVID-19 public health emergency.
A request for comment from Dr. Fauci was not returned. Dr. Memoli told The Epoch Times in an email he was “happy to answer any questions you have” but that he needed clearance from the NIAID’s media office. That office then refused to give clearance.
Dr. Jay Bhattacharya, a professor of health policy at Stanford University, said that Dr. Memoli showed bravery when he warned Dr. Fauci against mandates.
“Those mandates have done more to demolish public trust in public health than any single action by public health officials in my professional career, including diminishing public trust in all vaccines.” Dr. Bhattacharya, a frequent critic of the U.S. response to COVID-19, told The Epoch Times via email. “It was risky for Dr. Memoli to speak publicly since he works at the NIH, and the culture of the NIH punishes those who cross powerful scientific bureaucrats like Dr. Fauci or his former boss, Dr. Francis Collins.”


Red Candle In The Wind


‘I couldn’t stand the pain’: the Turkish holiday resort that’s become an emergency dental centre for Britons who can’t get treated at home


Beloved mall retailer files Chapter 7 bankruptcy, will liquidate


Is the National Guard a solution to school violence?


Trump “Clearly Hasn’t Learned From His COVID-Era Mistakes”, RFK Jr. Says


CDC Warns Thousands Of Children Sent To ER After Taking Common Sleep Aid


Rand Paul Teases Senate GOP Leader Run – Musk Says “I Would Support”


The next pandemic? It’s already here for Earth’s wildlife


Mathematicians use AI to identify emerging COVID-19 variants


Vaccine-skeptical mothers say bad health care experiences made them distrust the medical system
-

 Uncategorized3 weeks ago
All Of The Elements Are In Place For An Economic Crisis Of Staggering Proportions
-

 Uncategorized3 weeks ago
California Counties Could Be Forced To Pay $300 Million To Cover COVID-Era Program
-

 International4 days ago
EyePoint poaches medical chief from Apellis; Sandoz CFO, longtime BioNTech exec to retire
-

 Uncategorized2 weeks ago
Apparel Retailer Express Moving Toward Bankruptcy
-

 Uncategorized4 weeks ago
Industrial Production Decreased 0.1% in January
-

 International3 days ago
Walmart launches clever answer to Target’s new membership program
-

 Uncategorized3 weeks ago
RFK Jr: The Wuhan Cover-Up & The Rise Of The Biowarfare-Industrial Complex
-

 Uncategorized3 weeks ago
GOP Efforts To Shore Up Election Security In Swing States Face Challenges