In light of Sleepy Joe’s swell new $1.9 trillion package of more free stuff, it’s time to get out our magnifying glasses again. The purpose is to compute the size of the hole in America’s collective paycheck that purportedly requires such continued, extraordinary beneficence from our not so rich Uncle Sam.
To repeat: There is no reason in the world why the February (pre-Covid) level of wage and salary disbursements is not a solid and appropriate benchmark for measuring the pocketbook hit from the Covid-Lockdowns that have wreaked havoc on the US economy since March. That is, from the point at which the evil Dr. Fauci convinced the Donald to pull the plug on MAGA and his own tenure in office, too (of course, 80-year old Dr. Fauci is still there, fixing to bamboozle yet another notionally “elected” president).
Still, back in February the Donald was boasting to one and all that he had delivered the greatest economy the world had ever seen and Wall Street apparently agreed, pushing stocks high into the nose-bleed section of history.
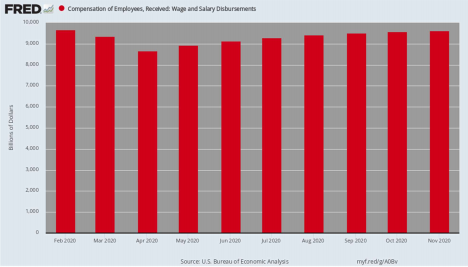
As it happened, the February run rate (annualized) of wage and salary disbursements was $9.659 trillion, which computes to about $805 billion per month. So we would suggest that if $805 billion of monthly wages was enough to justify celebration of the Greatest Economy Ever, then the shortfall from that benchmark is a solid measure of the hit to US worker earnings that has occurred since February.
Based on the red bars in the chart below and translated to actual monthly numbers, the Covid-wage and salary loss computes as follows:
March: -$25b;
April: -$76b;
May: -$61b;
June: -$43b;
July: -$31b;
August: -$19b;
September: -$12b;
October: -$6b;
November: -$3b;
December est: $0b;
10-month total: -$276b
The total of $276 billion of lost paychecks compares to $8.05 trillion of wages and salaries which would have been earned during that period at the February rate ($805 billion). So the cumulative shortfall through year-end amounted to just 3.4%.
More importantly, the $0-$6 billion monthly shortfall since September has been so small as to constitute a rounding error in the scheme of things, as suggested by the fact that American households spend far more—about $8 billion per month—-on pet food and pet care alone.
Yet Sleepy Joe has now teed up another $850 billion of direct aid to households, which in the aggregate are no longer suffering any material paycheck shortfall. And what is especially egregious about filling a non-existent income hole in this manner is that 53% of this amount goes to “stimmy” checks and child tax credits, which are essentially not even mean-tested except at the tippy-top of the income scale ($200,000 for a married couple):
Sleepy Joe’s $850 Billion of Direct Handouts to Households:
Stimmy checks and child tax credits: $450b;
Unemployment benefits: $200b;
Health insurance aid: $100b;
Rental assistance: $35b;
Child care aid: $40b
Safety net: $20b
Still, to paraphrase Walter Mondale’s famous campaign slogan from 1984: Another $850 billion for income replacement but “Where’s The Hole?”
Compensation of All US employees, Annualized Run Rate, February 2020- November 2020
Of course, there are other ways to measure the hit to the national economy stemming from the Covid-Lockdown impact, as we will amplify below. But first it would be well to summarize the “solution” that Washington’s fiscally incontinent politicians have heaved at the “problem” during the last 11 months—a “problem” that they have never bothered to quantify.
With the new Biden package, spending authorized by the five major Covid relief measures can be summarized as follows (billions):
Families First act: $192b;
CARES act: $2,200b;
Paycheck Protection Program: $733b;
Response and Relief Act: $935b;
Biden Jan. 14th plan: $1,900b;
Five package total: $5,960b.
That’s right. The Washington pols are fixing to heave nigh onto $6 trillion at a $274 billion hole in the nation’s wage bucket. That’s a solution 22X bigger than the putative problem!
Of course, we do not mean to dwell lightly on the “putative” part, nor embrace the notion that government owes citizens reparations for the damage its actions have caused.
Yes, the overwhelming share of the actual economic harm since March is due to the misguided (and unconstitutional) lockdown policies of the government and the vastly disproportionate and unwarranted public hysteria fanned by Dr. Fauci and the Virus Patrol, not the disease itself. But if the state gets into the business of fully indemnifying the public for the endless harm wrought by its policies, insolvency would be thereafter guaranteed, and in short order, too.
Besides, why does Washington have the right to burden future taxpayers with permanent debt service payments in order to make-whole a $276 billion loss of income and 3.4% inconvenience among taxpayers today?
And don’t stiff us with the humanitarian relief bit. The simple fact is that the overwhelming share of this $276 billion of wage losses has been visited upon low-wage and part-time workers in the social-congregation sectors of the economy (bars, restaurants, gyms, hotels, movies, ball parks etc.) that the Virus Patrol in its wisdom has shutdown. The right solution is to send the Virus Patrol packing and let these unfairly penalized employees go back to work.
Moreover, even if you want to plug that “hole” beyond what the in-place safety net is already providing (see below), well, then, tax the more affluent section of today’s citizenry to pay for it, not unknowing, unborn and voiceless future taxpayers.
Then again, the bipartisan duopoly is not about to give that fiscally honest approach the time of day; they specialize in the joint gang-mugging of voiceless future taxpayers.
Even if you think that the total wage and salary loss computed above understates the economic damage caused by the lockdowns, the massive fiscal overkill owing to the Everything Bailouts cannot be gainsaid.
For instance, GDP is the most comprehensive measure of economic activity that we have (despite its manifest flaws), but the loss of GDP after February has also been only about 3.6%. In fact, based on the Atlanta Fed’s GDPNow forecast, we project that nominal GDP during Q4 will post at about $21.650 trillion, a figure only 0.46% below the Greatest Economy Ever level of Q4 2019.
So, again, if we assume that Q4 2019 is a reasonable pre-Covid benchmark for the level of total economic activity in the USA, we get the following shortfall, including an estimate for Q4 based on the Atlanta Fed’s latest outlook.
Quarterly GDP Change From Q42019 Benchmark:
Q1 2020: -$47b;
Q2 2020: -$559b;
Q3 2020: -$144b;
Q4 2020E: -$25b;
4-quarter total: -$775b
So even if you want to count everything including losses from the $2.5 trillion of imputed activity in the GDP, the pending $6 trillion of Everything Bailouts is 7.7X the size of the problem!
Quarterly GDP At Annual Rates
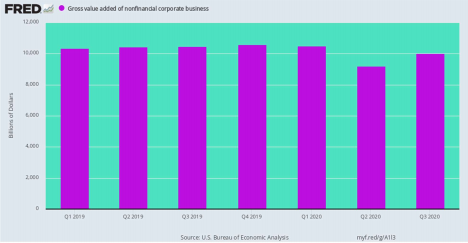
Of course, the real point of the bailouts is to compensate the private sector for the economic harm done by the government in its exertions in furtherance of the public health. But when you look at the impact of the Covid-Lockdowns on value-added of the non-financial business sector, the hit compared to pre-Covid levels is also quite small.
Again, using Q4 2019 as the pre-Covid benchmark and actual results through Q3 2020 and the Atlanta Fed estimates for Q4, the loss in business output relative to Q4 2019 is just $594 billion or 2.7% of total GDP. So by this measure of the “problem”, the impending Everything Bailouts would amount to 10X the size of the hole in the bucket.
Likewise, our Atlanta Fed-based estimate of Q4 nonfinancial business value added of $10.251 stands at fully 99.1% of the Q1 2019 level. That’s hardly a setback that warrants burying future taxpayers in $6 trillion of new debt, and most especially not the $1.9 trillion part recommended by our day-late-and-dollar short incoming POTUS, who has just emerged from his Delaware bunker.
Quarterly Change In Business Value-Added Versus Q4 2019 Benchmark:
Q1 2020: -$23b;
Q2 2020: -$347b;
Q3 2020: -$142b;
Q4 2020E: -$82b;
4-Quarter total: -$594b
Quarterly Nonfinancial Business Sector Gross Value Added (Annualized):
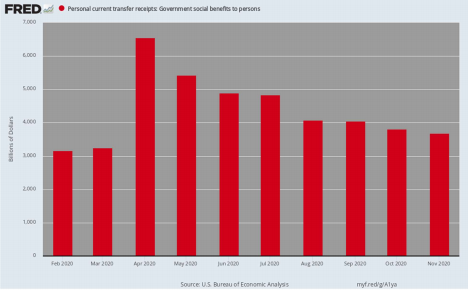
By contrast, it is well worth looking at the other side of the coin: Namely, the surge in transfer payments since last February stemming from a combination of the built-in safety net (principally unemployment insurance, foods stamps and Medicaid) and disbursements of stimmy checks, enhanced Federal UI benefits and the rest authorized by the Everything Bailouts.
At the pre-Covid level in February, total government transfer payments (including state and local) were running at a $3.165 trillion annual rate or about $265 billion per month. As shown in the chart below, however, that monthly figure skyrocketed by 107% to $546 billion in the month of April alone.
And, no, that latter figures is not the annualized rate: In their infinite generosity, government programs pumped more than one-half trillion dollars into the household sector during April alone. That’s $18.2 billion per day!
Thereafter, the tsunami of transfer payments began to abate, but were still running at a $400 billion monthly level in July and $306 billion level in November. Overall, the 10- month total of incremental transfer payments above the February level totaled $1.05 trillion.
You can’t make this up. Transfer payments to households during the past 10 months have exceeded the loss of household wages and salaries ($276 billion) by nearly four times.
So the question recurs: Why does Sleepy Joe think we need another $850 billion of transfer payments to households on top of the immense generosity already dispensed per the chart below?
The answer is simple: He’s doing it because he can—because the nation-wreckers in the Eccles Building have determined to purchase $120 billion of government debt and GSE securities per month for the indefinite future. As JayPo rattled on at his presser this week, they are not even thinking about thinking about tapering this tsunami of fake money plucked from thin air by the Fed’s digital printing presses.
Accordingly, under this crooked regime of massive debt monetization, there is no here and now economic sting to rampant Federal borrowing; no “crowding-out” as in times of yore before the Fed went off the deep-end with Keynesian money-pumping; and no
surging interest rates to rouse Wall Street and the business community from their happy slumber in the lap of ultra-cheap borrowing costs.
Stated differently, when it comes to the rampant fiscal incontinence in the Imperial City enabled by the Fed, did the election outcome make any difference?
It did not. Sleepy Joe is about to give the once and former King of Debt a run for his money when it comes to the annals of fiscal infamy in America.
Total Government Transfer Payments, Annualized
Even if you set-aside things like increased Medicaid and food stamp spending embedded in the above figures for total government transfer payments and focus just on the change in Federal-state unemployment insurance disbursements since February, the sheer fiscal madness at loose on Capitol Hill is baldly evident.
To wit, prior to the Covid-Lockdown battering of the US economy, which has so far caused the filing of an incredible 70 million in new unemployment benefit claims, the Federal-state unemployment systems was pumping out benefit payments at a $27.8 billion annual rate in February or about $2.3 billion per month.
Here is the subsequent increase in UI payments from both existing state programs and the Federal pandemic assistance benefits and $600 per month topper payments. They total $518 billion or nearly two-times the $276 billion cumulative loss of wages and salaries during the same 10-month period.
Moreover, the alacrity with which the system poured money into the ranks of unemployment claimants is a wonder to behold. By April the February payment level of $2.3 billion had soared to $41 billion, per month and by July the figure came in at an astounding $117 billion per month.
That’s right. At the June peak rate of $117 billion per month ($1.4 trillion annualized per the chart below), the monthly payment rate was 51X higher than it had been in February, and exceeded the full year UI payout rate during the depths of the Great Recession.
Monthly UI Payments Annualized
But consider this: If the Federal-State unemployment system was already overcompensating for actual lost wages and salaries by 2X, why did we need to send helicopter checks, or what Washington now fondly calls “stimmy checks”, to 155 million households on top of that, when most of these households had not lost their jobs or paychecks?
Nevertheless, here is the “stimmy check” and related non-means tested money in the five Everything Bailouts including Sleepy Joe’s new edition to the Fiscal Demolition Derby:
Non-Means-Tested Stimmy Funding:
Families First act: $105b;
CARES act: $315b;
Response & Relief Act: $191b;
Biden Jan. 14th plan: $625b;
Total non-means tested stimmy: $1.235 trillion.
In short, the wage loss hole in the bucket was already filled two-times over by the increase in UI benefit payments since February, but this massive drop of cash on the American public will have filled it again by another 4.5X.
As we said, free lunches for one and all……except, except the debt is never going away and future generations will surely rue the day.
Mathematicians use AI to identify emerging COVID-19 variants
Scientists at The Universities of Manchester and Oxford have developed an AI framework that can identify and track new and concerning COVID-19 variants…
Scientists at The Universities of Manchester and Oxford have developed an AI framework that can identify and track new and concerning COVID-19 variants and could help with other infections in the future.
Scientists at The Universities of Manchester and Oxford have developed an AI framework that can identify and track new and concerning COVID-19 variants and could help with other infections in the future.
The framework combines dimension reduction techniques and a new explainable clustering algorithm called CLASSIX, developed by mathematicians at The University of Manchester. This enables the quick identification of groups of viral genomes that might present a risk in the future from huge volumes of data.
The study, presented this week in the journal PNAS, could support traditional methods of tracking viral evolution, such as phylogenetic analysis, which currently require extensive manual curation.
Roberto Cahuantzi, a researcher at The University of Manchester and first and corresponding author of the paper, said: “Since the emergence of COVID-19, we have seen multiple waves of new variants, heightened transmissibility, evasion of immune responses, and increased severity of illness.
“Scientists are now intensifying efforts to pinpoint these worrying new variants, such as alpha, delta and omicron, at the earliest stages of their emergence. If we can find a way to do this quickly and efficiently, it will enable us to be more proactive in our response, such as tailored vaccine development and may even enable us to eliminate the variants before they become established.”
Like many other RNA viruses, COVID-19 has a high mutation rate and short time between generations meaning it evolves extremely rapidly. This means identifying new strains that are likely to be problematic in the future requires considerable effort.
Currently, there are almost 16 million sequences available on the GISAID database (the Global Initiative on Sharing All Influenza Data), which provides access to genomic data of influenza viruses.
Mapping the evolution and history of all COVID-19 genomes from this data is currently done using extremely large amounts of computer and human time.
The described method allows automation of such tasks. The researchers processed 5.7 million high-coverage sequences in only one to two days on a standard modern laptop; this would not be possible for existing methods, putting identification of concerning pathogen strains in the hands of more researchers due to reduced resource needs.
Thomas House, Professor of Mathematical Sciences at The University of Manchester, said: “The unprecedented amount of genetic data generated during the pandemic demands improvements to our methods to analyse it thoroughly. The data is continuing to grow rapidly but without showing a benefit to curating this data, there is a risk that it will be removed or deleted.
“We know that human expert time is limited, so our approach should not replace the work of humans all together but work alongside them to enable the job to be done much quicker and free our experts for other vital developments.”
The proposed method works by breaking down genetic sequences of the COVID-19 virus into smaller “words” (called 3-mers) represented as numbers by counting them. Then, it groups similar sequences together based on their word patterns using machine learning techniques.
Stefan Güttel, Professor of Applied Mathematics at the University of Manchester, said: “The clustering algorithm CLASSIX we developed is much less computationally demanding than traditional methods and is fully explainable, meaning that it provides textual and visual explanations of the computed clusters.”
Roberto Cahuantzi added: “Our analysis serves as a proof of concept, demonstrating the potential use of machine learning methods as an alert tool for the early discovery of emerging major variants without relying on the need to generate phylogenies.
“Whilst phylogenetics remains the ‘gold standard’ for understanding the viral ancestry, these machine learning methods can accommodate several orders of magnitude more sequences than the current phylogenetic methods and at a low computational cost.”
Journal
Proceedings of the National Academy of Sciences
DOI
10.1073/pnas.2317284121
Article Title
Unsupervised identification of significant lineages of SARS-CoV-2 through scalable machine learning methods
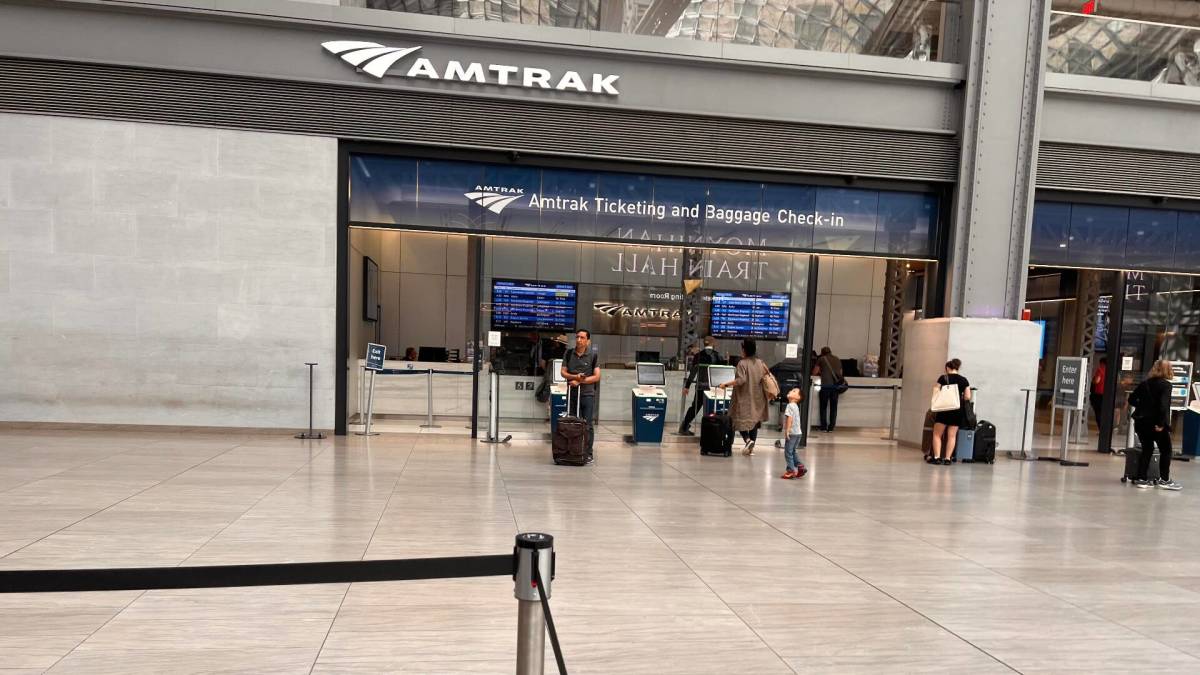
While the size of the United States makes it hard for it to compete with the inter-city train access available in places like Japan and many European countries, Amtrak trains are a very popular transportation option in certain pockets of the country — so much so that the country’s national railway company is expanding its Northeast Corridor by more than one million seats.
Running from Boston all the way south to Washington, D.C., the route is one of the most popular as it passes through the most densely populated part of the country and serves as a commuter train for those who need to go between East Coast cities such as New York and Philadelphia for business.
Veronika Bondarenko captured this photo of New York’s Moynihan Train Hall.
Veronika Bondarenko
Amtrak launches new routes, promises travelers ‘additional travel options’
Earlier this month, Amtrak announced that it was adding four additional Northeastern routes to its schedule — two more routes between New York’s Penn Station and Union Station in Washington, D.C. on the weekend, a new early-morning weekday route between New York and Philadelphia’s William H. Gray III 30th Street Station and a weekend route between Philadelphia and Boston’s South Station.
According to Amtrak, these additions will increase Northeast Corridor’s service by 20% on the weekdays and 10% on the weekends for a total of one million additional seats when counted by how many will ride the corridor over the year.
“More people are taking the train than ever before and we’re proud to offer our customers additional travel options when they ride with us on the Northeast Regional,” Amtrak Executive Vice President and Chief Commercial Officer Eliot Hamlisch said in a statement on the new routes. “The Northeast Regional gets you where you want to go comfortably, conveniently and sustainably as you breeze past traffic on I-95 for a more enjoyable travel experience.”
Here are some of the other Amtrak changes you can expect to see
Amtrak also said that, in the 2023 financial year, the Northeast Corridor had nearly 9.2 million riders — 8% more than it had pre-pandemic and a 29% increase from 2022. The higher demand, particularly during both off-peak hours and the time when many business travelers use to get to work, is pushing Amtrak to invest into this corridor in particular.
To reach more customers, Amtrak has also made several changes to both its routes and pricing system. In the fall of 2023, it introduced a type of new “Night Owl Fare” — if traveling during very late or very early hours, one can go between cities like New York and Philadelphia or Philadelphia and Washington. D.C. for $5 to $15.
As travel on the same routes during peak hours can reach as much as $300, this was a deliberate move to reach those who have the flexibility of time and might have otherwise preferred more affordable methods of transportation such as the bus. After seeing strong uptake, Amtrak added this type of fare to more Boston routes.
The largest distances, such as the ones between Boston and New York or New York and Washington, are available at the lowest rate for $20.
I am a conservation biologist who studies emerging infectious diseases. When people ask me what I think the next pandemic will be I often say that we are in the midst of one – it’s just afflicting a great many species more than ours.
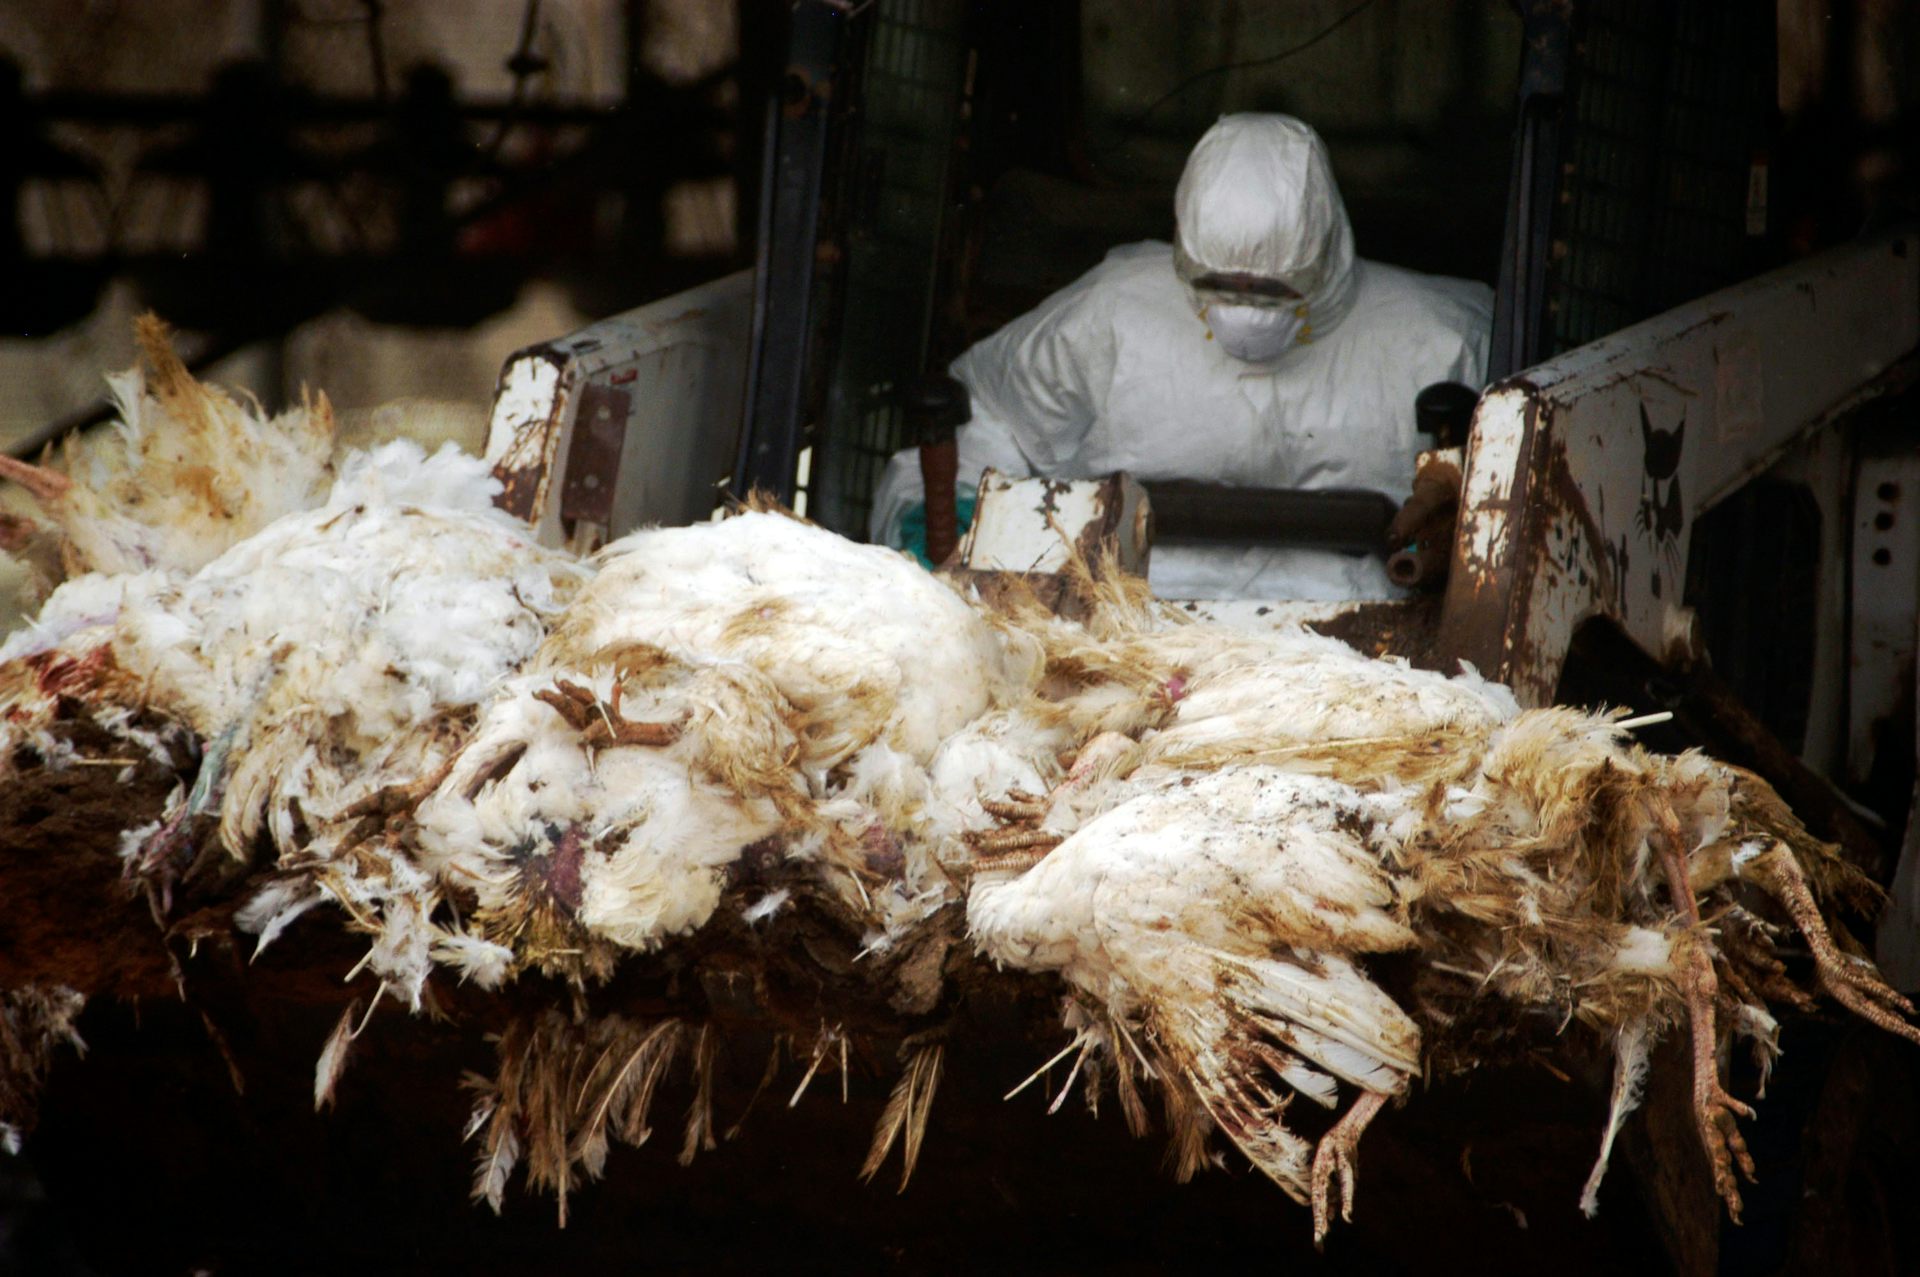
I am referring to the highly pathogenic strain of avian influenza H5N1 (HPAI H5N1), otherwise known as bird flu, which has killed millions of birds and unknown numbers of mammals, particularly during the past three years.
This is the strain that emerged in domestic geese in China in 1997 and quickly jumped to humans in south-east Asia with a mortality rate of around 40-50%. My research group encountered the virus when it killed a mammal, an endangered Owston’s palm civet, in a captive breeding programme in Cuc Phuong National Park Vietnam in 2005.
How these animals caught bird flu was never confirmed. Their diet is mainly earthworms, so they had not been infected by eating diseased poultry like many captive tigers in the region.
This discovery prompted us to collate all confirmed reports of fatal infection with bird flu to assess just how broad a threat to wildlife this virus might pose.
This is how a newly discovered virus in Chinese poultry came to threaten so much of the world’s biodiversity.
Until December 2005, most confirmed infections had been found in a few zoos and rescue centres in Thailand and Cambodia. Our analysis in 2006 showed that nearly half (48%) of all the different groups of birds (known to taxonomists as “orders”) contained a species in which a fatal infection of bird flu had been reported. These 13 orders comprised 84% of all bird species.
We reasoned 20 years ago that the strains of H5N1 circulating were probably highly pathogenic to all bird orders. We also showed that the list of confirmed infected species included those that were globally threatened and that important habitats, such as Vietnam’s Mekong delta, lay close to reported poultry outbreaks.
Mammals known to be susceptible to bird flu during the early 2000s included primates, rodents, pigs and rabbits. Large carnivores such as Bengal tigers and clouded leopards were reported to have been killed, as well as domestic cats.
Our 2006 paper showed the ease with which this virus crossed species barriers and suggested it might one day produce a pandemic-scale threat to global biodiversity.
In the past couple of years, bird flu has spread rapidly across Europe and infiltrated North and South America, killing millions of poultry and a variety of bird and mammal species. A recent paper found that 26 countries have reported at least 48 mammal species that have died from the virus since 2020, when the latest increase in reported infections started.
Not even the ocean is safe. Since 2020, 13 species of aquatic mammal have succumbed, including American sea lions, porpoises and dolphins, often dying in their thousands in South America. A wide range of scavenging and predatory mammals that live on land are now also confirmed to be susceptible, including mountain lions, lynx, brown, black and polar bears.
The UK alone has lost over 75% of its great skuas and seen a 25% decline in northern gannets. Recent declines in sandwich terns (35%) and common terns (42%) were also largely driven by the virus.
Scientists haven’t managed to completely sequence the virus in all affected species. Research and continuous surveillance could tell us how adaptable it ultimately becomes, and whether it can jump to even more species. We know it can already infect humans – one or more genetic mutations may make it more infectious.
At the crossroads
Between January 1 2003 and December 21 2023, 882 cases of human infection with the H5N1 virus were reported from 23 countries, of which 461 (52%) were fatal.
Of these fatal cases, more than half were in Vietnam, China, Cambodia and Laos. Poultry-to-human infections were first recorded in Cambodia in December 2003. Intermittent cases were reported until 2014, followed by a gap until 2023, yielding 41 deaths from 64 cases. The subtype of H5N1 virus responsible has been detected in poultry in Cambodia since 2014. In the early 2000s, the H5N1 virus circulating had a high human mortality rate, so it is worrying that we are now starting to see people dying after contact with poultry again.
It’s not just H5 subtypes of bird flu that concern humans. The H10N1 virus was originally isolated from wild birds in South Korea, but has also been reported in samples from China and Mongolia.
Recent research found that these particular virus subtypes may be able to jump to humans after they were found to be pathogenic in laboratory mice and ferrets. The first person who was confirmed to be infected with H10N5 died in China on January 27 2024, but this patient was also suffering from seasonal flu (H3N2). They had been exposed to live poultry which also tested positive for H10N5.
Species already threatened with extinction are among those which have died due to bird flu in the past three years. The first deaths from the virus in mainland Antarctica have just been confirmed in skuas, highlighting a looming threat to penguin colonies whose eggs and chicks skuas prey on. Humboldt penguins have already been killed by the virus in Chile.
How can we stem this tsunami of H5N1 and other avian influenzas? Completely overhaul poultry production on a global scale. Make farms self-sufficient in rearing eggs and chicks instead of exporting them internationally. The trend towards megafarms containing over a million birds must be stopped in its tracks.
To prevent the worst outcomes for this virus, we must revisit its primary source: the incubator of intensive poultry farms.
Diana Bell does not work for, consult, own shares in or receive funding from any company or organisation that would benefit from this article, and has disclosed no relevant affiliations beyond their academic appointment.
We use cookies on our website to give you the most relevant experience by remembering your preferences and repeat visits. By clicking “Accept”, you consent to the use of ALL the cookies.
This website uses cookies to improve your experience while you navigate through the website. Out of these, the cookies that are categorized as necessary are stored on your browser as they are essential for the working of basic functionalities of the website. We also use third-party cookies that help us analyze and understand how you use this website. These cookies will be stored in your browser only with your consent. You also have the option to opt-out of these cookies. But opting out of some of these cookies may affect your browsing experience.
Necessary cookies are absolutely essential for the website to function properly. These cookies ensure basic functionalities and security features of the website, anonymously.
Cookie
Duration
Description
cookielawinfo-checbox-analytics
11 months
This cookie is set by GDPR Cookie Consent plugin. The cookie is used to store the user consent for the cookies in the category "Analytics".
cookielawinfo-checbox-functional
11 months
The cookie is set by GDPR cookie consent to record the user consent for the cookies in the category "Functional".
cookielawinfo-checbox-others
11 months
This cookie is set by GDPR Cookie Consent plugin. The cookie is used to store the user consent for the cookies in the category "Other.
cookielawinfo-checkbox-necessary
11 months
This cookie is set by GDPR Cookie Consent plugin. The cookies is used to store the user consent for the cookies in the category "Necessary".
cookielawinfo-checkbox-performance
11 months
This cookie is set by GDPR Cookie Consent plugin. The cookie is used to store the user consent for the cookies in the category "Performance".
viewed_cookie_policy
11 months
The cookie is set by the GDPR Cookie Consent plugin and is used to store whether or not user has consented to the use of cookies. It does not store any personal data.
Functional cookies help to perform certain functionalities like sharing the content of the website on social media platforms, collect feedbacks, and other third-party features.
Performance cookies are used to understand and analyze the key performance indexes of the website which helps in delivering a better user experience for the visitors.
Analytical cookies are used to understand how visitors interact with the website. These cookies help provide information on metrics the number of visitors, bounce rate, traffic source, etc.
Advertisement cookies are used to provide visitors with relevant ads and marketing campaigns. These cookies track visitors across websites and collect information to provide customized ads.