Steve Keen: This Ain’t Your Daddy’s Inflation – Part 1
Steve Keen: This Ain’t Your Daddy’s Inflation – Part 1
Authored by Steve Kenn via The Epoch Times,
After a long period of being low and…
Share this:

Authored by Steve Kenn via The Epoch Times,
After a long period of being low and even negative, inflation is now higher than it has been in almost 40 years. Though still well short of the twin peaks of 1975 and 1980, it is the fifth-highest rate recorded since the end of WWII, and it is still rising.
But it ain’t your Daddy’s inflation: what’s driving it is very different to what drove the inflation of the 1970s. Unfortunately, the 1970s experience changed economic theory for the worse, and that theory will guide how the Federal Reserve tries to tackle today’s inflation. It won’t end well. To explain why, I need to use a lot of figures (and a lot of words), so brace yourself.
Figure 1 shows the entire history of post-World War II inflation in the USA. There were four major peaks before today’s spike, with the first two driven by Wars (the end of WWII and its price controls, and the boom in commodity prices during the Korean War). The second two, in 1975 and 1980, created modern economic theory, because they appeared to overthrow the “Keynesian” argument that fiscal policy could control both inflation and unemployment.
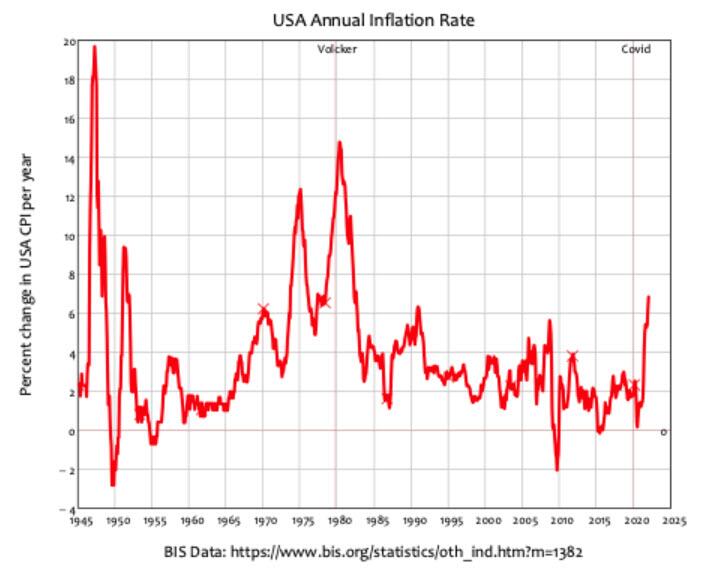
Figure 1: Chart showing annual change in the USA consumer price index since 1960. (Steve Keen)
“Keynesians” asserted that there was a tradeoff between inflation and unemployment: unemployment could be lowered by expansionary fiscal policy, but at the price of a higher rate of inflation. The “Keynesian” belief was that there was a negative relationship between inflation and unemployment: if inflation went up, then unemployment would go down. This was called the “Phillips Curve,” after the New Zealand engineer-turned-economist Bill Phillips, who wrote a famous empirical paper on inflation and unemployment called “The Relation between Unemployment and the Rate of Change of Money Wage Rates in the United Kingdom, 1861–1957”.
The killer blow to “Keynesian” economics was the coincidence of rising inflation and rising unemployment between late 1973 and 1975. This was dubbed stagflation, and because this was impossible according to “Keynesian” theory, Milton Friedman’s Monetarism won an intellectual battle within economics, and supplanted “Keynesianism.”
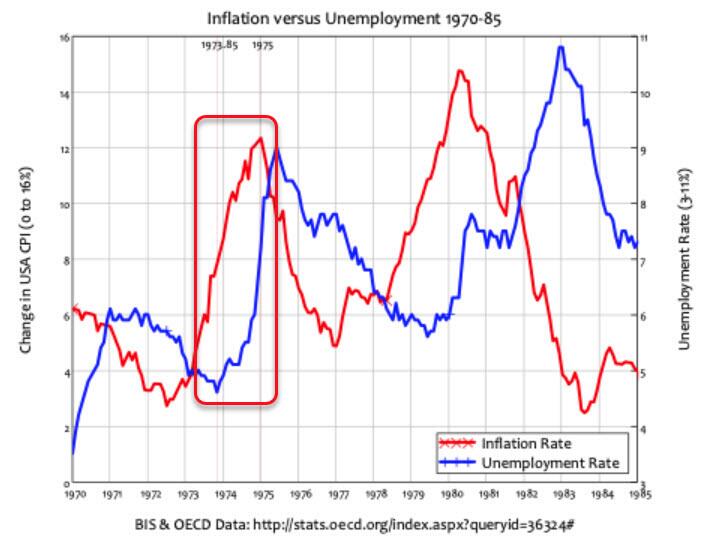
Figure 2: Chart showing rising unemployment and inflation between 1973 and 1975. (Steve Keen)
Are you sick of the inverted commas around “Keynesian” yet? Good. They’re there to make the point that this wasn’t Keynes’s theory at all, but rather how it was caricatured by the anti-Keynesian economist Milton Friedman. Trusting Friedman’s explanation of Keynesian economics is like trusting the fox’s account of why the chickens in the henhouse died.
The true inheritor of Keynes’s mantle was the renegade economist Hyman Minsky (who was the chief inspiration for my work), and he argued that credit was the main factor behind the economy’s ups and downs. When people and firms are borrowing heavily, the economy will boom, and when they borrow less or repay debt, the economy slumps. The important link, in Minsky’s genuinely Keynesian economics, is between credit and unemployment, not between inflation and unemployment.
That’s obvious in the data: when credit (the annual change in private debt) is rising, unemployment falls; when credit is falling, unemployment rises. The real cause of the “stag” half of stagflation was the decline in demand as credit collapsed from 12 percent to 6 percent of GDP between September 1973 and 1976.
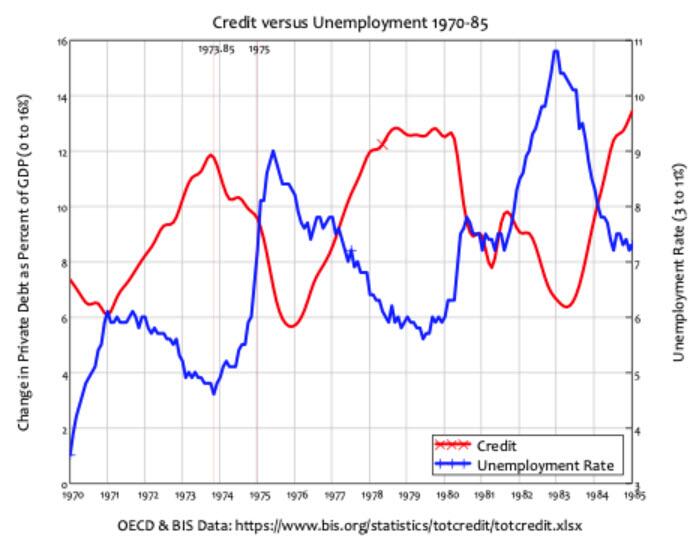
Figure 3: Chart showing the inverse relationship between credit (the change in private debt) and unemployment. (Steve Keen)
The “flation” bit came from two unrelated factors:
-
the booming economy that preceded the crash of 1973, as credit doubled from 6 percent to 12 percent of GDP between 1971 and September 1973;
-
and the Yom Kippur War, which occurred in October 1973.
It may be hard to believe from today’s perspective, but workers had both strong trade unions and substantial bargaining power in the 1960s. Unemployment fell below 4 percent in 1966 and remained there until early 1971. It rose substantially—from 3.5 percent in 1970 to 6 percent in 1971—but fell down to a low of 4 ¾ percent in late 1973, just after the credit bubble started to burst. Workers and unions had no way of knowing in advance that this was the end of the good times—unemployment did not fall below 4 percent again until a few months in 2000, and then again before and after the COVID-19 recession—so they continued to bargain for high wage rises, which employers passed on to consumers in price rises.

Figure 4: Chart showing the annual change in nominal and inflation-adjusted wage rates. (Steve Keen)
A second factor, which had never happened before, caused price rises well above the rate of wage growth: rising oil prices. Before 1973, oil prices were largely set by Big Oil: the western-owned oil companies that dominated oil drilling around the world, including in Arabian countries. They paid the oil-producing countries a pittance in royalties, and prices were low and stable—as is vividly obvious in Figure 5, where the price is a flat line between 1950 and 1973. The resentment at being paid low prices for their vital commodity motivated oil-producing countries to form OPEC (the Organization of Petroleum Exporting Countries) in 1960.
After the defeat of the Arab armies in the Yom Kippur War, OPEC launched an embargo on oil exports to the USA, which caused the oil price to increase by 250 percent, from $4.30 to $10 a barrel, in just one month.

Figure 5: Chart showing the nominal price of West Texas Crude Oil. (Steve Keen)
The coincidence of rising prices and rising unemployment therefore does have a Keynesian explanation, and the capacity for private banks to create money and additional demand by making loans plays a crucial part in it. But this wasn’t part of Friedman’s thinking at all. To him, the government was the only creator of money in the economy, and—to caricature Friedman, though more accurately than he caricatured Keynes—inflation was caused by “too much money creating too few goods.”
Friedman argued that the economy had a tendency towards what he dubbed the Non-Accelerating-Inflation-Rate-of-Unemployment—or NAIRU for short. This was set by “real” factors—people’s willingness to undergo the disutility of work, in order to receive the utility of income (in the form of either wages or profits), where this utility was measured in their physical level of consumption and not money.
A rising money supply could, however, stimulate more work, by temporarily fooling people into believing that real demand was higher than it really was: if the amount of money rose faster than the economy grew, people would initially mistake this for a higher rate of real growth in demand. Friedman then used the idea of a short-term negative relationship between unemployment and inflation to assert that this lower level of unemployment would cause a higher level of inflation.
The higher inflation would then reduce real incomes to where they were before the excessive increase in the money supply occurred. People would then come to expect this higher level of inflation to persist, while the economy settled back into its full-employment equilibrium.
Therefore, the long run effect of trying to stimulate the economy by increasing the money supply would be to increase people’s “inflationary expectations,” while leaving the level of economic activity constant at its long run equilibrium level. If the government wanted to drive the unemployment rate below the natural rate, it would have to increase the money supply even faster: hence trying to keep the unemployment rate below the natural rate required an increasing rate of growth in the money supply, and caused not merely a higher rate of inflation, but an accelerating rate of inflation.
This meant that what Friedman dubbed the Long Run Phillips Curve was vertical: the relationship between unemployment and the rate of inflation was a vertical line. The only desirable point on this curve from a social welfare point of view was where inflation was zero: this was the “Non-Accelerating-Inflation-Rate-of-Unemployment.”
So where does that leave us?
-
Hyman Minsky’s explanation of what caused the stagflation of the 1970s - a credit bubble bursting when the economy was absolutely at its peak caused the stagnation, while high wage and oil price rises caused the inflation.
-
And the essence of Milton Friedman’s very different explanation: that it was due to the government trying to push the unemployment rate below the natural rate by increasing the money supply too quickly.
I’ll go into Friedman’s argument in more detail below, not for its historical interest, but because an essential part of it—the concept of “inflationary expectations”—still plays a major role in how Central Banks think they can control the economy.
One key belief of Friedman’s was that the economy had a natural rate of unemployment, to which it would return after any shock. Another was people held money primarily to make transactions, so that the cash people held was proportional to the level of output.
If we identify the money in our hypothetical society with currency in the real world, then the quantity of currency the public chooses to hold is equal in value to about one-tenth of a year’s income, or about 5.2 weeks’ income. That is, the desired velocity is about ten per year.
Friedman treated the velocity of money as a constant, so if the amount of money rose, then so would the level of transactions. He imagined an economy with a constant population, and no technological progress, in which there were 1,000 $1 bills:
All money consists of strict fiat money, i.e., pieces of paper, each labeled “This is one dollar.” To begin with, there are a fixed number of pieces of paper, say, 1,000.
Given the 10 to 1 ratio between the money stock of $1,000, and the level of economic activity, this meant that, in equilibrium, GDP would be $10,000 per year. Then Friedman imagined an event that would disturb this equilibrium. Have you heard the phrase “helicopter money?” It made its first appearance in this paper: The Optimum Quantity of Money by Milton Friedman.
Let us suppose now that one day a helicopter flies over this community and drops an additional $1,000 in bills from the sky, which is, of course, hastily collected by members of the community.
This would increase the amount of money people held from 1/10th of a year’s income to 1/5th. Since people were now holding twice as much money as they wanted, they would attempt to get rid of the excess by spending more. This could cause a temporary increase in real activity as people interpreted the increase in money demand as an increase in real demand, but ultimately the economy would settle back into its long-run equilibrium. Prices would double, but there would be no change in real output or employment.
Friedman extrapolated this to a continuous increase in the money supply by imagining a continuous stream of helicopters.
Let us now complicate our example by supposing that the dropping of money, instead of being a unique, miraculous event, becomes a continuous process, which, perhaps after a lag, becomes fully anticipated by everyone. Money rains down from heaven at a rate which produces a steady increase in the quantity of per cent per year money, let us say, of 10 percent per year.
Friedman reasoned that this would result in prices rising at 10 per cent per year. The economy would be in long run equilibrium, with supply equal to demand in every market, but with rising prices—because of “inflationary expectations.” This was a crucial part of Friedman’s argument: prices weren’t rising because of demand exceeding supply, but because of inflationary expectations.
One natural question to ask about this final situation is, “What raises the price level, if at all points markets are cleared and real magnitudes are stable?” The answer is, “Because everyone confidently anticipates that prices will rise.”
In our example, prices rise, though markets are continuously cleared, because everybody knows that they will. All demand and supply curves in nominal terms rise at the rate of 10 percent per year, and so do the market-clearing prices.
The key to getting inflation down was therefore to reduce “inflationary expectations.” Inflation was occurring simply because people expected it, and put their prices up by that much every year—both the prices they charged for their own services, and the prices they were willing to pay for others.
That could be done simply by reversing the previous policy: reduce the rate of growth of the money supply. This would initially cause a small recession, but once people realized that only nominal—rather than real—demand had fallen, the economy would converge back to the equilibrium rate of growth with a lower level of inflationary expectations. Relatively painlessly, the economy could be restored to a low inflation environment.
This is the policy that Federal Reserve Chairman Paul Volcker put into motion in 1979. He put up the Federal Funds Rate to 20 percent in an attempt (to quote Volcker from the Fed’s minutes in his first meeting as chairman) to reduce inflationary expectations (pdf).
I do believe that we have to give some attention to whether we have the capability, within the narrow limits perhaps in which we can operate, of turning expectations and sentiment. I am thinking particularly on the inflationary side. [Can we] restore the feeling that inflation will decline over a period of time and that that’s a prime objective of ours?
Volcker’s actions did cause the rate of inflation to fall. However, this was not via a relatively painless fall in “inflationary expectations,” but by a savage recession, the deepest the USA had experienced since the Great Depression. Inflation fell from 15 percent at its peak to below 2 percent by 1987, but unemployment rose just as sharply, from under 6 percent when Volcker started to increase interest rates to almost 11 percent when inflation had fallen to just above 2 percent.
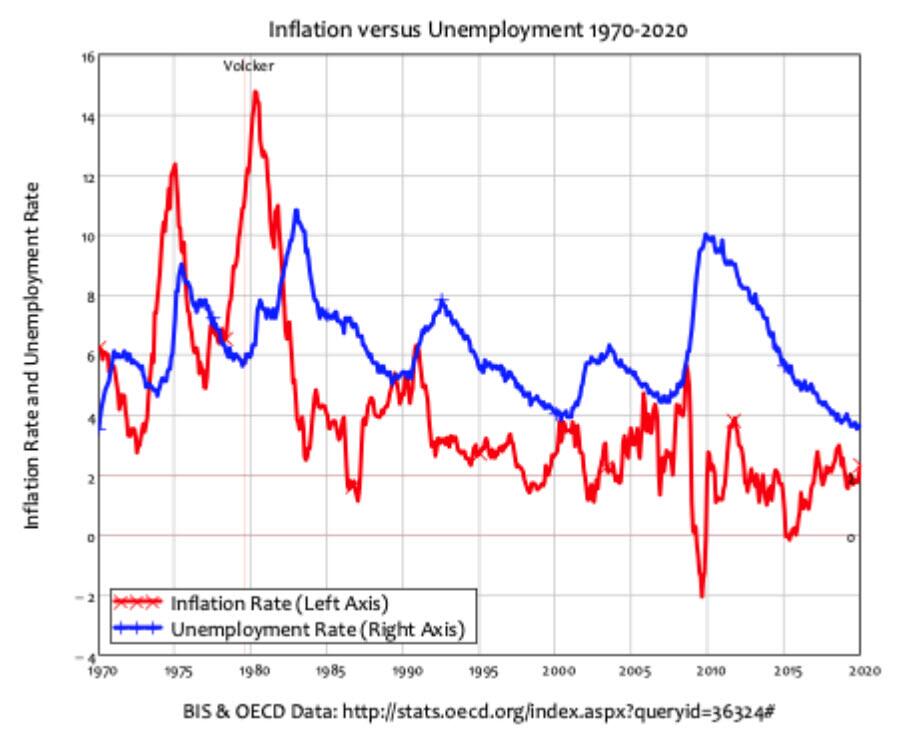
Figure 6: Chart comparing inflation to unemployment for the 50 years before COVID. (Steve Keen)
The economic collapse took the wind out of both wage rises, and the price of oil. Wage rises, which peaked at 11 percent per year in 1981, fell to 4 percent per year in 1983. Oil prices, which had risen from $15 to $40 a barrel in 1980, fell gradually to $30 in 1985 and then plunged to just $12 a barrel in 1986. In addition, the negative relationship between unemployment and inflation—the disappearance of which between 1973 and 1975 had played such a large role in getting Friedman’s theory accepted—was back.
To be continued...
International
Copper Soars, Iron Ore Tumbles As Goldman Says “Copper’s Time Is Now”
Copper Soars, Iron Ore Tumbles As Goldman Says "Copper’s Time Is Now"
After languishing for the past two years in a tight range despite recurring…
Share this:

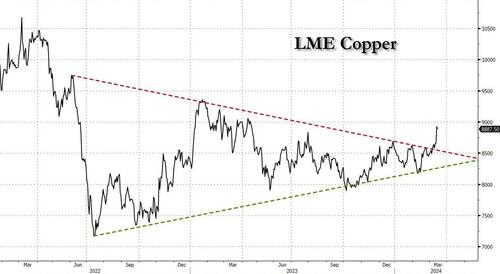
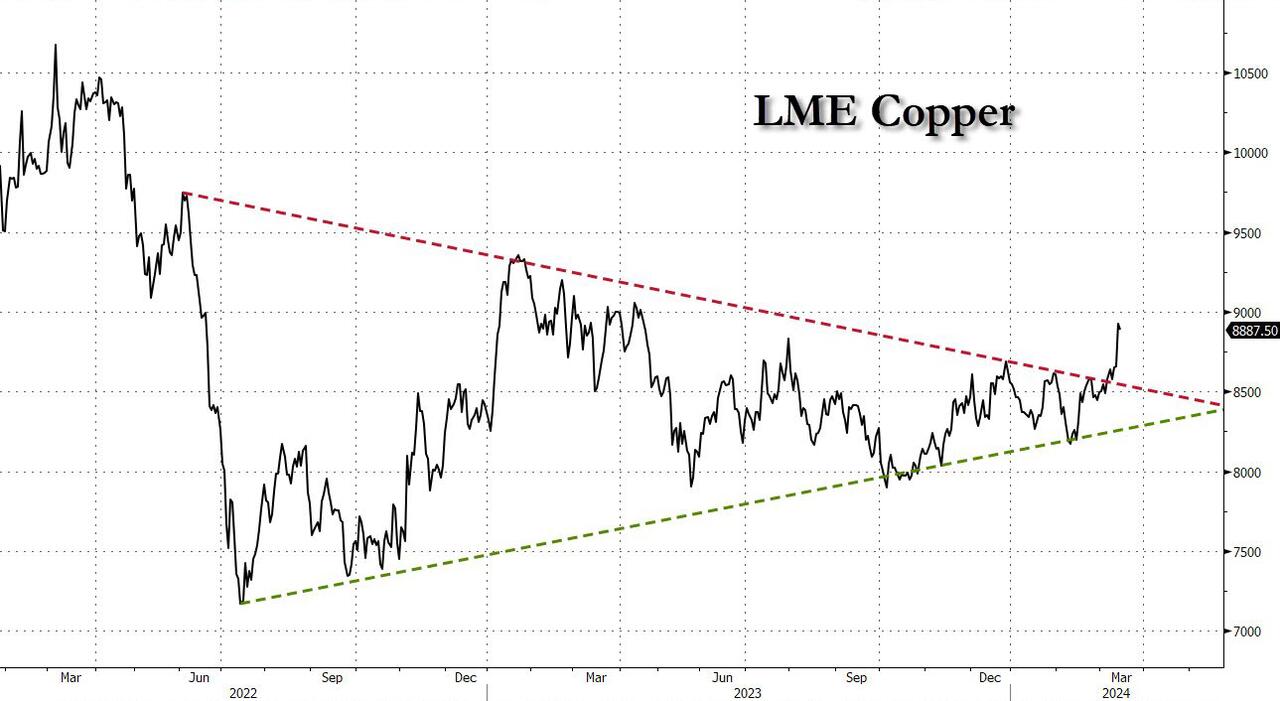
After languishing for the past two years in a tight range despite recurring speculation about declining global supply, copper has finally broken out, surging to the highest price in the past year, just shy of $9,000 a ton as supply cuts hit the market; At the same time the price of the world's "other" most important mined commodity has diverged, as iron ore has tumbled amid growing demand headwinds out of China's comatose housing sector where not even ghost cities are being built any more.
Copper surged almost 5% this week, ending a months-long spell of inertia, as investors focused on risks to supply at various global mines and smelters. As Bloomberg adds, traders also warmed to the idea that the worst of a global downturn is in the past, particularly for metals like copper that are increasingly used in electric vehicles and renewables.
Yet the commodity crash of recent years is hardly over, as signs of the headwinds in traditional industrial sectors are still all too obvious in the iron ore market, where futures fell below $100 a ton for the first time in seven months on Friday as investors bet that China’s years-long property crisis will run through 2024, keeping a lid on demand.
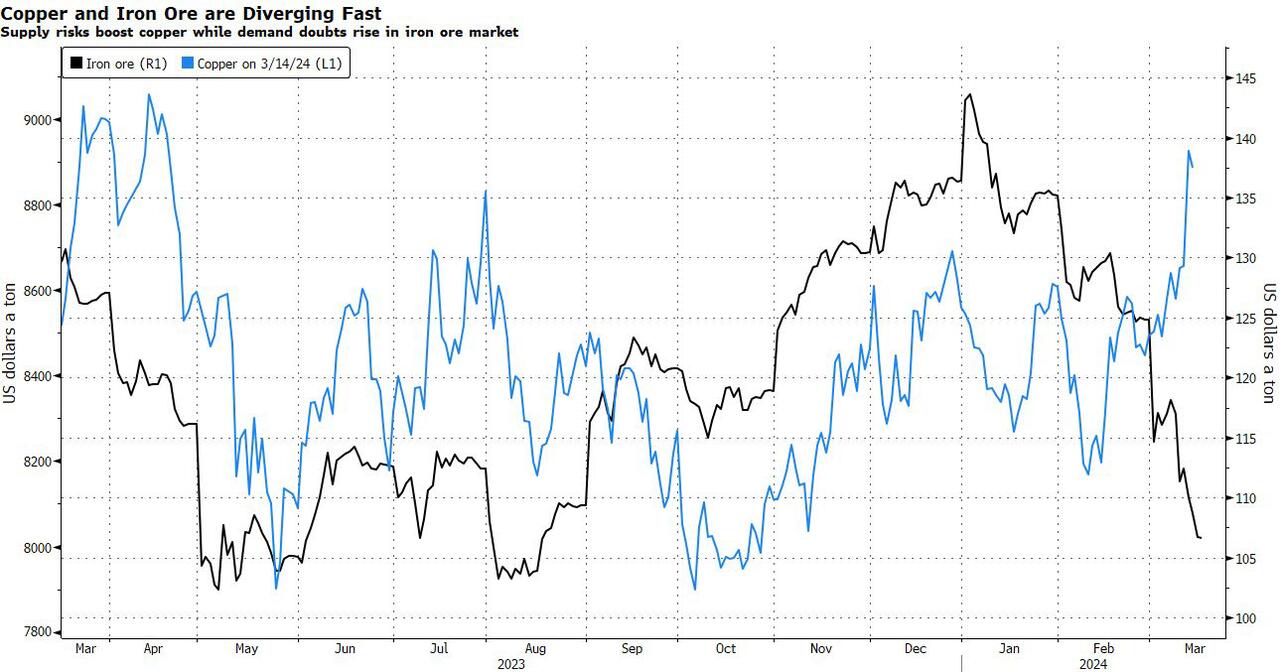
Indeed, while the mood surrounding copper has turned almost euphoric, sentiment on iron ore has soured since the conclusion of the latest National People’s Congress in Beijing, where the CCP set a 5% goal for economic growth, but offered few new measures that would boost infrastructure or other construction-intensive sectors.
As a result, the main steelmaking ingredient has shed more than 30% since early January as hopes of a meaningful revival in construction activity faded. Loss-making steel mills are buying less ore, and stockpiles are piling up at Chinese ports. The latest drop will embolden those who believe that the effects of President Xi Jinping’s property crackdown still have significant room to run, and that last year’s rally in iron ore may have been a false dawn.
Meanwhile, as Bloomberg notes, on Friday there were fresh signs that weakness in China’s industrial economy is hitting the copper market too, with stockpiles tracked by the Shanghai Futures Exchange surging to the highest level since the early days of the pandemic. The hope is that headwinds in traditional industrial areas will be offset by an ongoing surge in usage in electric vehicles and renewables.
And while industrial conditions in Europe and the US also look soft, there’s growing optimism about copper usage in India, where rising investment has helped fuel blowout growth rates of more than 8% — making it the fastest-growing major economy.
In any case, with the demand side of the equation still questionable, the main catalyst behind copper’s powerful rally is an unexpected tightening in global mine supplies, driven mainly by last year’s closure of a giant mine in Panama (discussed here), but there are also growing worries about output in Zambia, which is facing an El Niño-induced power crisis.
On Wednesday, copper prices jumped on huge volumes after smelters in China held a crisis meeting on how to cope with a sharp drop in processing fees following disruptions to supplies of mined ore. The group stopped short of coordinated production cuts, but pledged to re-arrange maintenance work, reduce runs and delay the startup of new projects. In the coming weeks investors will be watching Shanghai exchange inventories closely to gauge both the strength of demand and the extent of any capacity curtailments.
“The increase in SHFE stockpiles has been bigger than we’d anticipated, but we expect to see them coming down over the next few weeks,” Colin Hamilton, managing director for commodities research at BMO Capital Markets, said by phone. “If the pace of the inventory builds doesn’t start to slow, investors will start to question whether smelters are actually cutting and whether the impact of weak construction activity is starting to weigh more heavily on the market.”
* * *
Few have been as happy with the recent surge in copper prices as Goldman's commodity team, where copper has long been a preferred trade (even if it may have cost the former team head Jeff Currie his job due to his unbridled enthusiasm for copper in the past two years which saw many hedge fund clients suffer major losses).
As Goldman's Nicholas Snowdon writes in a note titled "Copper's time is now" (available to pro subscribers in the usual place)...

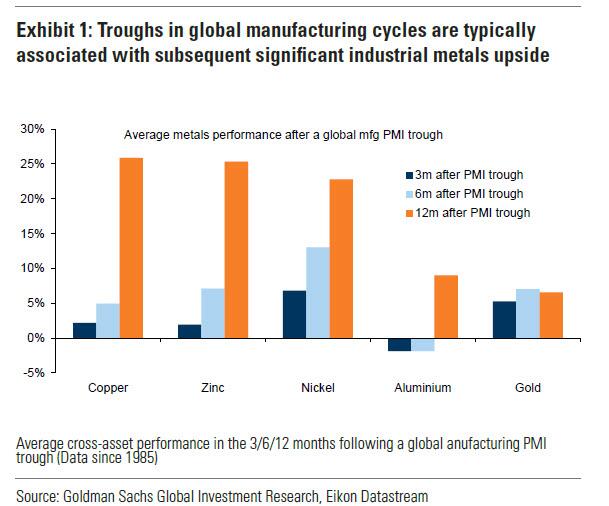
... there has been a "turn in the industrial cycle." Specifically according to the Goldman analyst, after a prolonged downturn, "incremental evidence now points to a bottoming out in the industrial cycle, with the global manufacturing PMI in expansion for the first time since September 2022." As a result, Goldman now expects copper to rise to $10,000/t by year-end and then $12,000/t by end of Q1-25.’
Here are the details:
Previous inflexions in global manufacturing cycles have been associated with subsequent sustained industrial metals upside, with copper and aluminium rising on average 25% and 9% over the next 12 months. Whilst seasonal surpluses have so far limited a tightening alignment at a micro level, we expect deficit inflexions to play out from quarter end, particularly for metals with severe supply binds. Supplemented by the influence of anticipated Fed easing ahead in a non-recessionary growth setting, another historically positive performance factor for metals, this should support further upside ahead with copper the headline act in this regard.
Goldman then turns to what it calls China's "green policy put":
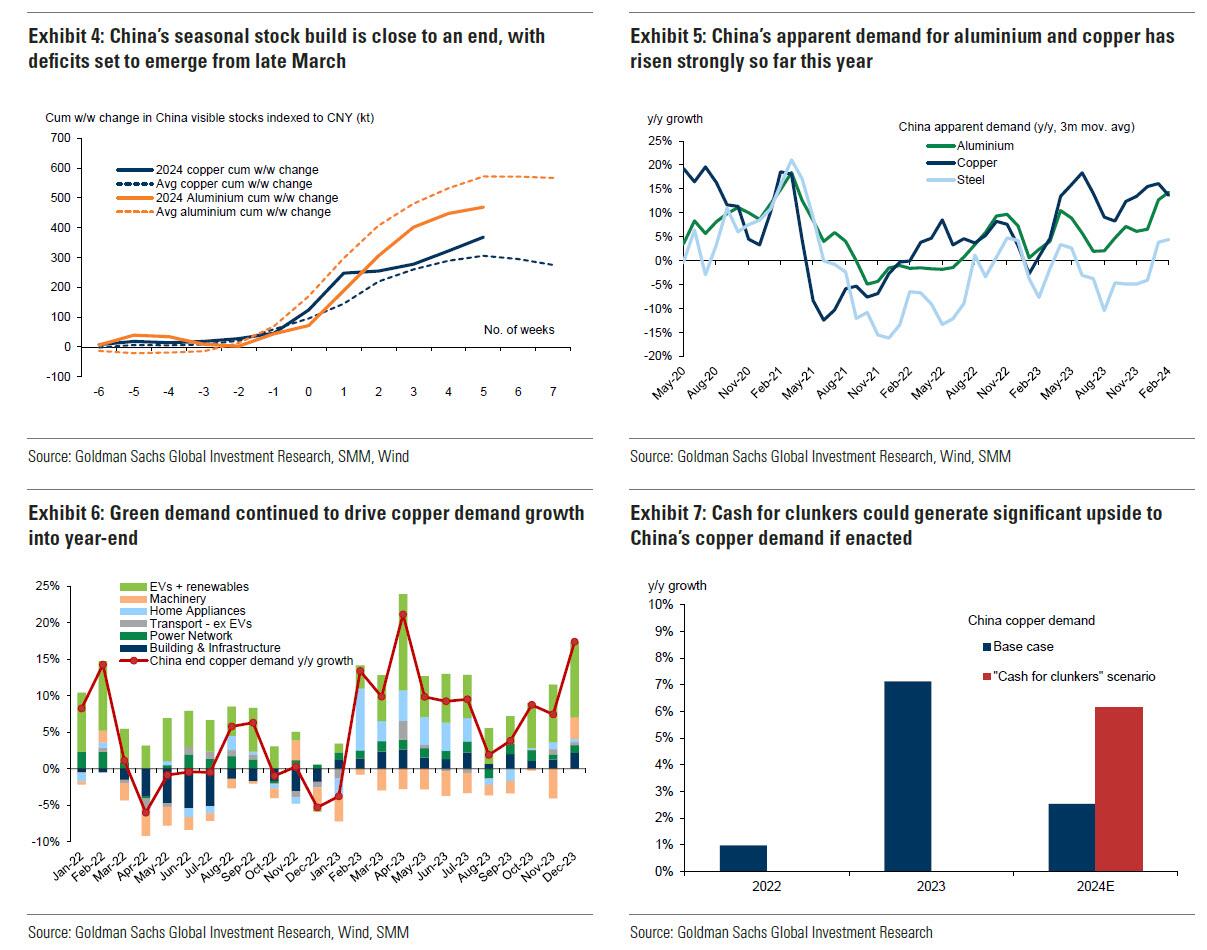
Much of the recent focus on the “Two Sessions” event centred on the lack of significant broad stimulus, and in particular the limited property support. In our view it would be wrong – just as in 2022 and 2023 – to assume that this will result in weak onshore metals demand. Beijing’s emphasis on rapid growth in the metals intensive green economy, as an offset to property declines, continues to act as a policy put for green metals demand. After last year’s strong trends, evidence year-to-date is again supportive with aluminium and copper apparent demand rising 17% and 12% y/y respectively. Moreover, the potential for a ‘cash for clunkers’ initiative could provide meaningful right tail risk to that healthy demand base case. Yet there are also clear metal losers in this divergent policy setting, with ongoing pressure on property related steel demand generating recent sharp iron ore downside.
Meanwhile, Snowdon believes that the driver behind Goldman's long-running bullish view on copper - a global supply shock - continues:
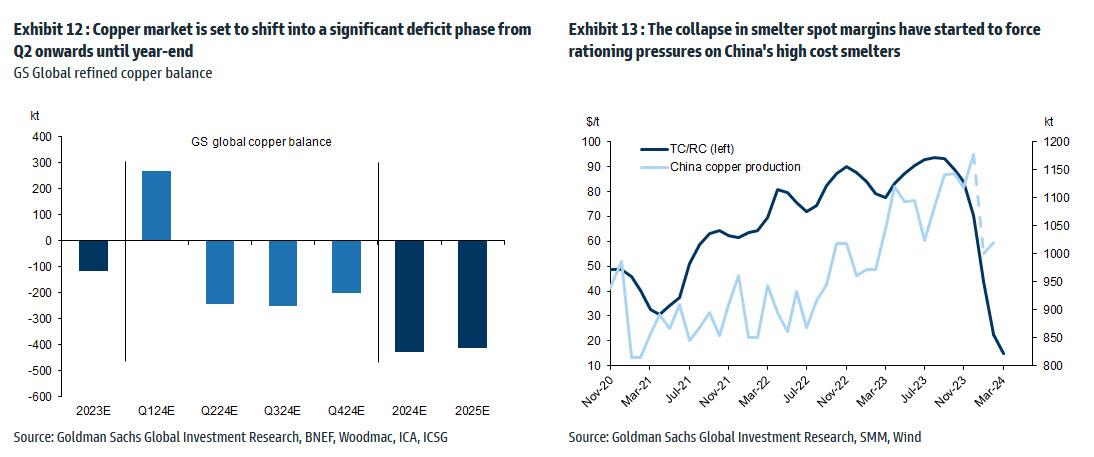
Copper’s supply shock progresses. The metal with most significant upside potential is copper, in our view. The supply shock which began with aggressive concentrate destocking and then sharp mine supply downgrades last year, has now advanced to an increasing bind on metal production, as reflected in this week's China smelter supply rationing signal. With continued positive momentum in China's copper demand, a healthy refined import trend should generate a substantial ex-China refined deficit this year. With LME stocks having halved from Q4 peak, China’s imminent seasonal demand inflection should accelerate a path into extreme tightness by H2. Structural supply underinvestment, best reflected in peak mine supply we expect next year, implies that demand destruction will need to be the persistent solver on scarcity, an effect requiring substantially higher pricing than current, in our view. In this context, we maintain our view that the copper price will surge into next year (GSe 2025 $15,000/t average), expecting copper to rise to $10,000/t by year-end and then $12,000/t by end of Q1-25’
Another reason why Goldman is doubling down on its bullish copper outlook: gold.
The sharp rally in gold price since the beginning of March has ended the period of consolidation that had been present since late December. Whilst the initial catalyst for the break higher came from a (gold) supportive turn in US data and real rates, the move has been significantly amplified by short term systematic buying, which suggests less sticky upside. In this context, we expect gold to consolidate for now, with our economists near term view on rates and the dollar suggesting limited near-term catalysts for further upside momentum. Yet, a substantive retracement lower will also likely be limited by resilience in physical buying channels. Nonetheless, in the midterm we continue to hold a constructive view on gold underpinned by persistent strength in EM demand as well as eventual Fed easing, which should crucially reactivate the largely for now dormant ETF buying channel. In this context, we increase our average gold price forecast for 2024 from $2,090/toz to $2,180/toz, targeting a move to $2,300/toz by year-end.
Much more in the full Goldman note available to pro subs.
Government
Moderna turns the spotlight on long Covid with new initiatives
Moderna’s latest Covid effort addresses the often-overlooked chronic condition of long Covid — and encourages vaccination to reduce risks. A digital…
Share this:


Moderna’s latest Covid effort addresses the often-overlooked chronic condition of long Covid — and encourages vaccination to reduce risks. A digital campaign debuted Friday along with a co-sponsored event in Detroit offering free CT scans, which will also be used in ongoing long Covid research.
In a new video, a young woman describes her three-year battle with long Covid, which includes losing her job, coping with multiple debilitating symptoms and dealing with the negative effects on her family. She ends by saying, “The only way to prevent long Covid is to not get Covid” along with an on-screen message about where to find Covid-19 vaccines through the vaccines.gov website.
“Last season we saw people would get a flu shot, but they didn’t always get a Covid shot,” said Moderna’s Chief Brand Officer Kate Cronin. “People should get their flu shot, but they should also get their Covid shot. There’s no risk of long flu, but there is the risk of long-term effects of Covid.”
It’s Moderna’s “first effort to really sound the alarm,” she said, and the debut coincides with the second annual Long Covid Awareness Day.
An estimated 17.6 million Americans are living with long Covid, according to the latest CDC data. About four million of them are out of work because of the condition, resulting in an estimated $170 billion in lost wages.
While HHS anted up $45 million in grants last year to expand long Covid support initiatives along with public health campaigns, the condition is still often ignored and underfunded.
“It’s not just about the initial infection of Covid, but also if you get it multiple times, your risks goes up significantly,” Cronin said. “It’s important that people understand that.”
grants covid-19 cdc hhsGovernment
Consequences Minus Truth
Consequences Minus Truth
Authored by James Howard Kunstler via Kunstler.com,
“People crave trust in others, because God is found there.”
-…
Share this:


Authored by James Howard Kunstler via Kunstler.com,
“People crave trust in others, because God is found there.”
- Dom de Bailleul
The rewards of civilization have come to seem rather trashy in these bleak days of late empire; so, why even bother pretending to be civilized? This appears to be the ethos driving our politics and culture now. But driving us where? Why, to a spectacular sort of crack-up, and at warp speed, compared to the more leisurely breakdown of past societies that arrived at a similar inflection point where Murphy’s Law replaced the rule of law.
The US Military Academy at West point decided to “upgrade” its mission statement this week by deleting the phrase Duty, Honor, Country that summarized its essential moral orientation. They replaced it with an oblique reference to “Army Values,” without spelling out what these values are, exactly, which could range from “embrace the suck” to “charlie foxtrot” to “FUBAR” — all neatly applicable to our country’s current state of perplexity and dread.
Are you feeling more confident that the US military can competently defend our country? Probably more like the opposite, because the manipulation of language is being used deliberately to turn our country inside-out and upside-down. At this point we probably could not successfully pacify a Caribbean island if we had to, and you’ve got to wonder what might happen if we have to contend with countless hostile subversive cadres who have slipped across the border with the estimated nine-million others ushered in by the government’s welcome wagon.
Momentous events await. This Monday, the Supreme Court will entertain oral arguments on the case Missouri, et al. v. Joseph R. Biden, Jr., et al. The integrity of the First Amendment hinges on the decision. Do we have freedom of speech as set forth in the Constitution? Or is it conditional on how government officials feel about some set of circumstances? At issue specifically is the government’s conduct in coercing social media companies to censor opinion in order to suppress so-called “vaccine hesitancy” and to manipulate public debate in the 2020 election. Government lawyers have argued that they were merely “communicating” with Twitter, Facebook, Google, and others about “public health disinformation and election conspiracies.”
You can reasonably suppose that this was our government’s effort to disable the truth, especially as it conflicted with its own policy and activities — from supporting BLM riots to enabling election fraud to mandating dubious vaccines. Former employees of the FBI and the CIA were directly implanted in social media companies to oversee the carrying-out of censorship orders from their old headquarters. The former general counsel (top lawyer) for the FBI, James Baker, slid unnoticed into the general counsel seat at Twitter until Elon Musk bought the company late in 2022 and flushed him out. The so-called Twitter Files uncovered by indy reporters Matt Taibbi, Michael Shellenberger, and others, produced reams of emails from FBI officials nagging Twitter execs to de-platform people and bury their dissent. You can be sure these were threats, not mere suggestions.
One of the plaintiffs joined to Missouri v. Biden is Dr. Martin Kulldorff, a biostatistician and professor at the Harvard Medical School, who opposed Covid-19 lockdowns and vaccine mandates. He was one of the authors of the open letter called The Great Barrington Declaration (October, 2020) that articulated informed medical dissent for a bamboozled public. He was fired from his job at Harvard just this past week for continuing his refusal to take the vaccine. Harvard remains among a handful of institutions that still require it, despite massive evidence that it is ineffective and hazardous. Like West Point, maybe Harvard should ditch its motto, Veritas, Latin for “truth.”
A society hostile to truth can’t possibly remain civilized, because it will also be hostile to reality. That appears to be the disposition of the people running things in the USA these days. The problem, of course, is that this is not a reality-optional world, despite the wishes of many Americans (and other peoples of Western Civ) who wish it would be.
Next up for us will be “Joe Biden’s” attempt to complete the bankruptcy of our country with $7.3-trillion proposed budget, 20 percent over the previous years spending, based on a $5-billion tax increase. Good luck making that work. New York City alone is faced with paying $387 a day for food and shelter for each of an estimated 64,800 illegal immigrants, which amounts to $9.15-billion a year. The money doesn’t exist, of course. New York can thank “Joe Biden’s” executive agencies for sticking them with this unbearable burden. It will be the end of New York City. There will be no money left for public services or cultural institutions. That’s the reality and that’s the truth.
A financial crack-up is probably the only thing short of all-out war that will get the public’s attention at this point. I wouldn’t be at all surprised if it happened next week. Historians of the future, stir-frying crickets and fiddleheads over their campfires will marvel at America’s terminal act of gluttony: managing to eat itself alive.
* * *
Support his blog by visiting Jim’s Patreon Page or Substack


Key shipping company files for Chapter 11 bankruptcy


Net Zero, The Digital Panopticon, & The Future Of Food


Illegal Immigrants Leave US Hospitals With Billions In Unpaid Bills


These Cities Have The Highest (And Lowest) Share Of Unaffordable Neighborhoods In 2024


Problems After COVID-19 Vaccination More Prevalent Among Naturally Immune: Study


For-profit nursing homes are cutting corners on safety and draining resources with financial shenanigans − especially at midsize chains that dodge public scrutiny


Tight inventory and frustrated buyers challenge agents in Virginia


The Question You Should Ask Whenever You’re Wrong


Trump nearly derailed democracy once − here’s what to watch out for in reelection campaign


Looking Back At COVID’s Authoritarian Regimes
-

 Uncategorized3 weeks ago
All Of The Elements Are In Place For An Economic Crisis Of Staggering Proportions
-

 International1 week ago
EyePoint poaches medical chief from Apellis; Sandoz CFO, longtime BioNTech exec to retire
-

 Uncategorized4 weeks ago
California Counties Could Be Forced To Pay $300 Million To Cover COVID-Era Program
-

 Uncategorized3 weeks ago
Apparel Retailer Express Moving Toward Bankruptcy
-

 Uncategorized4 weeks ago
Industrial Production Decreased 0.1% in January
-

 International1 week ago
Walmart launches clever answer to Target’s new membership program
-

 Spread & Containment2 days ago
IFM’s Hat Trick and Reflections On Option-To-Buy M&A
-

 Uncategorized4 weeks ago
RFK Jr: The Wuhan Cover-Up & The Rise Of The Biowarfare-Industrial Complex