Uncategorized
S&T BANCORP, INC. ANNOUNCES RECORD QUARTERLY EPS AND NET INCOME
S&T BANCORP, INC. ANNOUNCES RECORD QUARTERLY EPS AND NET INCOME
PR Newswire
INDIANA, Pa., Oct. 20, 2022
INDIANA, Pa., Oct. 20, 2022 /PRNewswire/ — S&T Bancorp, Inc. (S&T) (NASDAQ: STBA), the holding company for S&T Bank, announced …
Share this:


S&T BANCORP, INC. ANNOUNCES RECORD QUARTERLY EPS AND NET INCOME
PR Newswire
INDIANA, Pa., Oct. 20, 2022
INDIANA, Pa., Oct. 20, 2022 /PRNewswire/ -- S&T Bancorp, Inc. (S&T) (NASDAQ: STBA), the holding company for S&T Bank, announced net income of $37.2 million, or $0.95 per diluted share, for the third quarter of 2022 compared to net income of $28.9 million, or $0.74 per diluted share, for the second quarter of 2022 and net income of $27.6 million, or $0.70 per diluted share, for the third quarter of 2021.
Third Quarter of 2022 Highlights:
- Record EPS and net income for the third quarter of 2022.
- EPS and net income increased more than 28% compared to the second quarter of 2022 and by approximately 35% compared to the third quarter of 2021.
- Solid return metrics with return on average assets (ROA) of 1.64%, return on average equity (ROE) of 12.47% and return on average tangible equity (ROTE) (non-GAAP) of 18.46%.
- Pre-provision net revenue to average assets (PPNR) (non-GAAP) of 2.15%.
- Net interest margin (NIM) (FTE) (Non-GAAP) expanded 48 basis points to 4.04% for the third quarter.
- Net interest income increased $8.6 million, or 11.4%, compared to the second quarter.
- Loans, excluding PPP, increased $63.1 million, or 3.6% annualized, with strong consumer loan growth of $113.5 million.
- Nonperforming assets decreased $10.0 million, or 25.8%, resulting in a nonperforming assets to total loans plus other real estate owned, or OREO, ratio of 0.41% compared to 0.55% at June 30, 2022.
- S&T's Board of Directors approved a $0.01 per share, or 3.3%, increase in the quarterly cash dividend to $0.31 per share compared to the prior quarter.
"We are excited to share an exceptionally strong quarter with record EPS and net income. Our balance sheet is well-positioned in this rising interest rate environment resulting in significant net interest income growth and net interest margin expansion," said Chris McComish, chief executive officer. "Our financial performance, driven by our award-winning customer experience and employee engagement give us great optimism as we move through the current economic environment."
Net Interest Income
Net interest income increased $8.6 million, or 11.4%, to $83.8 million for the third quarter of 2022 compared to $75.2 million for the second quarter of 2022. The increase in net interest income was primarily due to higher interest rates in the third quarter. The yield on total average loans increased 58 basis points to 4.69% compared to 4.11% in the second quarter of 2022. Total interest-bearing deposit costs increased 29 basis points to 0.43% compared to 0.14% in the second quarter of 2022. Net interest margin on a fully taxable equivalent basis (NIM) (FTE) (non-GAAP) expanded 48 basis points to 4.04% compared to 3.56% in the prior quarter. The increase in NIM (FTE) (non-GAAP) was due to higher yields on loans and a better earning asset mix only partially offset by a higher cost of deposits.
Asset Quality
Total nonperforming assets decreased $10.0 million, or 25.8%, to $28.8 million at September 30, 2022 compared to $38.8 million at June 30, 2022. Nonperforming assets to total loans plus OREO, decreased 14 basis points to 0.41% at September 30, 2022 compared to 0.55% at June 30, 2022. Net loan charge-offs were $0.7 million for the third quarter of 2022 compared to $3.0 million in the second quarter of 2022. The provision for credit losses was $2.5 million for the third quarter of 2022 compared to $3.2 million in the second quarter of 2022. The allowance for credit losses was 1.40% of total portfolio loans as of September 30, 2022 compared to 1.39% at June 30, 2022. The increase in the allowance for credit losses was related to additional uncertainty in the macroeconomic environment.
"We continue to execute on our strategic initiative to improve our asset quality which drove nonperforming assets down twenty-five percent this quarter. Improving asset quality will remain a strategic priority for us especially given the evolving macroeconomic outlook," said Chris McComish, chief executive officer.
Noninterest Income and Expense
Noninterest income increased $2.2 million to $14.8 million in the third quarter of 2022 compared to $12.6 million in the second quarter of 2022. Other income increased $1.8 million in the third quarter primarily related to a lower unfavorable decline in the fair value of the assets in a nonqualified benefit plan and a gain on sale of OREO of $0.6 million. Noninterest expense increased $1.2 million to $49.6 million for the third quarter of 2022 compared to $48.4 million in the second quarter of 2022 mainly due to an increase of $1.9 million in salaries and employee benefits related to a lower decline in the fair value of the liability in a nonqualified benefit plan and higher pension expense. Professional services and legal decreased $0.5 million related to various consulting engagements during the second quarter of 2022.
Financial Condition
Total assets were $8.9 billion at September 30, 2022 compared to $9.1 billion at June 30, 2022. The decrease in total assets related to a $209.8 million decline in cash balances which was mainly due to a decrease in total deposits and an increase in loans. Total portfolio loans excluding Paycheck Protection Program increased by $63.1 million, or 3.6% annualized, compared to June 30, 2022. The consumer loan portfolio grew $113.5 million with strong growth across all consumer loan categories compared to June 30, 2022. Total deposits decreased $201.7 million to $7.4 billion at September 30, 2022 compared to $7.6 billion at June 30, 2022. The decline in deposits was due to the competitive market driven by rising interest rates.
During the third quarter of 2022, 117,283 common shares were repurchased at a total cost of $3.5 million, or an average of $29.71 per share. S&T continues to maintain a strong regulatory capital position with all capital ratios above the well-capitalized thresholds of federal bank regulatory agencies.
Dividend
S&T's Board of Directors approved a $0.31 per share cash dividend on October 17, 2022. This dividend compares to a $0.29 per share cash dividend declared in the same period in the prior year. The dividend is payable November 17, 2022 to shareholders of record on November 3, 2022.
Conference Call
S&T will host its third quarter 2022 earnings conference call live over the Internet at 1:00 p.m. ET on Thursday, October 20, 2022. To access the webcast, go to S&T's webpage at www.stbancorp.com and click on "Events & Presentations." Select "3rd Quarter 2022 Earnings Conference Call" and follow the instructions. After the live presentation, the webcast will be archived on this website for at least 90 days. A replay of the call will also be available until October 27, 2022, by dialing 1.877.481.4010; the Conference ID is 46631.
About S&T Bancorp, Inc. and S&T Bank
S&T Bancorp, Inc. is a $8.9 billion bank holding company that is headquartered in Indiana, Pennsylvania and trades on the NASDAQ Global Select Market under the symbol STBA. Its principal subsidiary, S&T Bank, was established in 1902 and operates in Pennsylvania, Ohio and New York. S&T Bank was recently named by Forbes as a 2022 Best-in-State Bank. S&T Bank also received the highest ranking in customer satisfaction for retail banking in the Pennsylvania region by J.D. Power in 2022. For more information visit stbancorp.com or stbank.com. Follow us on Facebook, Instagram and LinkedIn.
This information contains or incorporates statements that we believe are "forward-looking statements" within the meaning of the Private Securities Litigation Reform Act of 1995. Forward-looking statements generally relate to our financial condition, results of operations, plans, objectives, outlook for earnings, revenues, expenses, capital and liquidity levels and ratios, asset levels, asset quality, financial position and other matters regarding or affecting S&T and its future business and operations. Forward-looking statements are typically identified by words or phrases such as "will likely result," "expect," "anticipate," "estimate," "forecast," "project," "intend," "believe," "assume," "strategy," "trend," "plan," "outlook," "outcome," "continue," "remain," "potential," "opportunity," "comfortable," "current," "position," "maintain," "sustain," "seek," "achieve," and variations of such words and similar expressions, or future or conditional verbs such as will, would, should, could or may. Although we believe the assumptions upon which these forward-looking statements are based are reasonable, any of these assumptions could prove to be inaccurate and the forward-looking statements based on these assumptions could be incorrect. The matters discussed in these forward-looking statements are subject to various risks, uncertainties and other factors that could cause actual results and trends to differ materially from those made, projected, or implied in or by the forward-looking statements depending on a variety of uncertainties or other factors including, but not limited to: credit losses and the credit risk of our commercial and consumer loan products; changes in the level of charge-offs and changes in estimates of the adequacy of the allowance for credit losses; cyber-security concerns; rapid technological developments and changes; operational risks or risk management failures by us or critical third parties, including fraud risk; our ability to manage our reputational risks; sensitivity to the interest rate environment including a prolonged period of low interest rates, a rapid increase in interest rates or a change in the shape of the yield curve; a change in spreads on interest-earning assets and interest-bearing liabilities; the transition from LIBOR as a reference rate; regulatory supervision and oversight, including changes in regulatory capital requirements and our ability to address those requirements; unanticipated changes in our liquidity position; changes in accounting policies, practices or guidance; legislation affecting the financial services industry as a whole, and S&T, in particular; the outcome of pending and future litigation and governmental proceedings; increasing price and product/service competition; the ability to continue to introduce competitive new products and services on a timely, cost-effective basis; managing our internal growth and acquisitions; the possibility that the anticipated benefits from acquisitions, cannot be fully realized in a timely manner or at all, or that integrating the acquired operations will be more difficult, disruptive or costly than anticipated; containing costs and expenses; reliance on significant customer relationships; an interruption or cessation of an important service by a third-party provider; our ability to attract and retain talented executives and employees; our ability to successfully manage our CEO transition; general economic or business conditions, including the strength of regional economic conditions in our market area; the duration and severity of the coronavirus ("COVID-19") pandemic, both in our principal area of operations and nationally, including the ultimate impact of the pandemic on the economy generally and on our operations; our participation in the Paycheck Protection Program; deterioration of the housing market and reduced demand for mortgages; deterioration in the overall macroeconomic conditions or the state of the banking industry that could warrant further analysis of the carrying value of goodwill and could result in an adjustment to its carrying value resulting in a non-cash charge to net income; the stability of our core deposit base and access to contingency funding; re-emergence of turbulence in significant portions of the global financial and real estate markets that could impact our performance, both directly, by affecting our revenues and the value of our assets and liabilities, and indirectly, by affecting the economy generally and access to capital in the amounts, at the times and on the terms required to support our future businesses.
Many of these factors, as well as other factors, are described in our Annual Report on Form 10-K for the year ended December 31, 2021, including Part I, Item 1A-"Risk Factors" and any of our subsequent filings with the SEC. Forward-looking statements are based on beliefs and assumptions using information available at the time the statements are made. We caution you not to unduly rely on forward-looking statements because the assumptions, beliefs, expectations and projections about future events may, and often do, differ materially from actual results. Any forward-looking statement speaks only as to the date on which it is made, and we undertake no obligation to update any forward-looking statement to reflect developments occurring after the statement is made.
S&T Bancorp, Inc. | ||||||
2022 | 2022 | 2021 | ||||
Third | Second | Third | ||||
(dollars in thousands, except per share data) | Quarter | Quarter | Quarter | |||
INTEREST AND DIVIDEND INCOME | ||||||
Loans, including fees | $83,035 | $71,018 | $66,914 | |||
Investment Securities: | ||||||
Taxable | 6,305 | 5,995 | 4,176 | |||
Tax-exempt | 380 | 484 | 595 | |||
Dividends | 115 | 102 | 84 | |||
Total Interest and Dividend Income | 89,835 | 77,599 | 71,769 | |||
INTEREST EXPENSE | ||||||
Deposits | 5,197 | 1,790 | 2,439 | |||
Borrowings and junior subordinated debt securities | 840 | 615 | 619 | |||
Total Interest Expense | 6,037 | 2,405 | 3,058 | |||
NET INTEREST INCOME | 83,798 | 75,194 | 68,711 | |||
Provision for credit losses | 2,498 | 3,204 | 3,388 | |||
Net Interest Income After Provision for Credit Losses | 81,300 | 71,990 | 65,323 | |||
NONINTEREST INCOME | ||||||
Net gain on sale of securities | 198 | — | — | |||
Debit and credit card | 4,768 | 4,756 | 4,579 | |||
Service charges on deposit accounts | 4,333 | 4,181 | 3,923 | |||
Wealth management | 3,212 | 3,247 | 3,464 | |||
Mortgage banking | 425 | 466 | 2,162 | |||
Other | 1,824 | (20) | 1,718 | |||
Total Noninterest Income | 14,760 | 12,630 | 15,846 | |||
NONINTEREST EXPENSE | ||||||
Salaries and employee benefits | 26,700 | 24,811 | 25,228 | |||
Data processing and information technology | 4,220 | 4,104 | 4,001 | |||
Occupancy | 3,490 | 3,634 | 3,660 | |||
Furniture, equipment and software | 2,915 | 2,939 | 2,745 | |||
Professional services and legal | 1,851 | 2,380 | 1,550 | |||
Other taxes | 1,559 | 1,682 | 1,830 | |||
Marketing | 1,367 | 1,524 | 890 | |||
FDIC insurance | 598 | 882 | 1,210 | |||
Other | 6,933 | 6,468 | 6,127 | |||
Total Noninterest Expense | 49,633 | 48,424 | 47,241 | |||
Income Before Taxes | 46,427 | 36,196 | 33,928 | |||
Income tax expense | 9,178 | 7,338 | 6,330 | |||
Net Income | $37,249 | $28,858 | $27,598 | |||
Per Share Data | ||||||
Shares outstanding at end of period | 39,012,773 | 39,148,999 | 39,367,847 | |||
Average shares outstanding - diluted | 38,975,145 | 39,099,631 | 39,062,080 | |||
Diluted earnings per share | $0.95 | $0.74 | $0.70 | |||
Dividends declared per share | $0.30 | $0.30 | $0.28 | |||
Dividend yield (annualized) | 4.09 % | 4.37 % | 3.80 % | |||
Dividends paid to net income | 31.39 % | 40.86 % | 39.83 % | |||
Book value | $29.56 | $30.10 | $30.52 | |||
Tangible book value (1) | $19.87 | $20.44 | $20.89 | |||
Market value | $29.31 | $27.43 | $29.47 | |||
Profitability Ratios (Annualized) | ||||||
Return on average assets | 1.64 % | 1.25 % | 1.15 % | |||
Return on average shareholders' equity | 12.47 % | 9.83 % | 9.13 % | |||
Return on average tangible shareholders' equity(2) | 18.46 % | 14.63 % | 13.53 % | |||
Pre-provision net revenue / average assets(3) | 2.15 % | 1.71 % | 1.56 % | |||
Efficiency ratio (FTE)(4) | 50.19 % | 54.82 % | 55.50 % | |||
S&T Bancorp, Inc. | ||||||
Nine Months Ended September 30, | ||||||
(dollars in thousands, except per share data) | 2022 | 2021 | ||||
INTEREST AND DIVIDEND INCOME | ||||||
Loans, including fees | $218,646 | $204,088 | ||||
Investment Securities: | ||||||
Taxable | 17,236 | 11,532 | ||||
Tax-exempt | 1,346 | 2,098 | ||||
Dividends | 315 | 409 | ||||
Total Interest and Dividend Income | 237,543 | 218,127 | ||||
INTEREST EXPENSE | ||||||
Deposits | 8,840 | 8,572 | ||||
Borrowings and junior subordinated debt securities | 1,978 | 1,881 | ||||
Total Interest Expense | 10,818 | 10,453 | ||||
NET INTEREST INCOME | 226,725 | 207,674 | ||||
Provision for credit losses | 5,190 | 9,087 | ||||
Net Interest Income After Provision for Credit Losses | 221,535 | 198,587 | ||||
NONINTEREST INCOME | ||||||
Net gain on sale of securities | 198 | 29 | ||||
Debit and credit card | 14,587 | 13,486 | ||||
Service charges on deposit accounts | 12,488 | 11,039 | ||||
Wealth management | 9,701 | 9,576 | ||||
Mortgage banking | 1,906 | 8,206 | ||||
Other | 3,736 | 6,257 | ||||
Total Noninterest Income | 42,616 | 48,593 | ||||
NONINTEREST EXPENSE | ||||||
Salaries and employee benefits | 75,223 | 73,070 | ||||
Data processing and information technology | 12,759 | 12,012 | ||||
Occupancy | 11,006 | 10,921 | ||||
Furniture, equipment and software | 8,631 | 7,787 | ||||
Professional services and legal | 6,180 | 4,718 | ||||
Other taxes | 4,778 | 5,098 | ||||
Marketing | 4,252 | 3,208 | ||||
FDIC insurance | 2,417 | 3,180 | ||||
Other | 20,225 | 18,742 | ||||
Total Noninterest Expense | 145,471 | 138,736 | ||||
Income Before Taxes | 118,680 | 108,444 | ||||
Income tax expense | 23,430 | 20,578 | ||||
Net Income | $95,250 | $87,866 | ||||
Per Share Data | ||||||
Average shares outstanding - diluted | 39,049,151 | 39,044,870 | ||||
Diluted earnings per share | $2.43 | $2.24 | ||||
Dividends declared per share | $0.89 | $0.84 | ||||
Dividends paid to net income | 36.61 % | 37.50 % | ||||
Profitability Ratios (annualized) | ||||||
Return on average assets | 1.38 % | 1.26 % | ||||
Return on average shareholders' equity | 10.73 % | 9.96 % | ||||
Return on average tangible shareholders' equity(5) | 15.91 % | 14.87 % | ||||
Pre-provision net revenue / average assets(6) | 1.79 % | 1.68 % | ||||
Efficiency ratio (FTE)(7) | 53.75 % | 53.75 % | ||||
S&T Bancorp, Inc. | ||||||
2022 | 2022 | 2021 | ||||
Third | Second | Third | ||||
(dollars in thousands) | Quarter | Quarter | Quarter | |||
ASSETS | ||||||
Cash and due from banks, including interest-bearing deposits | $134,903 | $344,694 | $934,377 | |||
Securities, at fair value | 997,428 | 1,068,576 | 870,121 | |||
Loans held for sale | 1,039 | 1,311 | 4,303 | |||
Commercial loans: | ||||||
Commercial real estate | 3,134,841 | 3,191,670 | 3,225,863 | |||
Commercial and industrial | 1,714,714 | 1,695,031 | 1,698,784 | |||
Commercial construction | 390,093 | 410,425 | 499,317 | |||
Total Commercial Loans | 5,239,648 | 5,297,126 | 5,423,964 | |||
Consumer loans: | ||||||
Residential mortgage | 1,043,973 | 975,108 | 887,937 | |||
Home equity | 642,937 | 611,893 | 548,396 | |||
Installment and other consumer | 126,629 | 119,938 | 97,606 | |||
Consumer construction | 43,729 | 36,829 | 12,184 | |||
Total Consumer Loans | 1,857,268 | 1,743,768 | 1,546,123 | |||
Total Portfolio Loans | 7,096,916 | 7,040,894 | 6,970,087 | |||
Allowance for credit losses | (99,694) | (98,095) | (108,348) | |||
Total Portfolio Loans, Net | 6,997,222 | 6,942,799 | 6,861,739 | |||
Federal Home Loan Bank and other restricted stock, at cost | 10,900 | 7,949 | 9,893 | |||
Goodwill | 373,424 | 373,424 | 373,424 | |||
Other assets | 421,053 | 365,061 | 382,197 | |||
Total Assets | $8,935,969 | $9,103,814 | $9,436,054 | |||
LIABILITIES | ||||||
Deposits: | ||||||
Noninterest-bearing demand | $2,663,176 | $2,736,849 | $2,652,314 | |||
Interest-bearing demand | 847,825 | 880,432 | 971,321 | |||
Money market | 1,818,642 | 1,888,506 | 2,045,320 | |||
Savings | 1,128,169 | 1,125,344 | 1,074,896 | |||
Certificates of deposit | 952,785 | 981,116 | 1,201,268 | |||
Total Deposits | 7,410,597 | 7,612,247 | 7,945,119 | |||
Borrowings: | ||||||
Securities sold under repurchase agreements | — | 39,259 | 72,586 | |||
Short-term borrowings | 35,000 | — | — | |||
Long-term borrowings | 14,853 | 21,988 | 22,693 | |||
Junior subordinated debt securities | 54,438 | 54,423 | 64,128 | |||
Total Borrowings | 104,291 | 115,670 | 159,407 | |||
Other liabilities | 267,900 | 197,539 | 129,847 | |||
Total Liabilities | 7,782,788 | 7,925,456 | 8,234,373 | |||
SHAREHOLDERS' EQUITY | ||||||
Total Shareholders' Equity | 1,153,181 | 1,178,358 | 1,201,681 | |||
Total Liabilities and Shareholders' Equity | $8,935,969 | $9,103,814 | $9,436,054 | |||
Capitalization Ratios | ||||||
Shareholders' equity / assets | 12.90 % | 12.94 % | 12.73 % | |||
Tangible common equity / tangible assets(9) | 9.06 % | 9.17 % | 9.08 % | |||
Tier 1 leverage ratio | 10.75 % | 10.25 % | 9.65 % | |||
Common equity tier 1 capital | 12.53 % | 12.34 % | 12.07 % | |||
Risk-based capital - tier 1 | 12.93 % | 12.74 % | 12.48 % | |||
Risk-based capital - total | 14.43 % | 14.23 % | 14.06 % | |||
S&T Bancorp, Inc. | |||||||
2022 | 2022 | 2021 | |||||
Third | Second | Third | |||||
(dollars in thousands) | Quarter | Quarter | Quarter | ||||
Net Interest Margin (FTE) (QTD Averages) | |||||||
ASSETS | |||||||
Interest-bearing deposits with banks | $158,700 | 2.05 % | $528,413 | 0.78 % | $914,370 | 0.16 % | |
Securities, at fair value | 1,051,534 | 2.28 % | 1,024,106 | 2.19 % | 836,019 | 2.19 % | |
Loans held for sale | 1,032 | 5.36 % | 1,406 | 3.95 % | 3,656 | 3.35 % | |
Commercial real estate | 3,159,543 | 4.63 % | 3,197,406 | 4.14 % | 3,239,867 | 3.68 % | |
Commercial and industrial | 1,704,271 | 5.10 % | 1,685,728 | 4.31 % | 1,744,684 | 4.17 % | |
Commercial construction | 405,460 | 5.05 % | 404,856 | 3.78 % | 490,940 | 3.20 % | |
Total Commercial Loans | 5,269,274 | 4.81 % | 5,287,990 | 4.16 % | 5,475,491 | 3.80 % | |
Residential mortgage | 1,005,139 | 4.12 % | 939,756 | 3.98 % | 875,684 | 4.00 % | |
Home equity | 629,827 | 4.34 % | 594,529 | 3.56 % | 547,984 | 3.34 % | |
Installment and other consumer | 123,010 | 6.10 % | 119,041 | 5.36 % | 92,615 | 5.85 % | |
Consumer construction | 40,975 | 3.47 % | 31,204 | 3.36 % | 13,626 | 3.66 % | |
Total Consumer Loans | 1,798,951 | 4.31 % | 1,684,530 | 3.92 % | 1,529,909 | 3.87 % | |
Total Portfolio Loans | 7,068,225 | 4.69 % | 6,972,520 | 4.11 % | 7,005,400 | 3.81 % | |
Total Loans | 7,069,257 | 4.69 % | 6,973,926 | 4.11 % | 7,009,056 | 3.81 % | |
Federal Home Loan Bank and other restricted stock | 8,398 | 4.55 % | 8,939 | 3.69 % | 9,981 | 2.62 % | |
Total Interest-earning Assets | 8,287,889 | 4.33 % | 8,535,384 | 3.67 % | 8,769,425 | 3.28 % | |
Noninterest-earning assets | 721,480 | 690,207 | 724,759 | ||||
Total Assets | $9,009,369 | $9,225,591 | $9,494,184 | ||||
LIABILITIES AND SHAREHOLDERS' EQUITY | |||||||
Interest-bearing demand | $872,302 | 0.07 % | $979,514 | 0.07 % | $962,139 | 0.08 % | |
Money market | 1,861,389 | 0.69 % | 1,930,852 | 0.15 % | 2,062,958 | 0.18 % | |
Savings | 1,131,575 | 0.10 % | 1,118,346 | 0.05 % | 1,059,904 | 0.03 % | |
Certificates of deposit | 962,898 | 0.61 % | 1,001,775 | 0.31 % | 1,240,345 | 0.41 % | |
Total Interest-bearing Deposits | 4,828,164 | 0.43 % | 5,030,487 | 0.14 % | 5,325,346 | 0.18 % | |
Securities sold under repurchase agreements | 12,668 | 0.10 % | 50,037 | 0.10 % | 71,054 | 0.10 % | |
Short-term borrowings | 10,379 | 3.16 % | — | — % | — | — % | |
Long-term borrowings | 17,278 | 2.25 % | 22,072 | 2.01 % | 22,841 | 1.99 % | |
Junior subordinated debt securities | 54,428 | 4.78 % | 54,413 | 3.62 % | 64,118 | 3.01 % | |
Total Borrowings | 94,753 | 3.52 % | 126,522 | 1.95 % | 158,012 | 1.56 % | |
Total Interest-bearing Liabilities | 4,922,917 | 0.49 % | 5,157,009 | 0.19 % | 5,483,358 | 0.22 % | |
Noninterest-bearing liabilities | 2,901,290 | 2,891,032 | 2,812,185 | ||||
Shareholders' equity | 1,185,162 | 1,177,550 | 1,198,641 | ||||
Total Liabilities and Shareholders' Equity | $9,009,369 | $9,225,591 | $9,494,184 | ||||
Net Interest Margin(10) | 4.04 % | 3.56 % | 3.14 % | ||||
S&T Bancorp, Inc. | |||||||
Nine Months Ended September 30, | |||||||
(dollars in thousands) | 2022 | 2021 | |||||
Net Interest Margin (FTE) (YTD Averages) | |||||||
ASSETS | |||||||
Interest-bearing deposits with banks | $478,896 | 0.60 % | $669,593 | 0.12 % | |||
Securities, at fair value | 1,026,131 | 2.19 % | 815,197 | 2.24 % | |||
Loans held for sale | 1,326 | 4.15 % | 4,780 | 3.02 % | |||
Commercial real estate | 3,204,371 | 4.14 % | 3,248,417 | 3.71 % | |||
Commercial and industrial | 1,700,923 | 4.47 % | 1,863,447 | 4.13 % | |||
Commercial construction | 406,513 | 4.05 % | 479,733 | 3.30 % | |||
Total Commercial Loans | 5,311,807 | 4.24 % | 5,591,597 | 3.81 % | |||
Residential mortgage | 947,454 | 4.04 % | 878,709 | 4.13 % | |||
Home equity | 598,595 | 3.80 % | 538,931 | 3.49 % | |||
Installment and other consumer | 117,388 | 5.64 % | 85,640 | 6.06 % | |||
Consumer construction | 31,407 | 3.41 % | 14,257 | 4.92 % | |||
Total Consumer Loans | 1,694,844 | 4.05 % | 1,517,538 | 4.02 % | |||
Total Portfolio Loans | 7,006,651 | 4.19 % | 7,109,135 | 3.86 % | |||
Total Loans | 7,007,977 | 4.19 % | 7,113,915 | 3.86 % | |||
Federal Home Loan Bank and other restricted stock | 8,869 | 3.86 % | 10,579 | 4.07 % | |||
Total Interest-earning Assets | 8,521,873 | 3.75 % | 8,609,284 | 3.41 % | |||
Noninterest-earning assets | 706,640 | 728,314 | |||||
Total Assets | $9,228,513 | $9,337,598 | |||||
LIABILITIES AND SHAREHOLDERS' EQUITY | |||||||
Interest-bearing demand | $945,733 | 0.07 % | $952,297 | 0.09 % | |||
Money market | 1,948,653 | 0.32 % | 2,023,583 | 0.18 % | |||
Savings | 1,119,739 | 0.06 % | 1,033,581 | 0.04 % | |||
Certificates of deposit | 1,011,228 | 0.41 % | 1,291,666 | 0.51 % | |||
Total Interest-bearing deposits | 5,025,353 | 0.24 % | 5,301,126 | 0.22 % | |||
Securities sold under repurchase agreements | 47,912 | 0.10 % | 67,872 | 0.12 % | |||
Short-term borrowings | 3,498 | 3.16 % | 8,425 | 0.19 % | |||
Long-term borrowings | 20,535 | 2.06 % | 23,139 | 2.00 % | |||
Junior subordinated debt securities | 54,413 | 3.79 % | 64,103 | 3.05 % | |||
Total Borrowings | 126,358 | 2.09 % | 163,539 | 1.54 % | |||
Total Interest-bearing Liabilities | 5,151,711 | 0.28 % | 5,464,665 | 0.26 % | |||
Noninterest-bearing liabilities | 2,890,375 | 2,693,530 | |||||
Shareholders' equity | 1,186,427 | 1,179,403 | |||||
Total Liabilities and Shareholders' Equity | $9,228,513 | $9,337,598 | |||||
Net Interest Margin(8) | 3.58 % | 3.25 % | |||||
S&T Bancorp, Inc. | |||||||
2022 | 2022 | 2021 | |||||
Third | Second | Third | |||||
(dollars in thousands) | Quarter | Quarter | Quarter | ||||
Nonperforming Loans (NPL) | |||||||
Commercial loans: | % NPL | % NPL | % NPL | ||||
Commercial real estate | $8,556 | 0.27 % | $15,783 | 0.49 % | $56,400 | 1.71 % | |
Commercial and industrial | 3,847 | 0.22 % | 4,454 | 0.26 % | 38,581 | 2.27 % | |
Commercial construction | 384 | 0.10 % | 864 | 0.21 % | 4,053 | 0.75 % | |
Total Nonperforming Commercial Loans | 12,787 | 0.24 % | 21,101 | 0.40 % | 99,034 | 1.83 % | |
Consumer loans: | |||||||
Residential mortgage | 7,357 | 0.70 % | 8,137 | 0.83 % | 9,172 | 1.03 % | |
Home equity | 2,216 | 0.34 % | 2,281 | 0.37 % | 2,917 | 0.53 % | |
Installment and other consumer | 417 | 0.33 % | 256 | 0.21 % | 189 | 0.19 % | |
Total Nonperforming Consumer Loans | 9,990 | 0.54 % | 10,674 | 0.61 % | 12,278 | 0.79 % | |
Total Nonperforming Loans | $22,777 | 0.32 % | $31,775 | 0.45 % | $111,312 | 1.60 % | |
2022 | 2022 | 2021 | ||||
Third | Second | Third | ||||
(dollars in thousands) | Quarter | Quarter | Quarter | |||
Loan Charge-offs (Recoveries) | ||||||
Charge-offs | $1,239 | $7,678 | $4,207 | |||
Recoveries | (529) | (4,666) | (616) | |||
Net Loan Charge-offs | $710 | $3,012 | $3,591 | |||
Net Loan Charge-offs (Recoveries) | ||||||
Commercial loans: | ||||||
Commercial real estate | $304 | ($125) | $3,652 | |||
Commercial and industrial | 80 | 2,712 | (277) | |||
Commercial construction | — | — | 54 | |||
Total Commercial Loan Charge-offs | 384 | 2,587 | 3,429 | |||
Consumer loans: | ||||||
Residential mortgage | 41 | 13 | 2 | |||
Home equity | 111 | 6 | 37 | |||
Installment and other consumer | 174 | 406 | 123 | |||
Total Consumer Loan Charge-offs | 326 | 425 | 162 | |||
Total Net Loan Charge-offs | $710 | $3,012 | $3,591 |
S&T Bancorp, Inc. | ||||||
Nine Months Ended September 30, | ||||||
(dollars in thousands) | 2022 | 2021 | ||||
Loan Charge-offs (Recoveries) | ||||||
Charge-offs | $9,899 | $19,477 | ||||
Recoveries | (8,213) | (2,601) | ||||
Net Loan Charge-offs | $1,686 | $16,876 | ||||
Net Loan Charge-offs | ||||||
Commercial loans: | ||||||
Commercial real estate | $356 | $10,945 | ||||
Commercial and industrial | 285 | 5,431 | ||||
Commercial construction | (1) | 51 | ||||
Total Commercial Loan Charge-offs | 640 | 16,427 | ||||
Consumer loans: | ||||||
Residential mortgage | 135 | 17 | ||||
Home equity | 97 | 279 | ||||
Installment and other consumer | 814 | 153 | ||||
Total Consumer Loan Charge-offs | 1,046 | 449 | ||||
Total Net Loan Charge-offs | $1,686 | $16,876 | ||||
2022 | 2022 | 2021 | ||||
Third | Second | Third | ||||
(dollars in thousands) | Quarter | Quarter | Quarter | |||
Asset Quality Data | ||||||
Nonperforming loans | $22,777 | $31,775 | $111,312 | |||
OREO | 6,022 | 7,046 | 13,370 | |||
Total nonperforming assets | 28,799 | 38,821 | 124,682 | |||
Troubled debt restructurings (nonaccruing) | 3,860 | 4,010 | 14,033 | |||
Troubled debt restructurings (accruing) | 8,925 | 9,338 | 13,782 | |||
Total troubled debt restructurings | 12,785 | 13,348 | 27,815 | |||
Nonperforming loans / total loans | 0.32 % | 0.45 % | 1.60 % | |||
Nonperforming assets / total loans plus OREO | 0.41 % | 0.55 % | 1.78 % | |||
Allowance for credit losses / total portfolio loans | 1.40 % | 1.39 % | 1.55 % | |||
Allowance for credit losses / total portfolio loans excluding PPP | 1.41 % | 1.40 % | 1.60 % | |||
Allowance for credit losses / nonperforming loans | 438 % | 309 % | 97 % | |||
Net loan charge-offs (recoveries) | $710 | $3,012 | $3,590 | |||
Net loan charge-offs (recoveries) (annualized) / average loans | 0.04 % | 0.17 % | 0.21 % | |||
Nine Months Ended September 30, | ||||||
(dollars in thousands) | 2022 | 2021 | ||||
Asset Quality Data | ||||||
Net loan charge-offs | $1,686 | $16,875 | ||||
Net loan charge-offs (annualized) / average loans | 0.03 % | 0.32 % | ||||
S&T Bancorp, Inc. | ||||||
Definitions and Reconciliation of GAAP to Non-GAAP Financial Measures: | ||||||
2022 | 2022 | 2021 | ||||
Third | Second | Third | ||||
(dollars in thousands) | Quarter | Quarter | Quarter | |||
(1) Tangible Book Value (non-GAAP) | ||||||
Total shareholders' equity | $1,153,181 | $1,178,358 | $1,201,681 | |||
Less: goodwill and other intangible assets, net of deferred tax liability | (377,961) | (378,259) | (379,218) | |||
Tangible common equity (non-GAAP) | $775,220 | $800,099 | $822,463 | |||
Common shares outstanding | 39,013 | 39,149 | 39,368 | |||
Tangible book value (non-GAAP) | $19.87 | $20.44 | $20.89 | |||
(2) Return on Average Tangible Shareholders' Equity (non-GAAP) | ||||||
Net income (annualized) | $147,781 | $115,750 | $109,492 | |||
Plus: amortization of intangibles (annualized), net of tax | 1,181 | 1,197 | 1,369 | |||
Net income before amortization of intangibles (annualized) | $148,962 | $116,947 | $110,861 | |||
Average total shareholders' equity | $1,185,162 | $1,177,550 | $1,198,641 | |||
Less: average goodwill and other intangible assets, net of deferred tax liability | (378,154) | (378,453) | (379,443) | |||
Average tangible equity (non-GAAP) | $807,008 | $799,097 | $819,198 | |||
Return on average tangible shareholders' equity (non-GAAP) | 18.46 % | 14.63 % | 13.53 % | |||
(3) PPNR / Average Assets (non-GAAP) | ||||||
Income before taxes | $46,427 | $36,196 | $33,928 | |||
Plus: Provision for credit losses | 2,498 | 3,204 | 3,388 | |||
Total | $48,925 | $39,400 | $37,316 | |||
Total (annualized) (non-GAAP) | $194,106 | $158,034 | $148,051 | |||
Average assets | $9,009,369 | $9,225,591 | $9,494,184 | |||
PPNR / Average Assets (non-GAAP) | 2.15 % | 1.71 % | 1.56 % | |||
(4) Efficiency Ratio (non-GAAP) | ||||||
Noninterest expense | $49,633 | $48,424 | $47,241 | |||
Net interest income per consolidated statements of net income | 83,798 | 75,194 | 68,711 | |||
Plus: taxable equivalent adjustment | 521 | 506 | 557 | |||
Net interest income (FTE) (non-GAAP) | $84,319 | $75,700 | $69,268 | |||
Noninterest income | 14,760 | 12,630 | 15,846 | |||
Less: net gains on sale of securities | (198) | — | — | |||
Net interest income (FTE) (non-GAAP) plus noninterest income | $98,881 | $88,330 | $85,114 | |||
Efficiency ratio (non-GAAP) | 50.19 % | 54.82 % | 55.50 % | |||
S&T Bancorp, Inc. | ||||||
Nine Months Ended September 30, | ||||||
(dollars in thousands) | 2022 | 2021 | ||||
(5) Return on Average Tangible Shareholders' Equity (non-GAAP) | ||||||
Net income (annualized) | $127,350 | $117,477 | ||||
Plus: amortization of intangibles (annualized), net of tax | 1,217 | 1,409 | ||||
Net income before amortization of intangibles (annualized) | $128,567 | $118,886 | ||||
Average total shareholders' equity | $1,186,427 | $1,179,403 | ||||
Less: average goodwill and other intangible assets, net of deferred tax liability | (378,454) | (379,788) | ||||
Average tangible equity (non-GAAP) | $807,973 | $799,615 | ||||
Return on average tangible shareholders' equity (non-GAAP) | 15.91 % | 14.87 % | ||||
(6) PPNR / Average Assets (non-GAAP) | ||||||
Income before taxes | $118,680 | $108,444 | ||||
Plus: Provision for credit losses | 5,190 | 9,087 | ||||
Total | $123,870 | $117,531 | ||||
Total (annualized) (non-GAAP) | $165,614 | $157,139 | ||||
Average assets | $9,228,513 | $9,337,598 | ||||
PPNR / Average Assets (non-GAAP) | 1.79 % | 1.68 % | ||||
(7) Efficiency Ratio (non-GAAP) | ||||||
Noninterest expense | $145,471 | $138,736 | ||||
Net interest income per consolidated statements of net income | 226,725 | 207,674 | ||||
Plus: taxable equivalent adjustment | 1,520 | 1,806 | ||||
Net interest income (FTE) (non-GAAP) | $228,245 | $209,480 | ||||
Noninterest income | 42,616 | 48,593 | ||||
Less: net gains on sale of securities | (198) | (29) | ||||
Net interest income (FTE) (non-GAAP) plus noninterest income | $270,663 | $258,044 | ||||
Efficiency ratio (non-GAAP) | 53.75 % | 53.75 % | ||||
(8) Net Interest Margin Rate (FTE) (non-GAAP) | ||||||
Interest income and dividend income | $237,543 | $218,127 | ||||
Less: interest expense | (10,818) | (10,453) | ||||
Net interest income per consolidated statements of net income | $226,725 | $207,674 | ||||
Plus: taxable equivalent adjustment | 1,520 | 1,806 | ||||
Net interest income (FTE) (non-GAAP) | $228,245 | $209,480 | ||||
Net interest income (FTE) (annualized) | $305,163 | $280,074 | ||||
Average interest-earning assets | $8,521,873 | $8,609,284 | ||||
Net interest margin - (FTE) (non-GAAP) | 3.58 % | 3.25 % | ||||
S&T Bancorp, Inc. | ||||||
Definitions and Reconciliation of GAAP to Non-GAAP Financial Measures: | ||||||
2022 | 2022 | 2021 | ||||
Third | Second | Third | ||||
(dollars in thousands) | Quarter | Quarter | Quarter | |||
(9) Tangible Common Equity / Tangible Assets (non-GAAP) | ||||||
Total shareholders' equity | $1,153,181 | $1,178,358 | $1,201,681 | |||
Less: goodwill and other intangible assets, net of deferred tax liability | (377,961) | (378,259) | (379,218) | |||
Tangible common equity (non-GAAP) | $775,220 | $800,099 | $822,463 | |||
Total assets | $8,935,969 | $9,103,814 | $9,436,054 | |||
Less: goodwill and other intangible assets, net of deferred tax liability | (377,961) | (378,259) | (379,218) | |||
Tangible assets (non-GAAP) | $8,558,008 | $8,725,555 | $9,056,836 | |||
Tangible common equity to tangible assets (non-GAAP) | 9.06 % | 9.17 % | 9.08 % | |||
(10) Net Interest Margin Rate (FTE) (non-GAAP) | ||||||
Interest income and dividend income | $89,835 | $77,599 | $71,769 | |||
Less: interest expense | (6,037) | (2,405) | (3,058) | |||
Net interest income per consolidated statements of net income | $83,798 | $75,194 | $68,711 | |||
Plus: taxable equivalent adjustment | 521 | 506 | 557 | |||
Net interest income (FTE) (non-GAAP) | $84,319 | $75,700 | $69,268 | |||
Net interest income (FTE) (annualized) | $334,526 | $303,633 | $274,812 | |||
Average interest-earning assets | $8,287,889 | $8,535,384 | $8,769,425 | |||
Net interest margin (FTE) (non-GAAP) | 4.04 % | 3.56 % | 3.14 % | |||
View original content to download multimedia:https://www.prnewswire.com/news-releases/st-bancorp-inc-announces-record-quarterly-eps-and-net-income-301654297.html
SOURCE S&T Bancorp, Inc.
Uncategorized
After 625 Days, The Longest Yield Curve Inversion In History
After 625 Days, The Longest Yield Curve Inversion In History
Today is a historic day, as last night – DB’s Jim Reid reminds us – we quietly…
Share this:

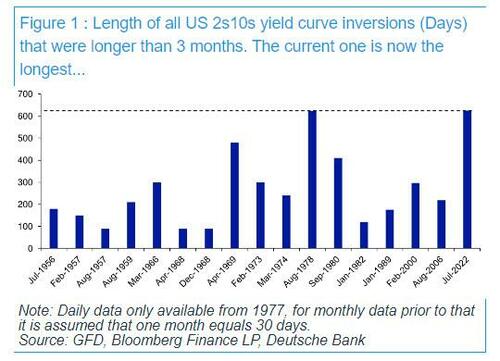
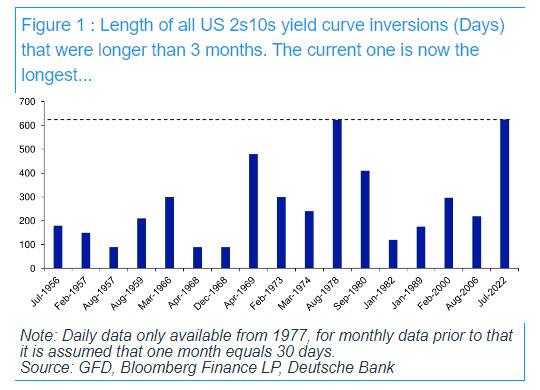
Today is a historic day, as last night - DB's Jim Reid reminds us - we quietly passed the longest continuous US 2s10s inversion in history. After the 2s10s first inverted at the end of March 2022, it has now been continuously inverted for 625 days since July 5th 2022. That exceeds the 624 day inversion from August 1978, which previously held the record.
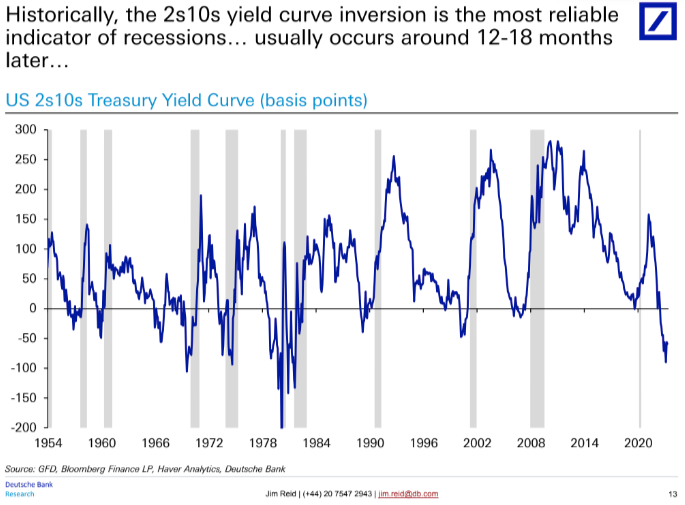
As regular readers are aware, an inverted yield curve has been the best predictor of a US downturn of any variable through history: the yield curve has always inverted before all of the last 10 US recessions, with a lag that is usually 12-18 months, but some cycles - certainly this one - take longer.... much longer.
In fact, the lack of a recession so far has prompted Red to ask - in his latest Chart of the Day note - if the inverted yield curve recession indicator has failed this cycle?
"Possibly", the DB strategist responds, "but in many ways the yield curve has already accurately predicted many of the drivers that would normally lead to a recession. However, these variables haven't then created recessionary conditions as they normally would have done." He explains:
It led, as it always does, the very sharp deterioration in bank lending standards, and led the declines in bank credit and money supply that are almost unique to this cycle. It was also at the heart of why we had some of the largest bank failures on record with SVB, Signature Bank and First Republic collapsing. A significant part of their failure was a big carry trade that went wrong when the curve inverted.
However, even with the above, a recession - according to the highly political "recession authority" known as the NBER - hasn't materialised. This is perhaps because of the following.
- When lending standards were at their tightest, the borrowing needs of the economy were low relative to previous cycles.
- Excess savings have been unusually high in this cycle (and were revised higher with the GDP revisions last September), so consumers haven't been as exposed to tight credit as they normally are.
- The Fed unveiled a huge series of measures to ensure the regional bank crisis didn't naturally unravel as it would have done in a free market or perhaps in many previous cycles.
- Whilst the Fed’s tightening has been reducing demand, the supply-side of the economy has bounced back strongly from the pandemic disruption, which has further supported growth and made this cycle unique.
So far so good, however, an inverted yield curve should ultimately be a significant headwind for an economy, as capitalism works best when there is a positive return for taking more risk with lending and investments further out the curve. As such, Reid notes, "the rational investor should be prepared to keep more of their money at the front end, or not lend long-term when the curve is inverted" as you are not giving up yield for being able to sleep at night.
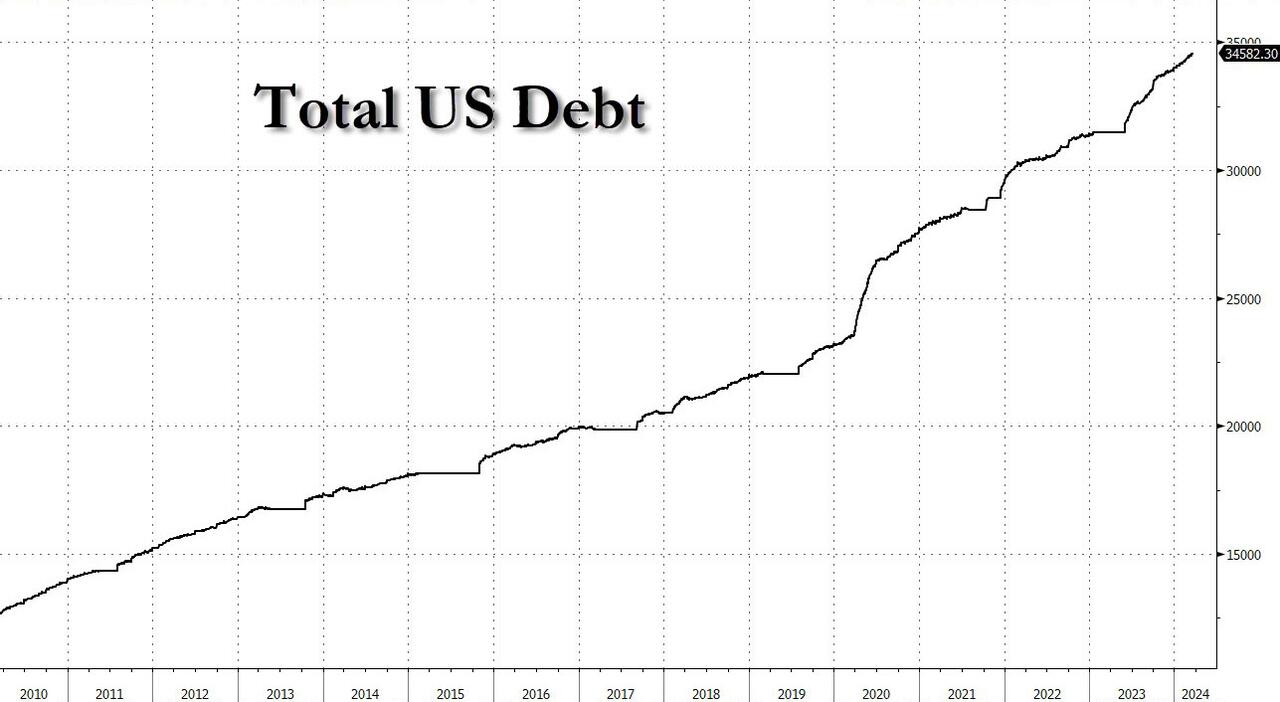
So thanks to a historic flood of fiscal stimulus and a daily orgy of new record debt as discussed earlier...
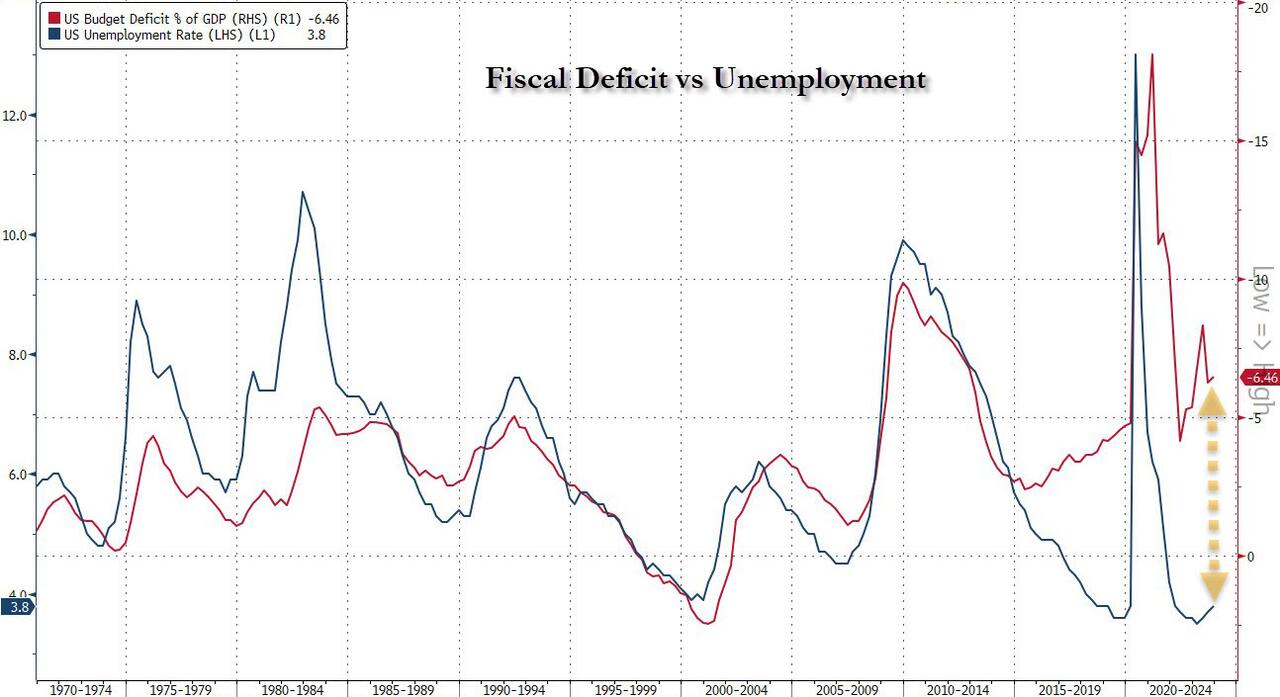
... which means that the US is now running a 6.5% deficit with unemployment near "historical lows", an unheard of event....
... the economy has not succumbed to the inverted yield curve to date, but while it remains inverted the Fed is encouraging more defensive behavior at some point if sentiment changes. As such, the DB strategist concludes that "the quicker we get back to a normal sloping yield curve the safer the system is."
Uncategorized
Did You Spot The Gorilla In The Fed’s Meeting Room?
Did You Spot The Gorilla In The Fed’s Meeting Room?
Authored by Simon White, Bloomberg macro strategist,
Monetary policy remains exceptionally…
Share this:

Authored by Simon White, Bloomberg macro strategist,
Monetary policy remains exceptionally loose given one of the fastest rate-hiking cycles seen. Pressure is likely to remain on rate expectations to move higher as the Federal Reserve reluctantly eases back on its December pivot, with the fed funds and SOFR futures curves continuing to steepen.
A famous experiment asks volunteers to watch a video of a basketball game and count the passes. Half way through, a gorilla strolls through the action. Almost no-one spots it, so focused they are on the game. As we count the dots and parse the language at this week’s Fed meeting, it’s easy miss the fact that policy overall remains very loose despite over 500 bps of rate hikes. The gorilla has gone by largely unnoticed.
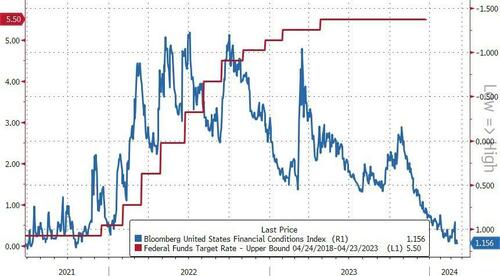
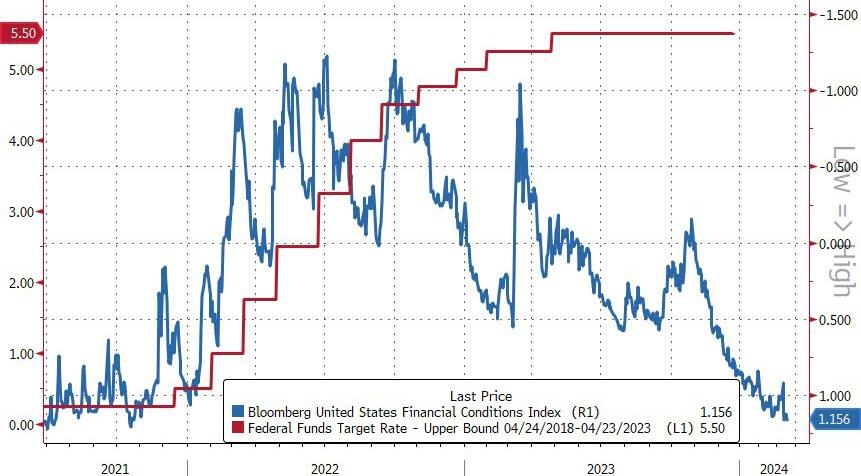
The Fed held rates steady at 5.5% as expected and continued to project three rate cuts this year. But standing back and looking at the totality of monetary policy in this cycle, we can see that - far from conditions tightening - we have instead seen one of the biggest loosening of them in decades.
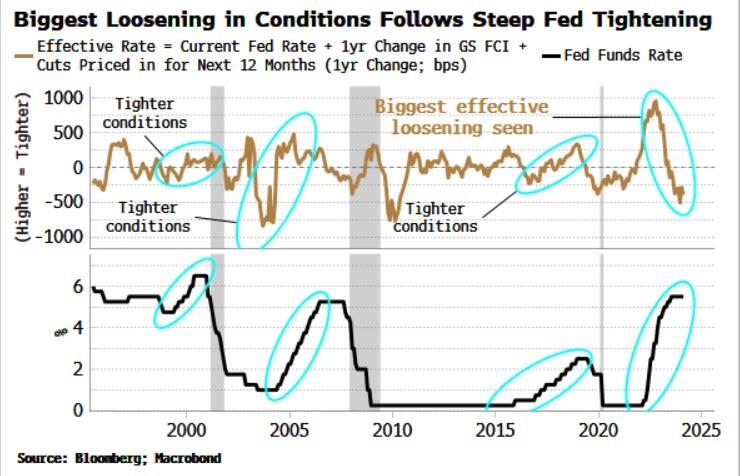
The chart below shows the Effective Fed Rate: the policy rate, plus its expected change over the next year, plus the one-year change in Goldman Sachs’ Financial Conditions Index, which is calibrated to convert the move in stocks, equity volatility, credit spreads and so on to an equivalent change in the Fed’s rate.
As we can see, in the three prior rate-hiking cycles the Effective Rate tightened; this time the rate has loosened, by more than it has done in at least 30 years.
It is against this backdrop the Fed’s pivot in December is even more inexplicable. By then it had become clear that a US recession was not imminent. Yet Jay Powell did not push back on the over six cuts that were priced in for 2024.
*POWELL: WE THINK FINANCIAL CONDITIONS ARE WEIGHING ON ECONOMY
— zerohedge (@zerohedge) March 20, 2024
dude, financial conditions are easier than when you started hiking
Since then inflation and growth data have come in better than expected. Still, though, the Fed may cut rates even if there is a smidge of an opening to do so. That would likely prove to be a mistake.
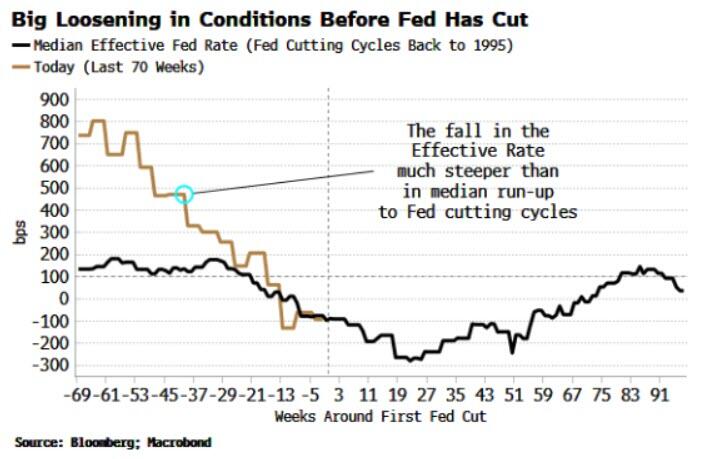
Typically the Effective Rate starts falling before the Fed makes its first cut and continues to fall after. This time around, the Effective Rate’s fall is already considerably steeper than normal – even before a cut is made. The Fed may end up spiking the punch bowl with more booze when the party is already quite tipsy.
The gorilla can be spotted in a number of different ways. Inflation has fallen, but it has done so largely despite the actions of the central bank, not because of them.
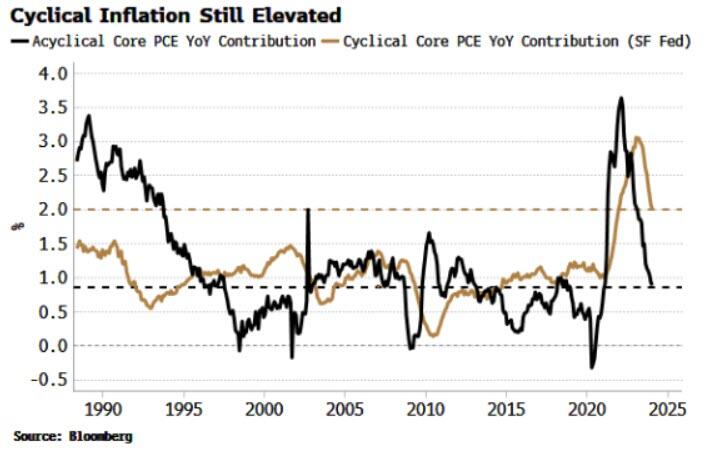
The San Francisco Fed splits core PCE inflation into a cyclical and an acyclical component. Cyclical inflation is made up of the PCE sub-components most sensitive to Fed interest rates, and acyclical is compiled from what’s left over, i.e. inflation that’s more influenced by non-Fed factors.
While acyclical inflation has fallen all the way back to its pre-pandemic average, cyclical PCE remains at its 40-year highs. The Wizard of the Fed has been pulling the rate-hiking levers, but they have done little to directly quell inflation.
It’s even worse if we account for borrowing costs. Mortgage costs were taken out of CPI in 1983 and car repayments in 1998. In a recent NBER paper by Larry Summers et al, the authors reconstruct CPI to take account of housing borrowing costs.
Inflation on this measure not only peaked much higher than it did in the 1970s, it is still running at 8%. Again, the question lingering in the air is: … and the Fed is considering cutting rates?
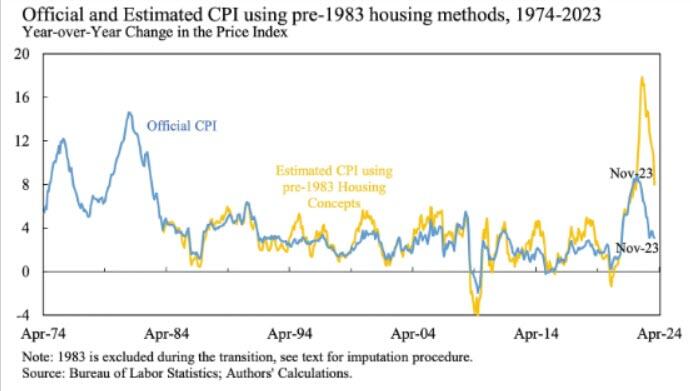
Source: NBER Working Paper 32163
(The main point of the paper is that the reason consumer sentiment indices have been depressed despite falling inflation is that they do include the impact of higher borrowing costs.)
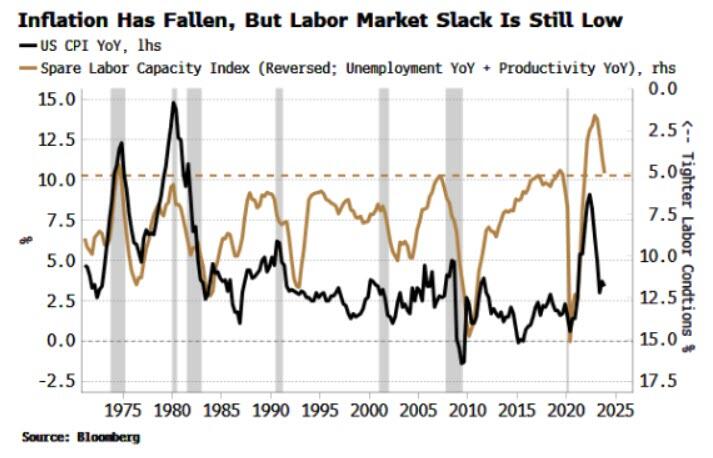
If monetary policy was operating in the way expected, we would expect to see more slack in the economy. Yet this has signally failed to happen. The index of spare labor capacity – composed of the unemployment rate and productivity - has fallen only marginally, and remains stuck at 50-year highs.
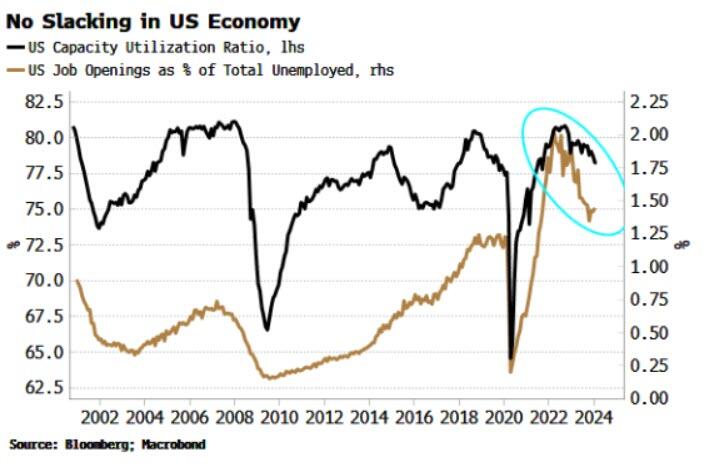
Other measures of slack, including capacity utilization and job openings as a percentage of the unemployed are still near highs or remain historically very elevated. Under this backdrop, a Fed cut looks distinctly unwise.
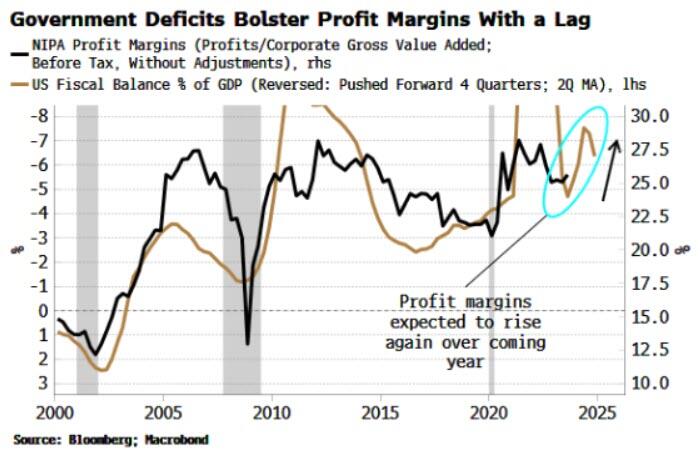
Why did we not see a bigger rise in unemployment or drop in job openings despite the steep rate-hiking cycle? In short, massive government deficits allowed job hoarding.
The Kalecki-Levy equation illustrates the link between corporate profits and private and foreign-sector savings. Simply put, the more the household or government sectors dissave, i.e. spend, the higher are profit margins.
In this cycle, it has been the government’s dissaving that has allowed the corporate sector in aggregate to grow profits and - capitalizing on monopolization and on the unique economic disruption seen in the wake of the pandemic - expand profit margins.
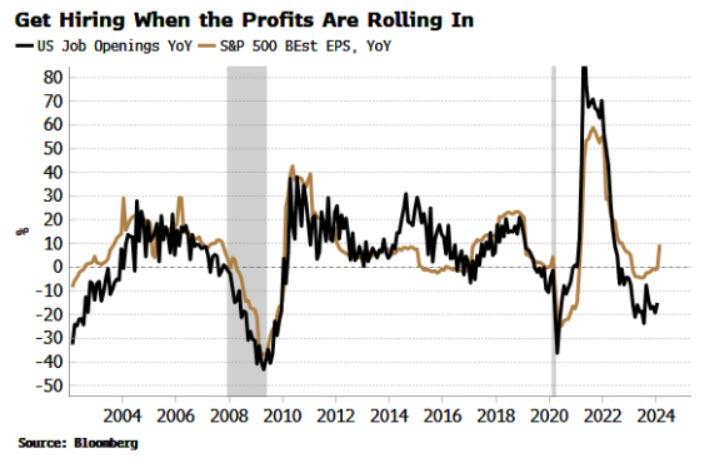
It’s for the same reason that EPS growth has bounced back. (Buybacks also play a part here, but they too tend to happen when companies’ profits are growing, which is much easier when the government is spending like a drunken sailor.) As the chart below shows, there is a strong relationship between EPS and job openings, with EPS growth recently turning back up.
With such little movement on slack, no wonder the fall in inflation was due to factors outside of the Fed’s direct influence, most notably China’s glacial recovery. But that leaves markets in an increasingly precarious spot.
Inflation likely lulled the Fed into a false in of security when it performed its policy pirouette in December. But as was clear then and is clear now, this CPI movie isn’t over yet. Furthermore, any recession the Fed may have been wanting to circumvent continues to look off the cards for the next 3-6 months.
Yet the bank may still cut rates, on limited pretext, so confident they sounded last year that they would. That will inflame stock and other asset-bubble risks even more, at a time when we already have bitcoin making new highs and a dog “wif” a hat buying ad space on the Las Vegas Sphere.
Gorillas playing basketball is a very odd thing; the Fed cutting rates before the last quarter of this year would be even odder. Before then, though, markets are likely to try to re-impose some sobriety by reducing or eliminating the number of rate cuts priced in.
Uncategorized
Futures, Global Stocks Soar After Dovish Powell Greenlights Meltup
Futures, Global Stocks Soar After Dovish Powell Greenlights Meltup
Futures and global stocks are soaring and building on Wednesday’s powerful…
Share this:

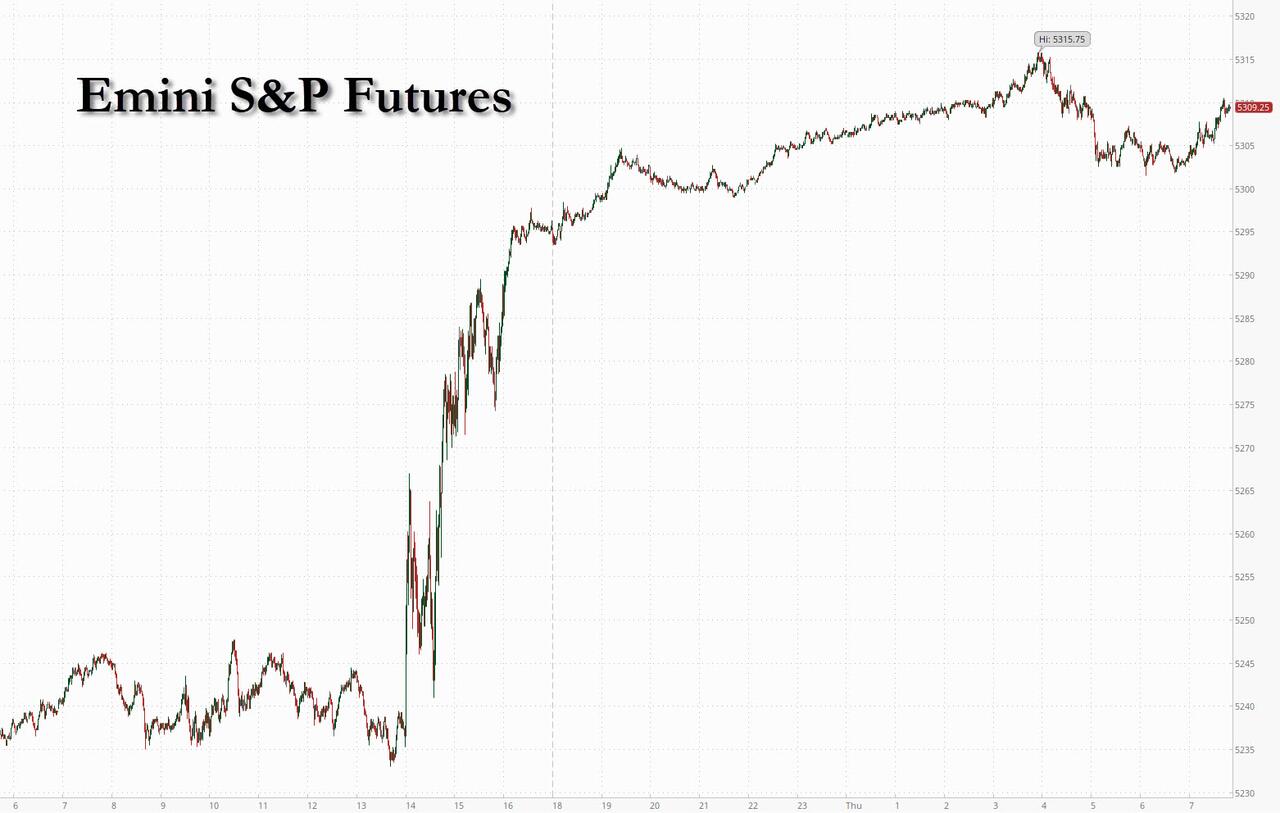
Futures and global stocks are soaring and building on Wednesday’s powerful gains after the Fed signaled expectations for three rate cuts this year and said inflation eased substantially while Powell greenlit the next big pre-election leg to the rally with dovish press conference comments that suggested the Fed has all but raised its inflation target to 3%. Both Tech and Small-caps are outperforming; while all of the Mag 7 are higher pre-mkt ex-AAPL which was hit on some negative regulatory headlines (AAPL shares have been a funding short for the group). As of 8:00am, S&P futures were 0.4% higher, trading just above 5,300 while Nasdaq futures up 0.8%, both in record territory. 10Y Treasury yields are lower, trading around 4.22% are the curve bull flattens while the USD trades higher after a shock rate cut by the SNB sent the swiss franc plunging. Today’s macro data focus includes flash PMIs, leading index, existing home sales, and jobless data. Powell flagged that a weakening labor market is cue for when to cut rates but did not indicate which data release is the most impactful but in the 5 years leading into COVID, weekly claims averaged 244k and today consensus is 213k.
In premarket trading, Micron shares surged 18%, lifting peers with it, after the maker of computer memory chips gave a 3Q forecast that was much stronger than expected. Chip equipment makers also gain after Micron said it plans to boost capital spending in fiscal 2025: Western Digital (WDC US) +6.7%, Seagate Technology (STX US) +1.2%; chip equipment makers Applied Materials (AMAT US) +3.4%, Lam Research (LRCX US) +3.1%. Here are some other notable premarket movers:
- Astera Labs shares rise 5.6%, set to extend Wednesday’s 72% gain. The semiconductor connectivity company’s initial public offering topped expectations to raise $713 million, adding momentum to AI-related stocks and a listings rebound.
- Broadcom shares gain 2.7% as analysts were positive about the chipmaker’s opportunities following its AI event. Cowen raised its rating to outperform from market perform.
- Guess shares advance 12% after the clothing company reported 4Q adjusted earnings per share and sales above consensus estimates.
- Li Auto ADRs fall 6.8% after the Chinese EV maker reduced its 1Q vehicle deliveries target, citing lower-than-expected order intake. CEO Li Xiang said the firm’s operating strategy for its newly launched Mega model was “mis-paced.”
Stock optimism was reignited after Federal Reserve policymakers kept their outlook for three cuts this year, despite a recent rebound in price pressures. While Chair Jerome Powell continued to highlight that officials would like to see more evidence prices are coming down, he also said it will be appropriate to start easing “at some point this year.” As part of the dovish hurricane response, treasuries advanced, lowering the 10-year yield by four basis points, while the dollar posted small moves. Brent crude traded around $86 a barrel and Bitcoin held at about $67,000. Gold rallied above $2,200 an ounce for the first time and a gauge of emerging-market stocks climbed the most since December.
While the Fed decision surprised some - especially the bears - there were more central bank shockers overnight, notably Taiwan which unexpected hiked 25bps to 2.00% and from the SNB which shockingly cut rates, sending the Swiss franc tumbling. The franc fell more than 1% against the dollar after the SNB lowered its key rate by 25 basis points in a move only a small minority of economists anticipated.
The decision to cut by Swiss policymakers was the first such reduction for one of the world’s 10 most-traded currencies since the pandemic abated.
“This signals to the world that we have turned a corner,” said Philipp Hildebrand, vice chairman at BlackRock and former Chairman of the SNB. “Central banks are easing and the question is where does all this settle in the long term.”
The Stoxx 600 traded up 0.4% after hitting a record earlier in the session. Mining and real estate stocks lead gains, while the health care sector lags. Equities in Europe paired some of their gains after euro-area manufacturing data missed estimates. S&P Global’s purchasing managers’ index showed sustained weakness in Germany and France — the bloc’s top two economies — even as overall private-sector activity for the euro-area rose to a nine-month high in March. Here are some of the most notable premarket movers:
- Chip equipment stocks lead a rally in European tech stocks after the US Fed maintained its outlook for interest-rate cuts, and US firm Micron signaled it will increase capex next year
- Glencore rises as much as 4% as it eyes a stake in Indonesian miner Harita Nickel, a sign of growing interest in the country’s fast-expanding nickel sector
- Argenx gains as much as 12% after a rival for the biotech firm said a phase 3 Luminesce study of Enspryng as an investigational treatment for generalized myasthenia gravis failed
- Remy Cointreau rises as much as 6.1% after Deutsche Bank lifts its recommendation on the stock to buy from hold, with inventory levels seen materially ahead of current market value
- 3i Group shares gain as much as 4.4%, reaching record highs, after its Action unit reported 21% like-for-like sales growth vs. a year earlier, which analysts note shows continued strength
- Energean rises as much as 6.1% as the company reiterated its guidance for this year. Analysts say markets are pleased that operations in Israel have so far not been disrupted
- Esso surged as much as 23%, its biggest intraday gain since April 2022, after the French unit of Exxon Mobil announced a €12-a-share special dividend as part of its full-year report
- Pernod Ricard rises as much as 2.9% as Deutsche Bank upgrades to hold from sell, saying the cognac maker is now “broadly fairly valued,” also seeing a fairly evenly balanced risk profile
- M&G gains as much as 4.2% as the pension fund and asset manager sees better-than-expected institutional flows and operating profit for the full year period
- Next gains as much as 5.9% after full-year results beat estimates and 2025 guidance was maintained. Analysts described the earnings as “pleasing”
- Douglas falls as much against its IPO price as the German perfume retailer began trading in Frankfurt, trading at €23.8 as of 11am, down from the IPO price of €26.
- Nemetschek falls as much as 5.4% after refining its 2024 guidance first proposed in March last year. Analysts deemed Ebitda margin and revenue growth targets cautious
Earlier in the session, the MSCI Asia Pacific Index advanced as much as 2.2%, the most since Nov. 15, with Taiwan Semiconductor, Toyota and Samsung among the biggest contributors to the move. The bullish session echoes US gains after Fed policymakers kept their outlook for three cuts in 2024 and moved toward slowing the pace of reducing their bond holdings, suggesting they aren’t alarmed by a recent rebound in price pressures. Sentiment on Chinese tech stocks got a lift after Tencent Holdings Ltd. announced plans to more than double its stock buyback program and boosted dividends. The region’s semiconductor shares gained after Micron Technology Inc. gave a surprisingly strong revenue forecast for the current quarter, buoyed by demand for memory chips used in artificial intelligence applications.
“With the FOMC event risk out and market pricing roughly in line with dot plots, we think focus of Asian equity investors should return to earlier themes of AI momentum,” Chetan Seth, a strategist at Nomura Holdings Inc., wrote in a note. “We still expect a US soft landing.”
In FX,the Swiss franc sits at the bottom of the G-10 FX pile, falling 0.7% against the dollar after the Swiss National Bank surprised with a 25bps interest rate cut. The Norges Bank stood pat, as expected, prompting an uptick in the krone. The pound is little changed as investors now turn their attention to the Bank of England decision at noon UK time.
In rates, treasuries extended Wednesday’s post-Fed rally, supported by gains in UK front-end as traders fully price in 75bps of easing by Bank of England easing this year for first time since March 12. Treasury yields richer by 3bp to 5bp across the curve with gains led by belly, steepening 5s30s spread by around 1.5bp and adding to Wednesday’s sharp steepening move as additional easing was priced back into the front-end; 10-year trades around 4.23% with bunds lagging by 1bp in the sector, gilts trading broadly in line. European bonds are firmly in the green, with rate markets drawing additional support from SNB’s surprise cut. US session includes several economic indicators and 10Y TIPS auction.
In commodities, oil prices decline, with WTI falling 0.3% to trade near $81. Spot gold rises 1%.
Bitcoin climbed back to best levels at USD 68k, before paring back to around the USD 66k level.
Looking at today's calendar, economic data calendar includes 4Q current account balance, March Philadelphia Fed business outlook and weekly jobless claims (8:30am), March preliminary S&P Global manufacturing and services PMIs (9:45am), February leading index and existing home sales (10am). Fed members scheduled to speak include Barr at 12pmTo contact the reporter on this story:
Market Snapshot
- S&P 500 futures up 0.5% to 5,311.25
- STOXX Europe 600 up 0.8% to 509.14
- MXAP up 2.0% to 178.40
- MXAPJ up 1.9% to 540.84
- Nikkei up 2.0% to 40,815.66
- Topix up 1.6% to 2,796.21
- Hang Seng Index up 1.9% to 16,863.10
- Shanghai Composite little changed at 3,077.11
- Sensex up 0.7% to 72,624.50
- Australia S&P/ASX 200 up 1.1% to 7,781.97
- Kospi up 2.4% to 2,754.86
- German 10Y yield little changed at 2.41%
- Euro down 0.2% to $1.0901
- Brent Futures up 0.5% to $86.36/bbl
- Gold spot up 0.7% to $2,202.16
- US Dollar Index up 0.19% to 103.58
Top Overnight News
- Taiwan’s central bank unexpectedly raises rates from 1.875% to 2% (the consensus was looking for rates to be unchanged). WSJ
- China’s PBOC signals an openness to additional bank reserve requirement ratio (RRR) cuts, but sounds reluctant about lowering interest rates until the Fed begins easing. BBG
- BOJ Governor Kazuo Ueda said the central bank scrapped its massive easing program this week partly to avoid the need for aggressive action later, a comment that may help market players judge his next moves. BBG
- SNB unexpectedly lowers its policy rate from 1.75% to 1.5% (the Street was looking for rates to stay unchanged) as the central bank highlights progress in the battle against inflation. RTRS
- Eurozone flash PMIs are mixed, with a soft manufacturing figure (45.7, down from 46.5 in Feb and below the Street’s 47 forecast) and a decent services number (51.1, up from 50.2 in Feb and above the Street’s 50.5 forecast). BBG
- AMZN is focusing its attention on combating Shein and Temu as the firm views both as larger competitive threats than Walmart and Target. WSJ
- Korean Air Lines passed Boeing over to order 33 Airbus SE A350 wide-body jets in a $14 billion deal. And Japan Airlines said it’ll buy 11 Airbus A321neos — alongside some Boeings — breaking the US planemaker’s hold as its sole single-aisle supplier. BBG
- The DOJ will sue Apple in federal court as soon as today for alleged antitrust violations, people familiar said, escalating the crackdown on Big Tech by regulators in the US and abroad. Apple is accused of blocking rivals from accessing hardware and software features of its iPhones. Shares slipped premarket. BBG
- MU +17% pre mkt after reporting strong EPS upside in FQ2/Feb at 42c (the Street was looking for a 24c loss), w/the beat driven by better sales ($5.82B vs. the Street $5.35B), higher gross margins (20% vs. the Street 13/5%), and superior operating margins (pos. 3.5% vs. the Street’s neg. 4.4% forecast). The FQ3 guide was very. Mgmt said supply/demand conditions are improving thanks to a “confluence of factors”, including strong AI server demand, a healthier demand backdrop in most other end markets (it sees PCs growing in the low-single digits this year, w/AI PCs becoming a larger factor in 2025, while smartphones grow in the low/mid-single digits), and supply reductions across the industry. RTRS
Central Banks
- SNB cut its Policy Rate by 25bps to 1.50% (exp. 1.75%); FX language reiterated "willing to be active in the foreign exchange market as necessary", Ready to intervene in FX; Loosening permitted by inflation progress.
- SNB Chairman Jordan says that rates were able to be lowered as the fight against inflation has been effective. Says we give no forward guidance on future interest rates and will see where we are in 3 months time. Says we remain willing to sue balance to be active on forex market and could be sales of purchases; situation in ME is tricky; neither sales of forex are in focus at the moment
- Norges Bank maintains its Key Policy Rate at 4.50% as expected; reiterates guidance that "policy rate will likely need to be maintained at the current level for some time ahead".
- Norges Bank Governor Bache says the rate path indicates a cut is most likely in September, second rate cut indicated by end of Q1'25
- Taiwan hikes its benchmark interest rate to 2.0% from 1.875%
A more detailed look at global markets courtesy of Newsquawk
APAC stocks were mostly underpinned after the fresh record levels on Wall St post-dovish FOMC where the Fed maintained the projection for 3 rate cuts in 2024 and Powell downplayed recent hot inflation data. ASX 200 strengthened with sentiment also helped by a stellar jobs report and a fall in unemployment, while gold miners outperformed after the precious metal rose above USD 2,200/oz to a new all-time high. Nikkei 225 rallied from the open to unprecedented levels north of 40,800 despite recent hawkish source reports. Hang Seng and Shanghai Comp. were mixed in which the Hong Kong benchmark rallied to just shy of the 17,000 level amid strength in the property sector and as the Fed projection for three rate cuts keeps similar action on the table for the HKMA. Conversely, the mainland lagged as the PBoC injected the least amount of funds in its open market operations since August last year despite the PBoC's Deputy Governor reaffirming that China's monetary policy has ample room and there is still room for cutting RRR
Top Asian News
- HKMA maintained its base rate unchanged at 5.75%, as expected. HKMA said financial and monetary markets in Hong Kong continue to operate in a smooth and orderly manner, while it added that the HKD exchange rate remains stable and Hong Kong dollar interbank rates might remain high for some time.
- PBoC Deputy Governor Changneng Xuan said they will promote effective investment and help resolve excess capacity, while he added that China's monetary policy has ample room and there is still room for cutting RRR. PBoC Deputy said he expects China's nominal economic growth to be around 8% in 2024 and will maintain appropriate growth in credit and total social financing, while they will guide banks to lower deposit rates and lower financing costs, support consumption and investment, as well as promote a rebound in prices.
- China's Vice Finance Minister said fiscal policy will provide the necessary support for achieving the 2024 growth target and China's government debt is at an appropriate level, while he said China has continued to reduce the overall level of tariffs, which has now been reduced to 7.3% and is relatively low in the world, according to Reuters and Global Times.
- China state planner vice chair said they will speed up approval for investment projects and that total bond funds for government investment will exceed CNY 6tln, while they will step up support for private investment and encourage private firms to participate in infrastructure investment projects, according to Reuters.
- BoJ Governor Ueda said the BoJ is expected to maintain an accommodative monetary policy for the time being and accommodative monetary policy is likely to underpin the economy, while he added that cost-push pressure on inflation is dissipating but service prices continue to rise moderately and the preliminary wage negotiation outcome tends to be revised down but even so, they thought the final outcome would be a fairly strong number. BoJ Governor Ueda said as they end massive stimulus, they will likely gradually shrink the balance sheet and at some point reduce JGB purchases but at present, they have no clear idea regarding the timing of reducing JGB buying and scaling back the size of the balance sheet. Furthermore, he said they are not immediately thinking of selling BoJ's ETF holdings and will take plenty of time examining how to reduce ETF holdings.
- BoJ is reportedly seen weighing the next rate hike in July or October as the Yen weakens, according to Nikkei. A source noted that additional hikes are of course on the table and that an early hike leaves room for the BoJ to consider rolling out another increase before the end of the year, while the timeline would keep the BoJ coming off like they are rushing to hike rates. Furthermore, it was stated that a growing number see a July rate boost as another possibility if a weak yen raises the price of imports and accelerates inflation, forcing the BoJ to step in. It was earlier reported that the Yen's decline appears to be raising little alarm at the BoJ for now which was to be expected given that Governor Ueda is maintaining an accommodative stance on policy, according to a source at the BoJ cited by Nikkei. However, it was noted that some at Japan's Finance Ministry are wary of rapid fluctuations in the currency market driven by speculative trades.
- Fitch expects BoJ to raise policy rate to 0.25% by 2025.
- CNOOC (600938 CH) FY (CNY) IFRS Net 123.84bln (exp. 130.33bln); In 2024, will insist on increasing oil and gas reserves and production; ongoing recovery trajectory in China will support demand for oil and gas
European equities, Stoxx600 (+0.4%) are entirely in the green, with sentiment lifted following a post-FOMC equity rally in the US & APAC. Following the release of poor French PMIs and bleak German commentary, equities have edged off best levels. European sectors are firmer; Tech takes the top spot, with optimism permeating within the sector after strong Micron results and Basic Resources benefits from broader strength in base metal prices. US equity futures (ES +0.4%, NQ +0.7%, RTY +0.6%) are stronger, in a continuation of the prior day's post-FOMC rally; Micron (+16% pre-market) is soaring after beating on EPS/Revenue and lifting guidance.
Top European News
- EU New car registrations (Feb): +10.1% (prev. 12.1%); battery electric market share 12% (prev. 10.9%). EU27 New Car Registrations by Manufacturer (Y/Y). Volkswagen (VOW3 GY) +8.7%; Stellantis (STLAM IM/STLAP FP) +11.2%; Renault (RNO FP) +5.9%; BMW (BMW GY) +7.0%; Mercedes Benz Group (MBG GY) -2.1%; Volvo Cars (VOLCAR SS) +33.9%. (acea)
- Portugal's President named centre-right democratic alliance leader Luis Montenegro as the new PM, according to Reuters.
FX
- USD is attempting to claw back post-FOMC losses with some help via EZ-PMI releases. DXY still has some way to go to close the gap to yesterday's best at 104.14. High print for today at 103.66 coincides with the 200DMA.
- EUR has been dragged lower by EZ PMIs which were indicative of the composite figure approaching neutral territory; EUR/USD on a 1.09 handle after slipping to a low of 1.0888.
- GBP is a touch softer vs. the USD but near post-FOMC highs which saw Cable peak at 1.2803. UK PMIs saw services and composite miss but the manufacturing print edge closer to neutral. Focus ahead is firmly on the BoE.
- JPY pausing for breath vs. the USD after vaulting to a high of 151.81 yesterday, which saw the pair stop shy of the 2023 high at 151.91 and 2022 peak at 151.94.
- AUD the best performer across the majors following encouraging jobs metrics. AUD/USD as high as 0.6634 but unable to breach last week's best at 0.6638. NZD marginally higher vs. USD despite the surprise contraction in Q4 GDP data.
- CHF is the clear laggard across the majors as the SNB surprises with a 25bps rate cut and reiterates a willingness to intervene in the FX market. EUR/CHF as been as high as 0.9782 to its highest level since July last year; 0.9842 was the high that year.
- An unchanged announcement from the Norges Bank but one which sparked NOK strength given the repo path has not formalised a Q4-2024 rate cut as some were hoping for. As such, EUR/NOK slipped from 11.5300 to 11.4857. However, a modest dovish move was seen on Governor Bache indicating the first cut is "likely" in September.
- PBoC set USD/CNY mid-point at 7.0942 vs exp. 7.1792 (prev. 7.0968).
Fixed Income
- Choppy price action for Bunds owing to varied PMIs from France and Germany. The former sparked a dovish reaction with Bunds lifting from 131.90 to 132.72, whilst the German metrics sent Bunds back down to 131.85, though downside was shortlived given the Manuf. miss and SNB rate cut.
- USTs are underpinned by the dovish fixed narrative which is dictating EGBs/Gilts into the BoE post-SNB/PMIs. Action which has taken USTs to a 110-24+ high, eclipsing the post-FOMC 110-22 peak.
- Gilt price action is in-fitting with EGBs and as such approached their own PMIs with gains of around 30 ticks on the session. A release which saw two-way action with Gilts initially slipping to 99.24 (strong Manuf.) before rebounding to 99.46 (Comp. & Serv. miss); BoE up next.
- Spain sells EUR vs exp. EUR 5.5-6.5bln 2.50% 2027, 5.75% 2032, 3.45% 2043 Bono
- France sells EUR 12.498bln vs exp. EUR 11-12.5bln 2.50% 2027, 2.75% 2029, and 1.50% 2031 OAT
Commodities
- Crude was initially firmer after the Fed-induced Dollar decline coupled with broader risk appetite, and geopolitics. However, the complex then trimmed gains after PMIs for France and Germany painted a bleak economic recovery picture; Brent is now lower on the session and just shy of USD 86/bbl.
- Precious metals extend on post-Powell gains despite an attempted recovery in the Dollar, with spot gold topping USD 2,200/oz to fresh ATHs in APAC trade while spot silver gained status above USD 25.50/oz.
- Base metals are higher across the board in the after-math of the FOMC which boosted broader market sentiment.
Geopolitics
- US military said coalition forces destroyed an unmanned aerial vehicle fired by Yemen's Houthis in the Red Sea and destroyed an unmanned surface vessel on March 20th, according to Reuters.
- Australia and Britain signed a defence pact which includes a status of forces agreement and makes it easier for the respective forces to operate together in each other’s countries, while the agreement also formalises the established practice of consulting on issues that affect our sovereignty and regional security.
- "Al-Arabiya sources: Pressure on Israel to postpone the Rafah operation for at least 45 days", according to Al Arabiya; "The mediators and America rejected a preliminary Israeli proposal on the military operation in Rafah"
US Event Calendar
- 08:30: March Initial Jobless Claims, est. 213,000, prior 209,000
- March Continuing Claims, est. 1.82m, prior 1.81m
- 08:30: 4Q Current Account Balance, est. -$209b, prior -$200.3b
- 08:30: March Philadelphia Fed Business Outl, est. -2.5, prior 5.2
- 09:45: March S&P Global US Manufacturing PM, est. 51.8, prior 52.2
- March S&P Global US Services PMI, est. 52.0, prior 52.3
- March S&P Global US Composite PMI, est. 52.2, prior 52.5
- 10:00: Feb. Existing Home Sales MoM, est. -1.3%, prior 3.1%
- 10:00: Feb. Leading Index, est. -0.1%, prior -0.4%
DB's Jim Reid concludes the overnight wrap
Considering that US inflation has surprised notably on the upside this year, last night saw a remarkably relaxed Fed as Chair Powell indicated that January’s higher inflation could have been seasonal, and that February’s print had already seen improvements. The dots continued to show three cuts for 2024 and alongside a dovish-leaning press conference, this drove equities higher and yields lower, especially at the front end.
In terms of the details, the statement was little changed as the FOMC continued to see that “ it will likely be appropriate to begin dialing back policy restraint at some point this yea r” while wanting to gain “greater confidence that inflation is moving sustainably toward 2%”.
The dot plot showed the median 2024 dot unchanged at three cuts this year. This came even as 2024’s economic projections were revised higher, with real GDP growth revised up from 1.4% to 2.1%, core PCE inflation up two-tenths to 2.6%, and unemployment a tenth lower to 4.0%. Our US economists note that this forecast implies core PCE averaging 19bps a month for the rest of the year – only a little above the 2% target run rate. So a pretty Goldilocks take for now even if this was accompanied by 25bp upward revisions to the 2025-26 median dots, and a larger share of FOMC members seeing inflation risks as tilted to the upside.
Powell’s press conference also erred on the dovish side, with his comments notably suggesting that the upside inflation data for January and February did not alter the Fed’s baseline, with the inflation story “essentially the same”. He also mentioned a couple of times that unexpected labor market weakening could warrant a policy response (though the FOMC did not see this currently), while expressing no concern about the ongoing easing in financial conditions.
When asked about rate cut timing, Powell made no effort to rule out the possibility of a May move, saying the FOMC “didn't make any decisions about future meetings”. Our US economists continue to expect the first rate cut to come in June with 100bps of cuts in total this year, but with risks skewed to a more hawkish outcome. See their full reaction here.
On the balance sheet side, Powell indicated that a decision on slowing the pace of QT would come “fairly soon”. He emphasized that slowing QT did not equate to stopping it, noting that moving to a slower run-off pace could actually allow for a greater reduction in the balance sheet over time by reducing the risk of liquidity problems emerging.
Following the FOMC, futures dialled up the probability of a June cut to 84% from 66% the previous day, with 84bps of cuts now priced by year-end (+10.7bps on the day). This backdrop saw a bull steepening of the Treasury curve, as 2yr yields fell by -8.1bps while 10yr yields were down -2.0bps on the day to 4.27% (and closing near their pre-FOMC levels). This came as higher breakevens offset most of a -5.9bps decline in 10yr real yields. The 2s10s slope reached its steepest level in over month at -33.2bps. And overnight, there’s been a further decline in yields, with those on 10yr Treasuries down another -0.8bps.
Equities basked in a risk-on mood following the Fed, with the S&P 500 (+0.89%), NASDAQ (+1.25%) and Dow Jones (+1.03%) all reaching new records. Small-caps led the gains, with the Russell 2000 up +1.92%, whilst the VIX index of volatility fell to its lowest since early February (-0.78pts to 13.04).
That rally has continued in Asia overnight, with strong advances for the Nikkei (+1.97%), the Hang Seng (+1.80%) and the KOSPI (+2.18%). Moreover, US equity futures are pointing to further gains, with those on the S&P 500 up +0.40%. That comes amidst some strong data releases, as we’ve started to get the March flash PMI releases from around the world. For instance in Japan, the composite PMI rose to 52.3 in March, which is the highest it’s been since August. Likewise in Australia, the composite PMI was up to 52.4, the highest since April. And Australia also had some strong employment data for February as well, with employment up by +116.5k (vs. +40.0k expected). However, even as markets have been positive for the most part, there have been losses for Chinese equities, with the CSI 300 (-0.11%) and the Shanghai Comp (-0.14%) both seeing modest declines.
In FX, the Japanese yen (+0.32%) has strengthened against the dollar, trading at 150.90 this morning after the Nikkei newspaper reported that investors were speculating about another hike in July or October. Before the news broke out, the Japanese yen was trading at 151.91, within a whisker of its post-1990 low.
Before the Fed, European markets had struggled to gain much traction yesterday, with the STOXX 600 unchanged (-0.00%) by the close. That came as ECB President Lagarde stuck to her previous message on monetary policy, saying that “when it comes to the data that is relevant for our policy decisions, we will know a bit more by April and a lot more by June.” That’s meant investors continue to see the June meeting as the most likely for an initial rate cut, and sovereign bonds were also fairly subdued in response. So there was only a modest decline in yields across most of the continent, with those 10yr bunds (-1.8bps) and OATs (-1.1bps) falling slightly.
The main exception to that pattern was in the UK, where 10yr gilts fell by a larger -4.6bps after the latest CPI release surprised on the downside. That showed headline CPI falling to +3.4% in February (vs. +3.5% expected), which is the lowest since September 2021. Moreover, core CPI fell to a two-year low of +4.5% (vs. +4.6% expected). In turn, that led investors to dial up the chance of rate cuts this year, and the chance of a cut by the June meeting moved up from 52% on Tuesday to 58% by the close yesterday.
That inflation release comes ahead of the Bank of England’s latest policy decision today, where they’re widely expected to keep rates on hold as well. So the focus will instead be on any signals about the timing of future rate cuts, along with the vote split. In his preview (link here), our UK economist Sanjay Raja sees the risks skewed towards a dovish surprise, but thinks that the MPC will stick to its February guidance that Bank Rate is restrictive and "will need to remain restrictive for sufficiently long to return inflation to the 2% target".
Lastly, there was some marginally brighter data from the Euro Area, as the European Commission’s preliminary consumer confidence indicator rose to -14.9 in March (vs. -15.0 expected). That was the highest reading since February 2022, just before Russia’s invasion of Ukraine began.
To the day ahead now, and the main data highlight will be the flash PMIs for March. Alongside that, we’ll get the US weekly initial jobless claims, the Conference Board’s leading index for February, existing home sales for February, the Philadelphia Fed’s business outlook for March, and the Q4 current account balance. From central banks, there’s a policy decision from the Bank of England, and we’ll hear from Fed Vice Chair for Supervision Barr. Today’s earnings releases include Nike and FedEx. And in the political sphere, a summit of EU leaders is taking place in Brussels.


COVID-19 Infection Increases Risk Of Autoimmune Diseases By Up To 30 Percent: Study


ARPA-H appoints Etta Pisano to lead its Advancing Clinical Trials Readiness Initiative


After 625 Days, The Longest Yield Curve Inversion In History


Analyst revamps MicroStrategy stock price target after Bitcoin buy


Futures, Global Stocks Soar After Dovish Powell Greenlights Meltup


The positive streak of news from initial and continuing jobless claims continues


Visionary $15 million gift from Wayne & Wendy Holman to NYU Langone Health ensures continued excellence in newly named Holman Division of Endocrinology, Diabetes & Metabolism


David Baker’s lab shows generative AI can design antibodies. But are they good enough to become drugs?


Random Access Markets: The Free Market Of Information


FoxO6-mediated ApoC3 upregulation promotes hepatic steatosis and hyperlipidemia in aged rats fed a high-fat diet
-

 Spread & Containment1 week ago
IFM’s Hat Trick and Reflections On Option-To-Buy M&A
-

 Uncategorized4 weeks ago
All Of The Elements Are In Place For An Economic Crisis Of Staggering Proportions
-

 International2 weeks ago
EyePoint poaches medical chief from Apellis; Sandoz CFO, longtime BioNTech exec to retire
-

 Uncategorized1 month ago
California Counties Could Be Forced To Pay $300 Million To Cover COVID-Era Program
-

 Uncategorized4 weeks ago
Apparel Retailer Express Moving Toward Bankruptcy
-

 International2 weeks ago
Walmart launches clever answer to Target’s new membership program
-

 Uncategorized1 month ago
RFK Jr: The Wuhan Cover-Up & The Rise Of The Biowarfare-Industrial Complex
-

 Uncategorized1 month ago
GOP Efforts To Shore Up Election Security In Swing States Face Challenges