Spending Down Pandemic Savings Is an “Only-in-the-U.S.” Phenomenon
Household saving soared in the United States and other high-income economies during the pandemic, as consumers cut back on spending while government policies…
Household saving soared in the United States and other high-income economies during the pandemic, as consumers cut back on spending while government policies supported incomes. More recently, saving behavior has diverged, with the U.S. saving rate dropping below its pre-pandemic average while saving rates elsewhere have remained above their pre-pandemic averages. As a result, U.S. consumers have been spending down the “excess savings” built up during the pandemic while the excess savings abroad remain untapped. This divergent behavior helps explain why U.S. GDP has returned to its pre-pandemic trend path even as GDP levels in other high-income economies continue to run well below trend.
Free-Spending U.S. and Thrifty Foreign Consumers
Household saving, measured as the difference between disposable income and consumer spending, soared in the United States and other high-income economies during the COVID-19 pandemic. In the U.S. and Canada, stepped-up social benefit payments and other income support measures pushed incomes well above pre-pandemic trajectories, while similar measures in the euro area, United Kingdom, and Japan kept incomes near their trend paths. Meanwhile, consumption plummeted in all these economies. (Our post from two and a half years ago discusses the early stages of these developments in detail.)
The chart below shows the resulting rise in household saving as a share of disposable income. The blue bars show saving rates prior to the pandemic, measured as the 2015-19 average. The orange bars show the average saving rate for 2020-21, and the gray bars show saving rates since the start of 2022. While the pandemic was hardly over by the start of 2022, recoveries from the COVID downturn were well underway, and governments had begun to scale back income support policies.
Household Saving Rates Above Pre-Pandemic Levels Outside the U.S.
Household Saving as a Percent of Disposable Income
Percent
Sources: U.S. Bureau of Economic Analysis, Integrated Macroeconomic Accounts; Eurostat; UK National Statistical Office; Japanese Cabinet Office; Statistics Canada; authors’ calculations. Note: Data are through the second quarter of 2023 for the U.S., euro area, UK, and Canada, and through the first quarter of 2023 for Japan.
As can be seen in the chart, saving rates spiked in 2020-21 in the major high-income economies, ranging from a 6.5 percentage point increase in the euro area to a 10 percentage point jump in Canada relative to pre-pandemic averages. What’s more interesting for our present purposes is the divergence in saving behavior since 2022. While saving rates have fallen across the board relative to 2020-21, only in the United States has the rate dropped below its pre-pandemic average.
This divergence is quite stark. The average U.S. saving rate since 2022 is down some 2.5 percentage points from the 2015-19 average. Saving rates elsewhere range from slightly above pre-pandemic norms (0.5 percentage point higher in the euro area) to markedly above (3.5 percentage points higher in Canada). The same relative comparison holds in the latest quarterly data, with saving rates down from the 2015-19 average in the U.S. but up from the earlier period elsewhere.
Measuring Excess Saving
We calculate a simple “excess savings” measure to compare the increase in household resources from changes in saving behavior since the onset of the pandemic. Starting from the first quarter of 2020, the amount of excess saving is simply the difference between actual saving and what saving would have been at the 2015-19 pre-pandemic saving rates out of actual disposable income. We then sum these totals through the current period. Finally, we divide these summed amounts of excess savings by disposable income to allow comparisons across countries.
There is substantial uncertainty around this approach, as it assumes that the saving rate without the pandemic would have remained equal to the five-year pre-pandemic average. Other counterfactuals are possible. For example, the saving rate jumped to 7.6 percent in 2019, a bit more than a percentage point above the 2015-19 average. Using the 2019 rate as the benchmark would have reduced our estimate of excess savings.
The chart below shows the evolution of excess savings in the United States and other major high-income economies. The non-U.S. economies are shown as a group; figures for individual economies are weighted by their GDP, with the euro area accounting for about 60 percent of this aggregate, Japan about 20 percent, the UK about 12 percent, and Canada about 8 percent.
U.S. Consumers Are Spending Down Excess Savings
Excess Savings as a Percent of Annualized Disposable Income
Percent
Sources: U.S. Bureau of Economic Analysis, Integrated Macroeconomic Accounts; Eurostat; UK National Statistical Office; Japanese Cabinet Office; Statistics Canada; authors’ calculations. Notes: The foreign high-income series is a GDP-weighted average of the euro area, Japan, the United Kingdom, and Canada. Excess savings in Japan as a percentage of disposable income (PDI) for the second quarter of 2023 is carried over unchanged from the first quarter, since second-quarter data have not yet been released. Japan represents about 20 percent of the foreign aggregate.
Excess savings followed similar upward trajectories in the U.S. and abroad from the beginning of the pandemic through the end of 2021, reaching about 14 percent of annual disposable income ($2.6 trillion in the United States). Since then, U.S. excess savings has steadily declined, falling to 10 percent of disposable income ($1.9 trillion) by the second quarter of 2023. In sharp contrast, excess savings abroad has held flat relative to disposable income.
For the United States, this pattern matches what we saw in the first chart above: Saving rates tracked well above pre-pandemic norms in 2020-21 but have tracked below since then. Why don’t we see a further rise in the line for foreign excess savings since 2022, given that saving rates have remained above pre-pandemic values? The answer is that excess savings has continued to rise in nominal terms for all four economies, but the increase has been matched by growth in nominal disposable income.
Quantifying the Growth Implications
The chart below helps quantify the contribution to GDP growth from the drawdown in U.S. excess savings. The red line shows real consumer spending, indexed to equal 100 in 2019. The blue line shows real disposable income, also indexed to 100 in 2019. Note that making consumer spending and income equal in the index year means the gap between the two reflects changes in the saving rate since 2019. The black line shows their average trend over the five years prior to the pandemic.
U.S. Consumption Back to Trend but Income Lags
United States: Real Income and Consumption Indexes
Indexes, 2019 = 100
Sources: Bureau of Economic Analysis, Integrated Macroeconomic Accounts; authors’ calculations. Note: The average trend for consumption and income is based on growth from the fourth quarter of 2014 to the fourth quarter of 2019.
As shown in the chart, real consumption plummeted during the early stages of the pandemic but returned to trend by about the middle of 2021. Subsequent growth has hewed close to the pre-pandemic trend. Real disposable income, in contrast, spiked during the early stages of the pandemic, pushed higher by income support policies. But real income has fallen well below trend, by about 3 percentage points as of the second quarter of 2023. Data for the first two months of the third quarter, not shown here, have the gap widening, with a small drop in real income and a trend increase in consumption.
The gap between real consumption and real disposable income has been financed by drawing down excess savings. If the U.S. saving rates had remained at the pre-pandemic average value (implying zero excess saving), the two indexes would have tracked in tandem. Real consumption would then be some 3 percent lower than at present for the given level of income. By itself, this would leave real GDP about 2 percent lower.
Of course, this type of all-else-equal exercise requires caveats. It could understate the boost to the economy, to the extent this extra consumer spending had a multiplier impact by raising growth and employment above what they would have been. Conversely, it could overstate the boost, to the extent the extra spending was allocated to imports.
We next show a similar chart for our foreign aggregate. Real consumption also plummeted in these economies during the early stages of pandemic, in fact even more so than in the United States. While consumption has since recovered, it remains well below the pre-pandemic trend—in fact, no higher than in 2019. Real disposable income, meanwhile, did not have a surge during the pandemic and has been largely flat since 2019, creating a large shortfall relative to its pre-pandemic trend. The key point is that the consumption line has stayed below the income line. The convergence of these two series in recent quarters corresponds to the plateauing of foreign excess saving evident in the second chart of this post. Foreign consumers could have drawn on accumulated excess savings to support consumption growth but have chosen not to.
Foreign Income and Consumption Tracking Below Trend
Foreign Economies: Real Income and Consumption Indexes
Indexes, 2019 = 100
Sources: Eurostat; UK National Statistical Office; Japanese Cabinet Office; Statistics Canada; authors’ calculations. Notes: The foreign high-income series is a GDP-weighted average of the euro area, Japan, the United Kingdom, and Canada. Disposable income data for the second quarter of 2023 in Japan have not yet been released. Income for that quarter is extrapolated from the first quarter of 2023 at the average growth since the first quarter of 2022. Japan represents about 15 percent of the foreign index.
The drawdown in U.S. excess savings largely accounts for the U.S. growth advantage since the pandemic. As of the second quarter of 2023, U.S. GDP was 6 percent above its fourth-quarter 2019 level, with consumer spending up 9 percent. That is, consumer spending was a boost to GDP by doing better than the rest of the economy. The corresponding numbers are 3 percent and 0 percent for the euro area, 3 percent and 0 percent for Japan, 2 percent and -1 percent for the U.K., and 3 percent and 4 percent for Canada. In all but Canada, consumer spending underperformed relative to the rest of the economy.
A Mystery
We have no clear explanation for the divergence in U.S. and foreign saving behavior. As a general matter, household saving rates tend to increase when economic conditions and prospects are regarded as poor and decline when they are regarded as good. But according to measures constructed by the OECD, U.S. consumer confidence has been weaker relative to long-term norms than confidence in the other high-income economies, which would be consistent with higher saving in the U.S. and lower saving abroad.
Differences in the drivers of excess saving could be part of the explanation. U.S. saving during the pandemic came about equally from higher income and lower spending, while excess saving abroad came largely from lower spending. One possibility is that consumers are more willing to spend down excess savings when it comes from unexpected income windfalls, such as, in the U.S. case, large government transfers. The idea, based on prospect theory, is that government transfers are “unearned” and thus less valuable and easier to spend. This notion conflicts with the permanent income hypothesis, which holds that consumers tend to keep spending fairly steady after a temporary boost to income.
The runoff of excess saving in the U.S. has supported growth in the face of lagging real income and tighter financial conditions. Growth in foreign high-income economies received no similar support, with weak consumer spending acting as a fundamental drag on their recoveries.
Thomas Klitgaard is an economic research advisor in International Studies in the Federal Reserve Bank of New York’s Research and Statistics Group.
Matthew Higgins is an economic research advisor in International Studies in the Federal Reserve Bank of New York’s Research and Statistics Group.
How to cite this post:
Thomas Klitgaard and Matthew Higgins, “Spending Down Pandemic Savings Is an “Only-in-the-U.S.” Phenomenon,” Federal Reserve Bank of New York Liberty Street Economics, October 11, 2023, https://libertystreeteconomics.newyorkfed.org/2023/10/spending-down-pandemic-savings-is-an-only-in-the-u-s-phenomenon/.
Disclaimer The views expressed in this post are those of the author(s) and do not necessarily reflect the position of the Federal Reserve Bank of New York or the Federal Reserve System. Any errors or omissions are the responsibility of the author(s).
It was Jan. 11, 2024 when software giant Microsoft (MSFT) briefly passed Apple (AAPL) as the most valuable company in the world.
Microsoft's stock closed 0.5% higher, giving it a market valuation of $2.859 trillion.
It rose as much as 2% during the session and the company was briefly worth $2.903 trillion. Apple closed 0.3% lower, giving the company a market capitalization of $2.886 trillion.
"It was inevitable that Microsoft would overtake Apple since Microsoft is growing faster and has more to benefit from the generative AI revolution," D.A. Davidson analyst Gil Luria said at the time, according to Reuters.
The two tech titans have jostled for top spot over the years and Microsoft was ahead at last check, with a market cap of $3.085 trillion, compared with Apple's value of $2.684 trillion.
Analysts noted that Apple had been dealing with weakening demand, including for the iPhone, the company’s main source of revenue.
Demand in China, a major market, has slumped as the country's economy makes a slow recovery from the pandemic and competition from Huawei.
Sales in China of Apple's iPhone fell by 24% in the first six weeks of 2024 compared with a year earlier, according to research firm Counterpoint, as the company contended with stiff competition from a resurgent Huawei "while getting squeezed in the middle on aggressive pricing from the likes of OPPO, vivo and Xiaomi," said senior Analyst Mengmeng Zhang.
“Although the iPhone 15 is a great device, it has no significant upgrades from the previous version, so consumers feel fine holding on to the older-generation iPhones for now," he said.
A man scrolling through Netflix on an Apple iPad Pro. Photo by Phil Barker/Future Publishing via Getty Images.
Counterpoint said that the first six weeks of 2023 saw abnormally high numbers with significant unit sales being deferred from December 2022 due to production issues.
Apple is planning to open its eighth store in Shanghai – and its 47th across China – on March 21.
The company also plans to expand its research centre in Shanghai to support all of its product lines and open a new lab in southern tech hub Shenzhen later this year, according to the South China Morning Post.
Meanwhile, over in Europe, Apple announced changes to comply with the European Union's Digital Markets Act (DMA), which went into effect last week, Reuters reported on March 12.
Beginning this spring, software developers operating in Europe will be able to distribute apps to EU customers directly from their own websites instead of through the App Store.
"To reflect the DMA’s changes, users in the EU can install apps from alternative app marketplaces in iOS 17.4 and later," Apple said on its website, referring to the software platform that runs iPhones and iPads.
"Users will be able to download an alternative marketplace app from the marketplace developer’s website," the company said.
Apple has also said it will appeal a $2 billion EU antitrust fine for thwarting competition from Spotify (SPOT) and other music streaming rivals via restrictions on the App Store.
The company's shares have suffered amid all this upheaval, but some analysts still see good things in Apple's future.
Bank of America Securities confirmed its positive stance on Apple, maintaining a buy rating with a steady price target of $225, according to Investing.com.
The firm's analysis highlighted Apple's pricing strategy evolution since the introduction of the first iPhone in 2007, with initial prices set at $499 for the 4GB model and $599 for the 8GB model.
BofA said that Apple has consistently launched new iPhone models, including the Pro/Pro Max versions, to target the premium market.
Analyst says Apple selloff 'overdone'
Concurrently, prices for previous models are typically reduced by about $100 with each new release.
This strategy, coupled with installment plans from Apple and carriers, has contributed to the iPhone's installed base reaching a record 1.2 billion in 2023, the firm said.
Apple has effectively shifted its sales mix toward higher-value units despite experiencing slower unit sales, BofA said.
This trend is expected to persist and could help mitigate potential unit sales weaknesses, particularly in China.
BofA also noted Apple's dominance in the high-end market, maintaining a market share of over 90% in the $1,000 and above price band for the past three years.
The firm also cited the anticipation of a multi-year iPhone cycle propelled by next-generation AI technology, robust services growth, and the potential for margin expansion.
On Monday, Evercore ISI analysts said they believed that the sell-off in the iPhone maker’s shares may be “overdone.”
The firm said that investors' growing preference for AI-focused stocks like Nvidia (NVDA) has led to a reallocation of funds away from Apple.
In addition, Evercore said concerns over weakening demand in China, where Apple may be losing market share in the smartphone segment, have affected investor sentiment.
And then ongoing regulatory issues continue to have an impact on investor confidence in the world's second-biggest company.
“We think the sell-off is rather overdone, while we suspect there is strong valuation support at current levels to down 10%, there are three distinct drivers that could unlock upside on the stock from here – a) Cap allocation, b) AI inferencing, and c) Risk-off/defensive shift," the firm said in a research note.
Major typhoid fever surveillance study in sub-Saharan Africa indicates need for the introduction of typhoid conjugate vaccines in endemic countries
There is a high burden of typhoid fever in sub-Saharan African countries, according to a new study published today in The Lancet Global Health. This high…
There is a high burden of typhoid fever in sub-Saharan African countries, according to a new study published today in The Lancet Global Health. This high burden combined with the threat of typhoid strains resistant to antibiotic treatment calls for stronger prevention strategies, including the use and implementation of typhoid conjugate vaccines (TCVs) in endemic settings along with improvements in access to safe water, sanitation, and hygiene.
Credit: IVI
There is a high burden of typhoid fever in sub-Saharan African countries, according to a new study published today in The Lancet Global Health. This high burden combined with the threat of typhoid strains resistant to antibiotic treatment calls for stronger prevention strategies, including the use and implementation of typhoid conjugate vaccines (TCVs) in endemic settings along with improvements in access to safe water, sanitation, and hygiene.
The findings from this 4-year study, the Severe Typhoid in Africa (SETA) program, offers new typhoid fever burden estimates from six countries: Burkina Faso, Democratic Republic of the Congo (DRC), Ethiopia, Ghana, Madagascar, and Nigeria, with four countries recording more than 100 cases for every 100,000 person-years of observation, which is considered a high burden. The highest incidence of typhoid was found in DRC with 315 cases per 100,000 people while children between 2-14 years of age were shown to be at highest risk across all 25 study sites.
There are an estimated 12.5 to 16.3 million cases of typhoid every year with 140,000 deaths. However, with generic symptoms such as fever, fatigue, and abdominal pain, and the need for blood culture sampling to make a definitive diagnosis, it is difficult for governments to capture the true burden of typhoid in their countries.
“Our goal through SETA was to address these gaps in typhoid disease burden data,” said lead author Dr. Florian Marks, Deputy Director General of the International Vaccine Institute (IVI). “Our estimates indicate that introduction of TCV in endemic settings would go to lengths in protecting communities, especially school-aged children, against this potentially deadly—but preventable—disease.”
In addition to disease incidence, this study also showed that the emergence of antimicrobial resistance (AMR) in Salmonella Typhi, the bacteria that causes typhoid fever, has led to more reliance beyond the traditional first line of antibiotic treatment. If left untreated, severe cases of the disease can lead to intestinal perforation and even death. This suggests that prevention through vaccination may play a critical role in not only protecting against typhoid fever but reducing the spread of drug-resistant strains of the bacteria.
There are two TCVs prequalified by the World Health Organization (WHO) and available through Gavi, the Vaccine Alliance. In February 2024, IVI and SK bioscience announced that a third TCV, SKYTyphoid™, also achieved WHO PQ, paving the way for public procurement and increasing the global supply.
Alongside the SETA disease burden study, IVI has been working with colleagues in three African countries to show the real-world impact of TCV vaccination. These studies include a cluster-randomized trial in Agogo, Ghana and two effectiveness studies following mass vaccination in Kisantu, DRC and Imerintsiatosika, Madagascar.
Dr. Birkneh Tilahun Tadesse, Associate Director General at IVI and Head of the Real-World Evidence Department, explains, “Through these vaccine effectiveness studies, we aim to show the full public health value of TCV in settings that are directly impacted by a high burden of typhoid fever.” He adds, “Our final objective of course is to eliminate typhoid or to at least reduce the burden to low incidence levels, and that’s what we are attempting in Fiji with an island-wide vaccination campaign.”
As more countries in typhoid endemic countries, namely in sub-Saharan Africa and South Asia, consider TCV in national immunization programs, these data will help inform evidence-based policy decisions around typhoid prevention and control.
###
About the International Vaccine Institute (IVI)
The International Vaccine Institute (IVI) is a non-profit international organization established in 1997 at the initiative of the United Nations Development Programme with a mission to discover, develop, and deliver safe, effective, and affordable vaccines for global health.
IVI’s current portfolio includes vaccines at all stages of pre-clinical and clinical development for infectious diseases that disproportionately affect low- and middle-income countries, such as cholera, typhoid, chikungunya, shigella, salmonella, schistosomiasis, hepatitis E, HPV, COVID-19, and more. IVI developed the world’s first low-cost oral cholera vaccine, pre-qualified by the World Health Organization (WHO) and developed a new-generation typhoid conjugate vaccine that is recently pre-qualified by WHO.
IVI is headquartered in Seoul, Republic of Korea with a Europe Regional Office in Sweden, a Country Office in Austria, and Collaborating Centers in Ghana, Ethiopia, and Madagascar. 39 countries and the WHO are members of IVI, and the governments of the Republic of Korea, Sweden, India, Finland, and Thailand provide state funding. For more information, please visit https://www.ivi.int.
Incidence of typhoid fever in Burkina Faso, Democratic Republic of the Congo, Ethiopia, Ghana, Madagascar, and Nigeria (the Severe Typhoid in Africa programme): a population-based study
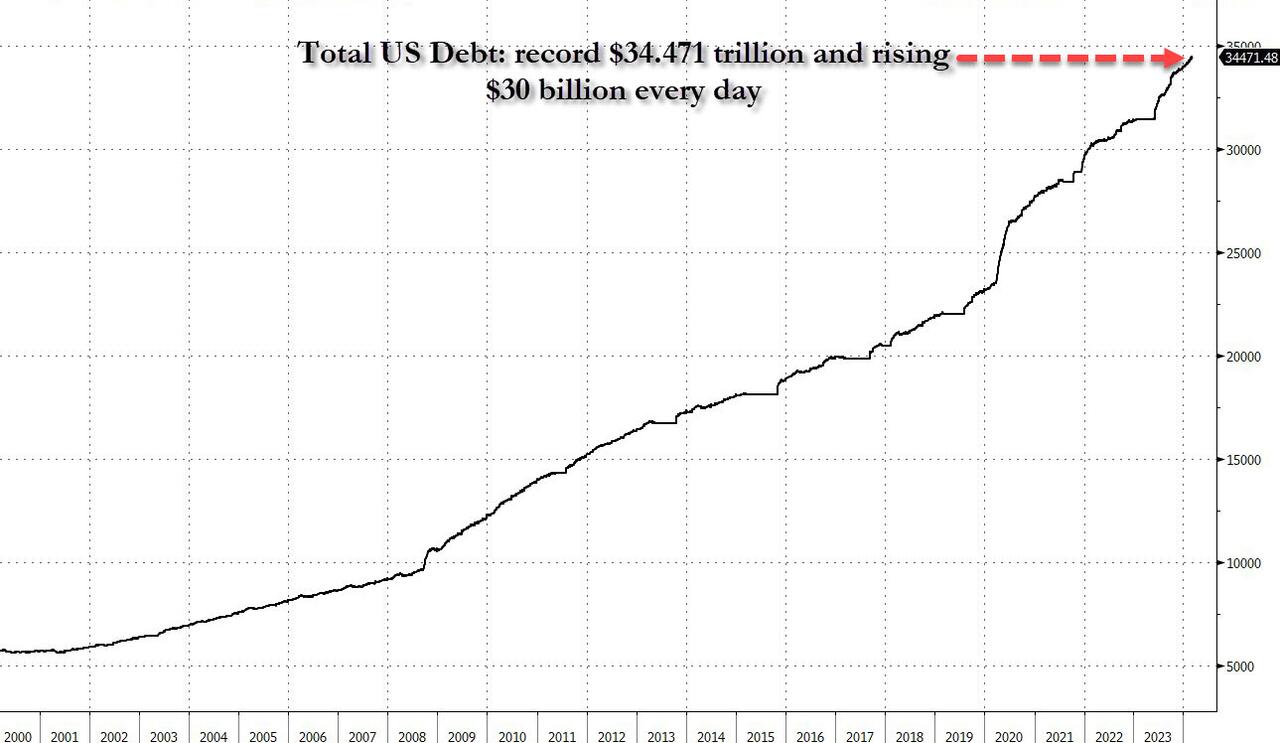
We’ve added 60% to national debt since 2018. Germany - a country with major economic woes - added ‘just’ 32%.
Maybe it will never matter. Maybe MMT is real. Maybe we just cancel or inflate it out. Maybe career real estate borrowers or career politicians aren’t the answer.
I have no idea. Only time will tell. But it’s going to be fascinating to watch it play out.
He is right: it will be fascinating, and the latest budget deficit data simply confirmed that the day of reckoning will come very soon, certainly sooner than the two years that One River's Eric Peters predicted this weekend for the coming "US debt sustainability crisis."
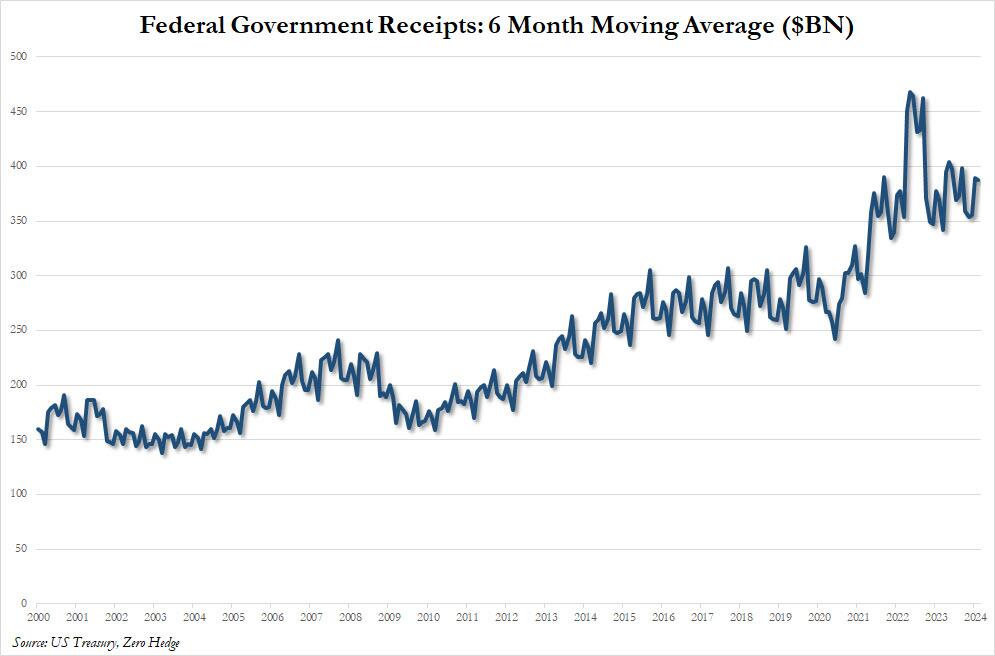
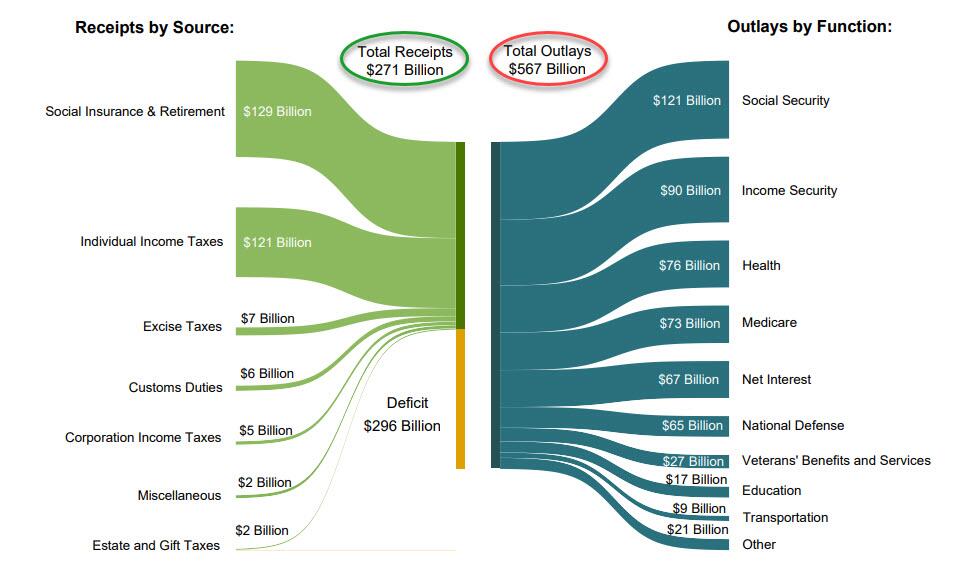
According to the US Treasury, in February, the US collected $271 billion in various tax receipts, and spent $567 billion, more than double what it collected.
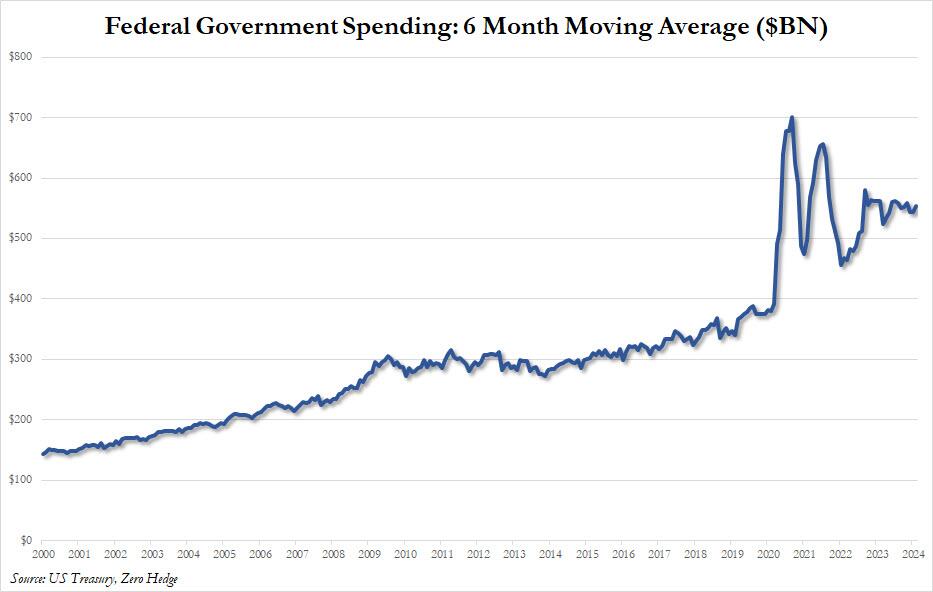
The two charts below show the divergence in US tax receipts which have flatlined (on a trailing 6M basis) since the covid pandemic in 2020 (with occasional stimmy-driven surges)...
... and spending which is about 50% higher compared to where it was in 2020.
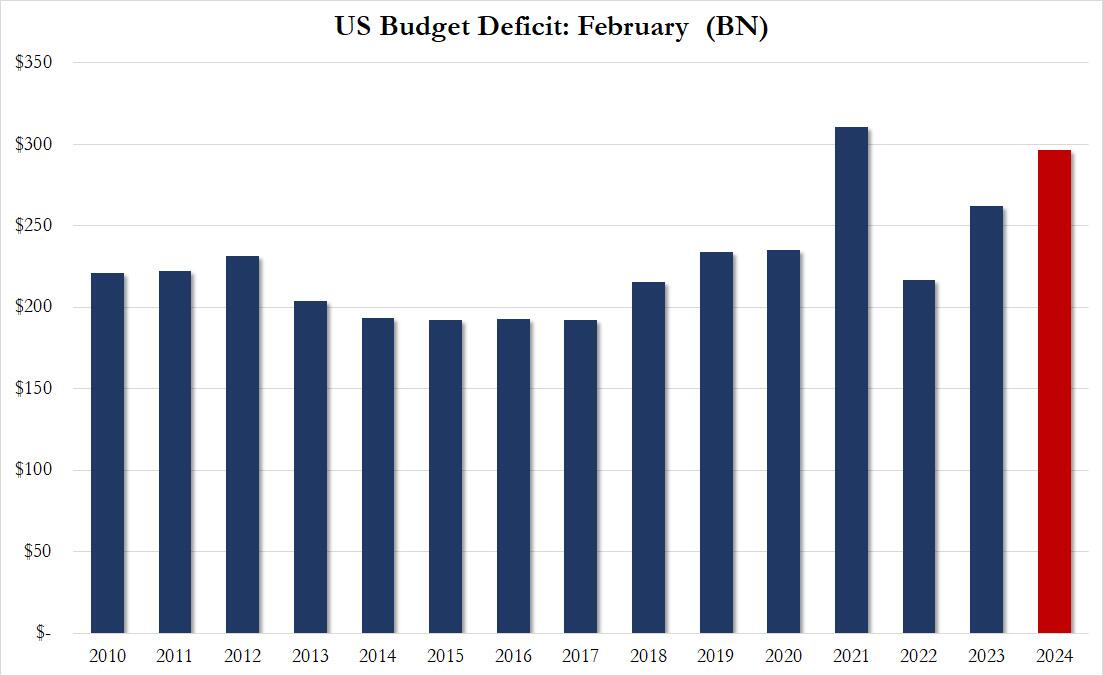
The end result is that in February, the budget deficit rose to $296.3 billion, up 12.9% from a year prior, and the second highest February deficit on record.
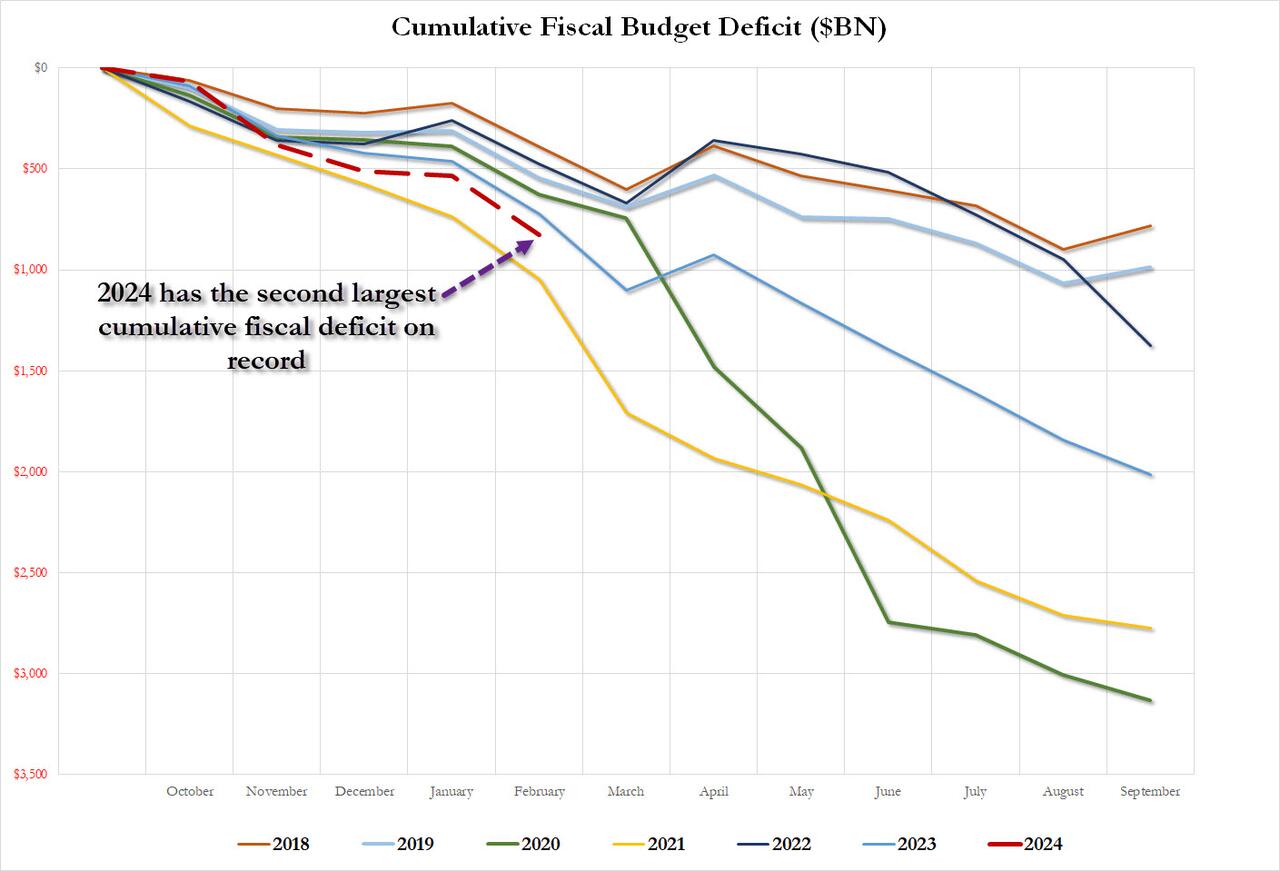
And the punchline: on a cumulative basis, the budget deficit in fiscal 2024 which began on October 1, 2023 is now $828 billion, the second largest cumulative deficit through February on record, surpassed only by the peak covid year of 2021.
But wait there's more: because in a world where the US is spending more than twice what it is collecting, the endgame is clear: debt collapse, and while it won't be tomorrow, or the week after, it is coming... and it's also why the US is now selling $1 trillion in debt every 100 days just to keep operating (and absorbing all those millions of illegal immigrants who will keep voting democrat to preserve the socialist system of the US, so beloved by the Soros clan).
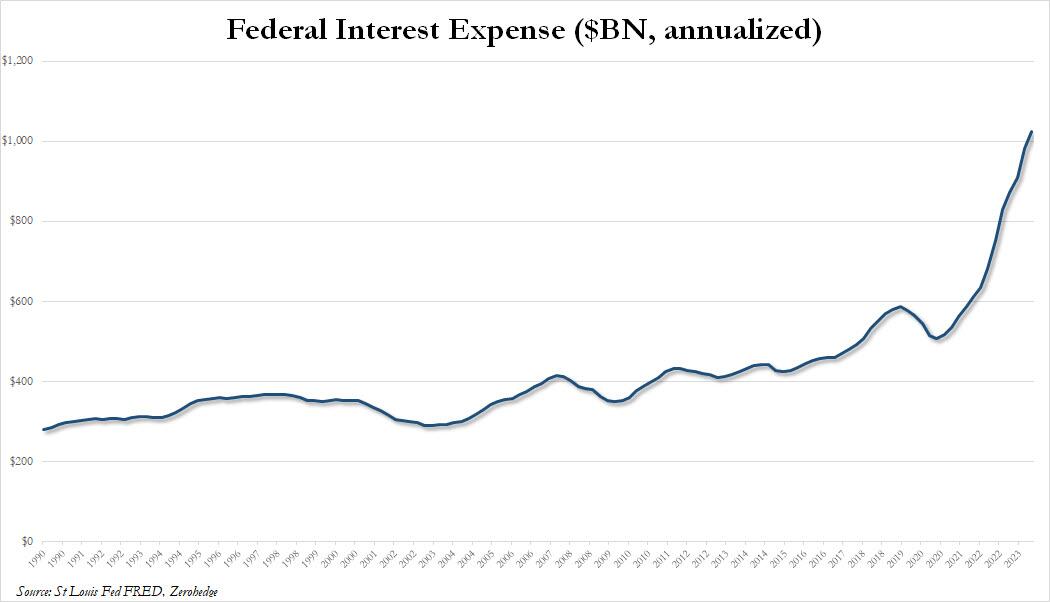
... having already surpassed total US defense spending and soon to surpass total health spending and, finally all social security spending, the largest spending category of all, which means that US debt will now rise exponentially higher until the inevitable moment when the US dollar loses its reserve status and it all comes crashing down.
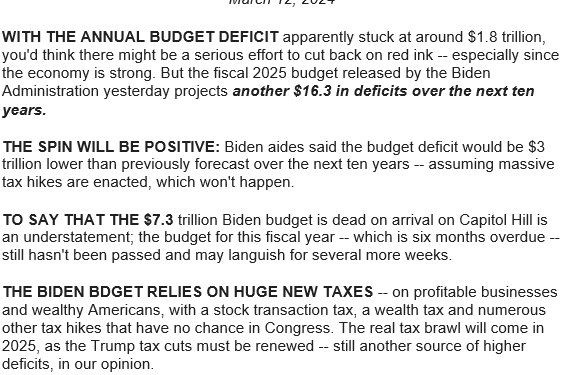
We conclude with another observation by CNBC's Brian Sullivan, who quotes an email by a DC strategist...
.. which lays out the proposed Biden budget as follows:
The budget deficit will growth another $16 TRILLION over next 10 years. Thats *with* the proposed massive tax hikes.
Without them the deficit will grow $19 trillion.
That's why you will hear the "deficit is being reduced by $3 trillion" over the decade.
No family budget or business could exist with this kind of math.
Of course, in the long run, neither can the US... and since neither party will ever cut the spending which everyone by now is so addicted to, the best anyone can do is start planning for the endgame.
We use cookies on our website to give you the most relevant experience by remembering your preferences and repeat visits. By clicking “Accept”, you consent to the use of ALL the cookies.
This website uses cookies to improve your experience while you navigate through the website. Out of these, the cookies that are categorized as necessary are stored on your browser as they are essential for the working of basic functionalities of the website. We also use third-party cookies that help us analyze and understand how you use this website. These cookies will be stored in your browser only with your consent. You also have the option to opt-out of these cookies. But opting out of some of these cookies may affect your browsing experience.
Necessary cookies are absolutely essential for the website to function properly. These cookies ensure basic functionalities and security features of the website, anonymously.
Cookie
Duration
Description
cookielawinfo-checbox-analytics
11 months
This cookie is set by GDPR Cookie Consent plugin. The cookie is used to store the user consent for the cookies in the category "Analytics".
cookielawinfo-checbox-functional
11 months
The cookie is set by GDPR cookie consent to record the user consent for the cookies in the category "Functional".
cookielawinfo-checbox-others
11 months
This cookie is set by GDPR Cookie Consent plugin. The cookie is used to store the user consent for the cookies in the category "Other.
cookielawinfo-checkbox-necessary
11 months
This cookie is set by GDPR Cookie Consent plugin. The cookies is used to store the user consent for the cookies in the category "Necessary".
cookielawinfo-checkbox-performance
11 months
This cookie is set by GDPR Cookie Consent plugin. The cookie is used to store the user consent for the cookies in the category "Performance".
viewed_cookie_policy
11 months
The cookie is set by the GDPR Cookie Consent plugin and is used to store whether or not user has consented to the use of cookies. It does not store any personal data.
Functional cookies help to perform certain functionalities like sharing the content of the website on social media platforms, collect feedbacks, and other third-party features.
Performance cookies are used to understand and analyze the key performance indexes of the website which helps in delivering a better user experience for the visitors.
Analytical cookies are used to understand how visitors interact with the website. These cookies help provide information on metrics the number of visitors, bounce rate, traffic source, etc.
Advertisement cookies are used to provide visitors with relevant ads and marketing campaigns. These cookies track visitors across websites and collect information to provide customized ads.


