Government
S&P Futures Jittery, Nasdaq Surge Continues Ahead Of Fed Decision
S&P Futures Jittery, Nasdaq Surge Continues Ahead Of Fed Decision
Share this:

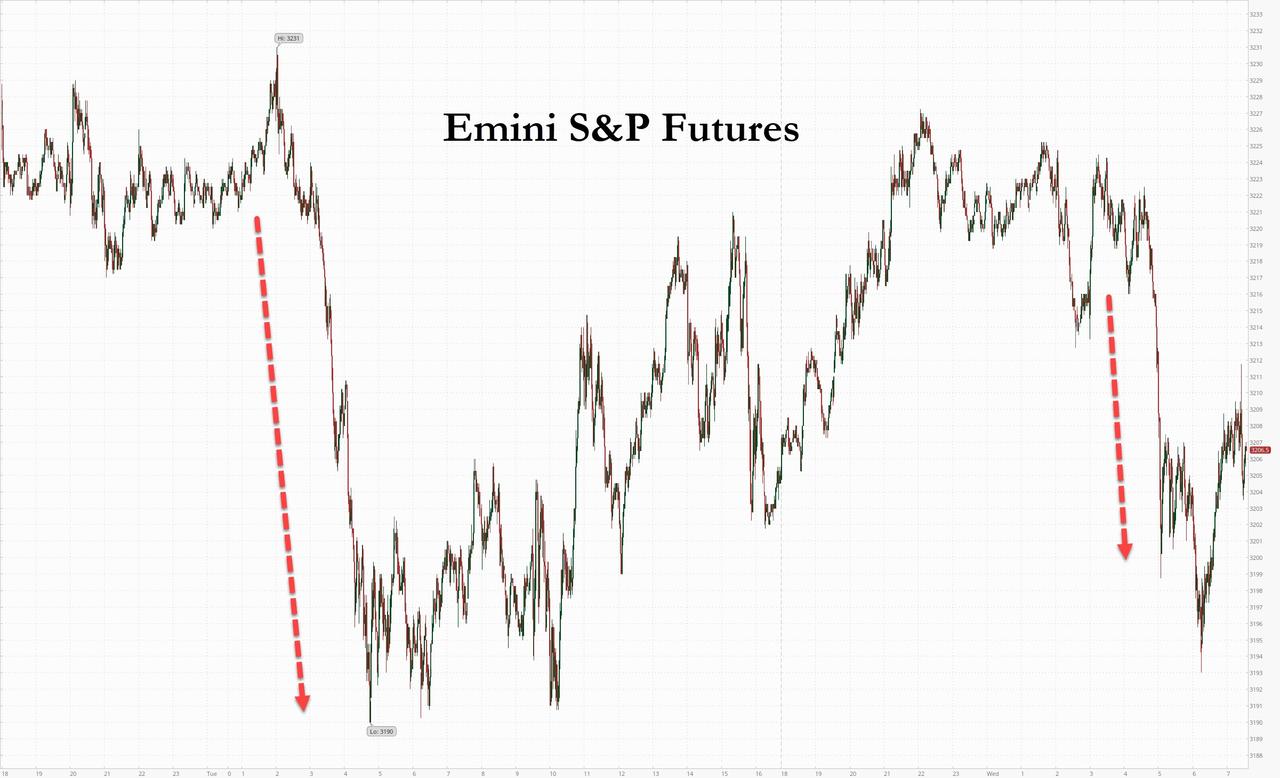
For the second night in a row, US equity futures peaked overnight then slumped around the time Europe opened, sliding along European stocks as investors were spooked by a grim economic forecast by the OECD (it is unclear why bad news isn't good news in this case) ahead of what is expected to be another very dovish statement by the Fed, which pushed the dollar to the most oversold level since 2007.

The Fed will publish its first economic projections since the coronavirus pandemic set off a recession in February that ended a decade-long expansion. Investors will also look for any hints on yield curve control measures amid a recent surge in U.S. Treasury yields. Investors will be looking for reassurance on the central bank’s willingness to keep providing extraordinary support for the economy. Policy makers may also comment on potentially targeting yields for some Treasury maturities. Markets are balancing that with the OECD’s assessment that the economic hit from the pandemic may be deeper than anticipated.
The Fed is also expected to mark the first step away from a complete focus on crisis prevention towards more traditional goals of providing accommodation to support the recovery. As part of this, economists expect that the Fed will announce an open-ended QE program consistent with monthly Treasury purchases of between $65bn and $85bn, while the statement should slightly enhance the commitment to keep rates low by stating that the FOMC will keep rates at current levels until the economy is “close to achieving the Fed’s dual mandate goals of full employment and price stability”.
“Markets have been cautious before the Fed meeting and technical indicators are stretched after the recent powerful rally,” Credit Agricole strategist Jean-Francois Paren wrote in a client note. “For now, it sounds like yield-curve control is the necessary condition for markets to further rally, but it may not be sufficient by itself as it also highlights the fragility of the system we are now living in.”
Some speculate that the Fed may even step in to tame the insane retail investor froth that has gripped the market, but we find that unlikely.
Prospects of even more Fed stimulus, together with optimism about a rebound in the economy, have driven stocks higher in recent weeks, with the Nasdaq notching a record closing high for the second straight session on Tuesday and the S&P 500 ending about 5% below its all-time peak. Of course, the untouchable Nasdaq 100 futures traded in the green all morning, with Apple, Facebook and Amazon.com all rising about 0.5% in premarket trading. Meanwhile as the momentum-to-value rotation reverses, oil majors Exxon Mobil and Chevron dropped about 1.5% each, as oil prices weakened after a rise in U.S. crude inventories raised concerns of oversupply. AMC Entertainment Holdings rose about 4% after the world’s largest theater operator said it expected to reopen its theaters globally in July.
Shortly after 5am ET, Europe's STOXX 600 Europe turned negative after climbing as much as 0.9% earlier, with travel and leisure and automakers leading losses among sectors. The Index dropped 0.1%, poised for the third consecutive session of declines. Sub-index tracking travel and leisure shares falls 1.3%, automakers down 1%. On the opposite end, personal and household goods advance 0.6%.
Earlier in the session, Asian stocks gained, led by health care and communications, after rising in the last session. Markets in the region were mixed, with Taiwan's Taiex Index and India's S&P BSE Sensex Index rising, and Jakarta Composite and Shanghai Composite falling. The Topix declined 0.2%, with Land Co and Besterra falling the most. The Shanghai Composite Index retreated 0.4%, with Shanghai Fengyuzhu Culture and Technology Co Ltd and Beijing Wantai Biological Pharmacy Enterprise posting the biggest slides.
In rates, Treasury futures traded near highs of the day in early US session as stock futures pare gains; the long end was leading, continuing this week’s bull-flattening trend ahead of the FOMC decision, with futures volume about 60% of the 5-day average. Yields are lower by 1bp to 3bp across the curve with 2s10s flatter by 2bp, 5s30s by 0.5bp; 10-year yields richer by 3bp at 0.795%, with bunds cheaper by 2bp ahead of expected syndicated 30- and 20-year deals from Germany and Finland.
In FX, the dollar resumed its recent decline, dropping to the most oversold level since 2007. The Bloomberg Dollar Spot Index fell to a three-month low and the greenback slumped against all of its Group-of-10 peers ahead of the Federal Reserve’s policy meeting.

The euro resumed its March toward $1.14; the Bund curve bull flattened modestly as bunds underperformed Treasuries. The pound continued its lengthy ascent over the dollar thanks to a broad improvement in risk sentiment and plans to raise the pace of reopening the U.K. economy, while short-covering pushed it to modest gains on the euro. The Aussie rose and the yen was set for its biggest three- day gain since March against the dollar into the FOMC meeting.
WTI and Brent futures remain subdued in early mid-week trade as sentiment across the market erodes alongside a number of bearish narratives for the complex. Yesterday’s EIA STEO report cut 2020 world oil demand growth forecast by 120k BPD to 8.34mln BPD but noted it sees US crude output declining 670k BPD (vs. Prev. 540k BPD) this year. In-fitting with the global 2020 contraction viewpoint, OECD forecasts a 2020 contraction of 6.0%, whilst the scenario with a second wave sees global GDP -11.5%. Elsewhere, the weekly Private Inventory data also proved to add to the bearish bias with the headline having printed a surprise build of 8.4mln barrels vs.
Looking at the day ahead, the highlight is the aforementioned Fed decision. Otherwise, data releases include the US CPI reading for May and French industrial production for April. We’ll also hear from the ECB’s de Guindos, Schnabel, Muller and Knot, while the OECD will also be publishing their Economic Outlook.
Market Snapshot
- S&P 500 futures up 0.5% to 3,221.00
- STOXX Europe 600 up 0.6% to 371.62
- MXAP up 0.4% to 162.10
- MXAPJ up 0.5% to 521.14
- Nikkei up 0.2% to 23,124.95
- Topix down 0.2% to 1,624.71
- Hang Seng Index down 0.03% to 25,049.73
- Shanghai Composite down 0.4% to 2,943.75
- Sensex up 0.7% to 34,183.19
- Australia S&P/ASX 200 up 0.06% to 6,148.43
- Kospi up 0.3% to 2,195.69
- German 10Y yield fell 1.0 bps to -0.319%
- Euro up 0.3% to $1.1372
- Brent Futures down 1.6% to $40.52/bbl
- Italian 10Y yield rose 13.8 bps to 1.372%
- Spanish 10Y yield rose 0.9 bps to 0.646%
- Brent Futures down 1.6% to $40.52/bbl
- Gold spot up 0.3% to $1,720.21
- U.S. Dollar Index down 0.3% to 96.08
Top Overnight News
- Investors are waiting to see if Fed officials discuss a possible return to the 1940s-era policy of yield-curve control
- The top U.S. specilaist in infectious diseases called the coronavirus pandemic his “worst nightmare” and warned that the deadly outbreak is far from over
- The ECB’s first three-month dollar swap allotment for $75.8 billion is set to mature on Thursday, making Wednesday’s operation the time to rollover. This accounts for over half of the total outstanding ECB swap lines
- U.K. Chancellor of the Exchequer Rishi Sunak is being asked by members of the ruling Conservative party to take decades to pay off the record debt the country is racking up as it tries to weather the coronavirus pandemic
- The global iron ore market may flip to a deficit if a virus-driven mine halt in Brazil persists and prices are now “on a knife edge,” UBS Group AG said in a warning that reflects a rising tide of concern over the suspension’s potential implications. Futures held above $100 a ton
- China’s factory deflation deepened in May and consumer price gains slowed, signaling that the recovery isn’t yet strong enough to produce inflation pressures
Asian equity markets traded somewhat indecisively after the mostly negative lead from global peers amid cautiousness heading into the FOMC, which saw all major indices on Wall St stall aside from the Nasdaq as tech resilience boosted it briefly above the historic 10K milestone. ASX 200 (+0.1) declined at the open with Australia dragged by weakness in financials and energy but with the losses gradually pared amid gains in defensives and improved consumer sentiment, while Nikkei 225 (+0.1%) was also initially pressured due to a firmer currency and larger than expected contraction in Machine Orders before staging a rebound to take back the 23K level. Hang Seng (U/C) and Shanghai Comp. (-0.4%) were varied with Hong Kong lifted at the open after the government’s bailout of Cathay Pacific which saw the airline’s shares take-off at the open, while the mainland lagged from the get-go as participants digested a somewhat tepid PBoC liquidity operation and softer than expected Chinese inflation data. Furthermore, tensions also lingered in the background as the Global Times suggested China could restrict the use of Qualcomm chips in government entities and key sectors related to national security, while it may also conduct anti-monopoly investigations and impose tariffs on US firms. Finally, 10yr JGBs were choppy around 152.00 amid similar indecision seen in the regional stock markets and with prices failing to benefit from today’s Rinban announcement in which the BoJ were present in the market for JPY 800bln of JGBs heavily concentrated in the belly.
Top Asian News
- Indonesian Stocks Slump Most in Five Weeks on Pandemic Concern
- Architect of Japan’s Virus Strategy Sees Flaw in West’s Approach
- China Protests Japan’s Plan For a G-7 Statement on Hong Kong
European equities have given up earlier gains and fall deeper into negative territory [Euro Stoxx 50 -0.8%] as stocks market failed to sustain the mostly positive APAC lead as players take some chips off the table ahead of some key risk events including the latest FOMC decision (full preview available on the newsquawk research suite) alongside the Eurogroup meeting later this week. News-flow has been light for the session but nonetheless bourses broadly post mild losses. Sectors are mostly in negative territory with more of an anti-cyclical bias and thus pointing to a more risk averse session. The detailed breakdown paints a picture in a similar vein and sees Travel & Leisure underperforming the region. In terms of individual movers, Spanish giant Inditex (+2.8%) erased earlier earning-induced downside of around 3% amid a jump in online sales. Commerzbank (+0.3%) holds its head above water but has waned off prior highs of c.3% which initially emanated from reports its second largest shareholder Cerberus (5% holding) demanded a fix-up of the group’s board. Shares thereafter drifted lower in tandem with yields. Elsewhere, Julius Baer (-1.5%) extended on losses amid reports the firm is facing another enforcement proceeding by FINMA over proper anti-money-laundering procedures.
Top European News
- Swedes Finally Learn Who Shot Their Prime Minister Olof Palme
- Frankie and Benny’s Owner to Close About 125 Restaurants
- KKR Considers Minority Investment in Italy’s Open Fiber: MF
In FX, the Dollar continues to depreciate amidst increasingly bearish price action as the index falls further from early June recovery highs in a declining pattern of daily ranges. Indeed, after a couple of attempts to revisit 97.000+ post-NFP peaks, the DXY has faded on each occasion, and the latest effort to bounce fell short of 96.500 to leave the index precarious above the round number below and eyeing the FOMC for fresh direction. However, Fed expectations do not suggest much in the way of a reprieve for the Greenback even though the aforementioned US jobs data was encouraging in terms of hopes for a relatively speedy rebound from the deep COVID-19 depths of unemployment, with the economic outlook still shrouded in uncertainty and hardly helped by violent protests or renewed global trade tensions. From a technical perspective, nearest support for the DXY comes in at 95.914 (March 11 low), while resistance remains at 97.069 (Monday’s apex) and the current range is 96.460-057.
- NZD/CHF/AUD - All vying for top G10 ranking, with the Kiwi firmly back above 0.6500 and not far from Tuesday’s best, while the Aussie is testing 0.7000 amidst reports of bids under the big figure from exporters and leverage accounts. Elsewhere, the Franc has forged more gains towards 0.9450 and 1.0750 vs the Euro, albeit still not cleanly or convincingly through the 200 DMA as the single currency maintains its bullish momentum against the Buck.
- JPY/GBP/EUR/CAD - The next best majors in descending order, with Usd/Jpy extending its marked retreat from circa 109.85 last Friday through more apparent supports, including the 30 DMA (107.54) to expose the only real downside chart level left before 107.00, at 107.09 (May 29 reaction low). Similarly, if Cable can sustain a break above Fib resistance around 1.2778 then 1.2800 beckons ahead of 1.2849 (March 12 high) and a more meaningful technical trendline at 1.2860, while Eur/Usd is inching closer to its post-NFP pinnacle (1.1384), but may find 1.1400 protected by decent option expiry interest between 1.1390-95 (1.2 bn). Turning to Usd/Cad, 1.3400 is still proving pivotal as crude prices consolidate off post-OPEC+ peaks and the pair looks to US CPI data before the Fed for additional impetus in the absence of anything scheduled on the Canadian front.
- SCANDI/EM - Waning risk sentiment and softer oil has thwarted another sub-10.5000 Eur/Nok move aided by firmer than expected Norwegian inflation metrics, while Eur/Sek has bounced from just shy of 10.4100 following further declines in Swedish household consumption and awaiting commentary from Riksbank Governor Ingves. Conversely, ongoing Dollar weakness has kept the HKMA active in defence of the currency peg and the Turkish Lira has derived traction from closer FX position monitoring by the CBRT rather than a fall in the jobless rate.
In commodities, WTI and Brent futures remain subdued in early mid-week trade as sentiment across the market erodes alongside a number of bearish narratives for the complex. Yesterday’s EIA STEO report cut 2020 world oil demand growth forecast by 120k BPD to 8.34mln BPD but noted it sees US crude output declining 670k BPD (vs. Prev. 540k BPD) this year. In-fitting with the global 2020 contraction viewpoint, OECD forecasts a 2020 contraction of 6.0%, whilst the scenario with a second wave sees global GDP -11.5%. Elsewhere, the weekly Private Inventory data also proved to add to the bearish bias with the headline having printed a surprise build of 8.4mln barrels vs. Expectations for a draw of 1.7mln. Meanwhile in Libya, production at the El-Sharara oil field (300k BPD) was reportedly shut-off again and the NOC later confirmed the continuation of a force majeure at the Sharara oil field. WTI July extends losses below USD 38/bbl (vs. high) and Brent August moves in tandem below USD 40.50/bbl (vs. high) as traders await the weekly EIA inventory data ahead of the FOMC rate decision. In terms of metals, spot gold ekes mild gains amid the risk-reversal from the APAC session coupled with a softer USD, but price action remains somewhat muted in anticipation of the Fed policy decision. Copper prices are underpinned by a weaker USD despite the deteriorating sentiment – Shanghai copper rose to near 20-week highs amid strong demand from China. Dalian iron meanwhile failed to benefit from the China demand as rising shipments from miners pressure prices.
US Event Calendar
- 8:30am: US CPI Ex Food and Energy MoM, est. 0.0%, prior -0.4%; CPI Ex Food and Energy YoY, est. 1.3%, prior 1.4%
- 8:30am: US CPI MoM, est. 0.0%, prior -0.8%; 8:30am: US CPI YoY, est. 0.3%, prior 0.3%
- 8:30am: Real Avg Hourly Earning YoY, prior 7.5%; Real Avg Weekly Earnings YoY, prior 6.9%
- 2pm: Monthly Budget Statement, est. $544.0b deficit, prior $207.8b deficit
- 2pm: FOMC Rate Decision
DB's Jim Reid concludes the overnight wrap
Today’s glance into my mundane world involves nearly being driven mad working from home by a radio station I discovered about 6 weeks ago. It’s an internet only one called “acoustic chill” and plays really nice mellow music to work along to on my Sonos. They don’t have adverts but every hour have a trailer that points you to their twitter page. I’ve got a sense of their potential audience by seeing they have 18 followers (including me). However late morning yesterday one of their songs got stuck and repeated the chorus line over and over again. It was very irritating. To cut a long story short I spent the afternoon repeatedly switching over and then back again to see if it was fixed. By the time I’d logged off at 7pm a small snippet of the chorus had been on a loop for over 7 hours. I suspect I may have been the only person in the world listening but it drove me crazy. Anyway, hopefully this morning it will be fixed and by mentioning the station I can at least double their audience.
I suspect the Fed will have a bigger audience today at the conclusion of their FOMC meeting and let’s hope they aren’t as stuck as acoustic chill radio. In their preview, our US economists write (link here) that they expect today’s meeting to mark the first step away from a complete focus on crisis prevention towards more traditional goals of providing accommodation to support the recovery. As part of this, they expect that the Fed will announce an open-ended QE program consistent with monthly Treasury purchases of between $65bn and $85bn, while the statement should slightly enhance the commitment to keep rates low by stating that the FOMC will keep rates at current levels until the economy is “close to achieving the Fed’s dual mandate goals of full employment and price stability”.
In terms of what else to look out for, the return of the quarterly Summary of Economic Projections will be a key highlight. This wasn’t released in March because of the difficulties in forecasting as the pandemic took hold. It will have the FOMC’s range of views on the path forward for growth, inflation and unemployment. In terms of the dot plot, our economists expect that all participants will project the fed funds target range to remain at its current level through 2021. Beyond that, a few may see lift-off in 2022 but they think the median dot will still be at current levels through the end of the forecast horizon in 2022.
Ahead of the Fed, there was an unwinding of investor risk appetite yesterday and a reversal of the recent catch-up trade that has been dominating over the last 1-2 weeks. By the end of the session, the S&P 500 was down -0.78%, its biggest setback in nearly 3 weeks, while the VIX index of volatility was up +1.76pts to a one-week high. This was in spite of tech stocks outperforming after a week or so of lagging, with the NASDAQ advancing +0.29% to reach a new record high. In fact, Information Technology and Communication Services (headlined by Google, Netflix and Facebook) were the only US sectors positive yesterday. Over in Europe, equities lagged behind the US after a good recent run, with the STOXX 600 down -1.22%. Banks certainly didn’t help, as the STOXX Banks index ended a run of 11 gains in the last 12 sessions to fall by -3.78%.
EU finance ministers met yesterday over video conference at the annual meeting of the EIB Board of Governors. While there was little new information, the meeting did highlight the differing viewpoints that will be negotiated at the European Council meeting later this month. The ministers discussed the overall size of the additional stimulus needed for the bloc, as well as what percent of those funds would be grants vs. loans. The other key topic discussed was whether conditions may be placed on the funds, and what they would be. German Finance Minister Scholz indicated that a €500bn fund would be a good outcome (note that the Commission has proposed €750bn), which would appear disappointing. The original Merkel-Macron announced plan was for €500bn, but it was fully in the form of grants, which is likely a non-starter.
Earlier in the day, Bloomberg reported that EU leaders could hold an emergency summit on the recovery fund on July 9-10. That would be in addition to an already planned European Council video conference on June 19 to discuss the matter. Meanwhile the Austrian finance minister said in a statement that the recovery fund’s size and shape wasn’t acceptable for the country.
Against this backdrop, sovereign debt sold off in Europe yesterday, with yields on 10yr bunds up +1.0bp, as the spread of Italian (+8.7bps) and Spanish (+7.9bps) 10yr yields over bunds saw a noticeable widening. Safe havens outperformed yesterday as equities pulled back, with the Japanese yen (+0.62% vs. USD) and the Swiss franc (+0.72%) the top two G10 currencies yesterday. This trend was seen elsewhere, with gold rallying by +0.99% and yields on 10yr treasuries falling by -5.0bps.
In terms of how Asia is trading this morning, it’s been another fairly mixed session with the Nikkei flat, and Shanghai Comp (-0.50%) down and the Hang Seng (+0.15%) and Kospi (+0.11%) both posting modest gains. Meanwhile, futures on the S&P 500 are up +0.46%. Elsewhere, WTI oil prices are down -1.87% overnight after a report from the American Petroleum Institute said that the US crude stockpiles rose by 8.42 million barrels last week. If confirmed by the EIA this would be the largest build since end of April. In terms of overnight data releases China’s May CPI printed at +2.4% yoy (vs. +2.7% yoy expected) while PPI came in at -3.7% yoy (vs. -3.3% yoy expected).
As mentioned at the top DB has recently become bearish on the dollar and on a related theme one of our FX Strategists, Robin Winkler, put out a report yesterday (link here ) highlighting the lack a of holistic reopening plan across US regions and how this could raise risks of a prolonged infection period. The analysis uses Rt, the effective transmission rate, to judge whether a second wave is imminent. If Rt is above 1, cases can grow exponentially, while when below 1, cases fall and the virus is suppressed. When aggregating state-level Rt estimates up to the national level, reopening since mid-April caused a fairly linear rise in the effective transmission rate with a 0.02 rise in Rt for every 10% reopened. That beta implies that a full reopening of the country from -25% mobility back to normal would take Rt to nearly 1.00, using Google mobility data. The problem with this analysis is that not all states are average, indeed some larger states like Texas and California have transmission rates far closer to 1 already, making their reopening more risky. 40% of the country may be able to get back to normal currently, mostly rural and lower infected regions, while the rest of the country would need to retain some degree of lockdown until transmission rates fall lower. Coordination would help with this issue, but this is unlikely during an election year as the issue of lockdowns has become partisan. According to transmission rates a coordinated response would likely reopen states that voted Democrat in the last Presidential election rather than Republican, and so the federal government may be less inclined to orchestrate. One of the best predictors of any given state's return from lockdown today is how the state voted in the 2016 election. Given the inability to close state borders, a lack of coordination means that reopening plans for some states may be drawn out for longer or alternatively open those states up to a second wave. See the full report for more.
In terms of yesterday’s data, the number of US job openings in April fell to a lower-than-expected 5.046m (vs. 5.750m expected), which is the lowest number since December 2014. Meanwhile the quits rate, which is the number who are voluntarily leaving their job as a share of the labour force, fell to a 9-year low of 1.4%. However, the NFIB small business optimism index for May did rise to 94.4 (vs. 92.5 expected). In German data, April exports fell by -25.0% month/month (vs. -15.6% expected and -11.7% last month), and down -31.1% on a year/year basis. This was the largest one month change in the data series going back to 1950. Finally, there was a slight positive revision to the Euro Area’s economic contraction in Q1, with the decline revised down to -3.6% (vs. -3.8% previously).
To the day ahead now with the aforementioned Federal Reserve decision and Chair Powell’s subsequent press conference likely to be the highlight. Otherwise, data releases include the US CPI reading for May and French industrial production for April. We’ll also hear from the ECB’s de Guindos, Schnabel, Muller and Knot, while the OECD will also be publishing their Economic Outlook.
Government
Are Voters Recoiling Against Disorder?
Are Voters Recoiling Against Disorder?
Authored by Michael Barone via The Epoch Times (emphasis ours),
The headlines coming out of the Super…
Share this:


Authored by Michael Barone via The Epoch Times (emphasis ours),
The headlines coming out of the Super Tuesday primaries have got it right. Barring cataclysmic changes, Donald Trump and Joe Biden will be the Republican and Democratic nominees for president in 2024.
With Nikki Haley’s withdrawal, there will be no more significantly contested primaries or caucuses—the earliest both parties’ races have been over since something like the current primary-dominated system was put in place in 1972.
The primary results have spotlighted some of both nominees’ weaknesses.
Donald Trump lost high-income, high-educated constituencies, including the entire metro area—aka the Swamp. Many but by no means all Haley votes there were cast by Biden Democrats. Mr. Trump can’t afford to lose too many of the others in target states like Pennsylvania and Michigan.
Majorities and large minorities of voters in overwhelmingly Latino counties in Texas’s Rio Grande Valley and some in Houston voted against Joe Biden, and even more against Senate nominee Rep. Colin Allred (D-Texas).
Returns from Hispanic precincts in New Hampshire and Massachusetts show the same thing. Mr. Biden can’t afford to lose too many Latino votes in target states like Arizona and Georgia.
When Mr. Trump rode down that escalator in 2015, commentators assumed he’d repel Latinos. Instead, Latino voters nationally, and especially the closest eyewitnesses of Biden’s open-border policy, have been trending heavily Republican.
High-income liberal Democrats may sport lawn signs proclaiming, “In this house, we believe ... no human is illegal.” The logical consequence of that belief is an open border. But modest-income folks in border counties know that flows of illegal immigrants result in disorder, disease, and crime.
There is plenty of impatience with increased disorder in election returns below the presidential level. Consider Los Angeles County, America’s largest county, with nearly 10 million people, more people than 40 of the 50 states. It voted 71 percent for Mr. Biden in 2020.
Current returns show county District Attorney George Gascon winning only 21 percent of the vote in the nonpartisan primary. He’ll apparently face Republican Nathan Hochman, a critic of his liberal policies, in November.
Gascon, elected after the May 2020 death of counterfeit-passing suspect George Floyd in Minneapolis, is one of many county prosecutors supported by billionaire George Soros. His policies include not charging juveniles as adults, not seeking higher penalties for gang membership or use of firearms, and bringing fewer misdemeanor cases.
The predictable result has been increased car thefts, burglaries, and personal robberies. Some 120 assistant district attorneys have left the office, and there’s a backlog of 10,000 unprosecuted cases.
More than a dozen other Soros-backed and similarly liberal prosecutors have faced strong opposition or have left office.
St. Louis prosecutor Kim Gardner resigned last May amid lawsuits seeking her removal, Milwaukee’s John Chisholm retired in January, and Baltimore’s Marilyn Mosby was defeated in July 2022 and convicted of perjury in September 2023. Last November, Loudoun County, Virginia, voters (62 percent Biden) ousted liberal Buta Biberaj, who declined to prosecute a transgender student for assault, and in June 2022 voters in San Francisco (85 percent Biden) recalled famed radical Chesa Boudin.
Similarly, this Tuesday, voters in San Francisco passed ballot measures strengthening police powers and requiring treatment of drug-addicted welfare recipients.
In retrospect, it appears the Floyd video, appearing after three months of COVID-19 confinement, sparked a frenzied, even crazed reaction, especially among the highly educated and articulate. One fatal incident was seen as proof that America’s “systemic racism” was worse than ever and that police forces should be defunded and perhaps abolished.
2020 was “the year America went crazy,” I wrote in January 2021, a year in which police funding was actually cut by Democrats in New York, Los Angeles, San Francisco, Seattle, and Denver. A year in which young New York Times (NYT) staffers claimed they were endangered by the publication of Sen. Tom Cotton’s (R-Ark.) opinion article advocating calling in military forces if necessary to stop rioting, as had been done in Detroit in 1967 and Los Angeles in 1992. A craven NYT publisher even fired the editorial page editor for running the article.
Evidence of visible and tangible discontent with increasing violence and its consequences—barren and locked shelves in Manhattan chain drugstores, skyrocketing carjackings in Washington, D.C.—is as unmistakable in polls and election results as it is in daily life in large metropolitan areas. Maybe 2024 will turn out to be the year even liberal America stopped acting crazy.
Chaos and disorder work against incumbents, as they did in 1968 when Democrats saw their party’s popular vote fall from 61 percent to 43 percent.
Views expressed in this article are opinions of the author and do not necessarily reflect the views of The Epoch Times or ZeroHedge.
Government
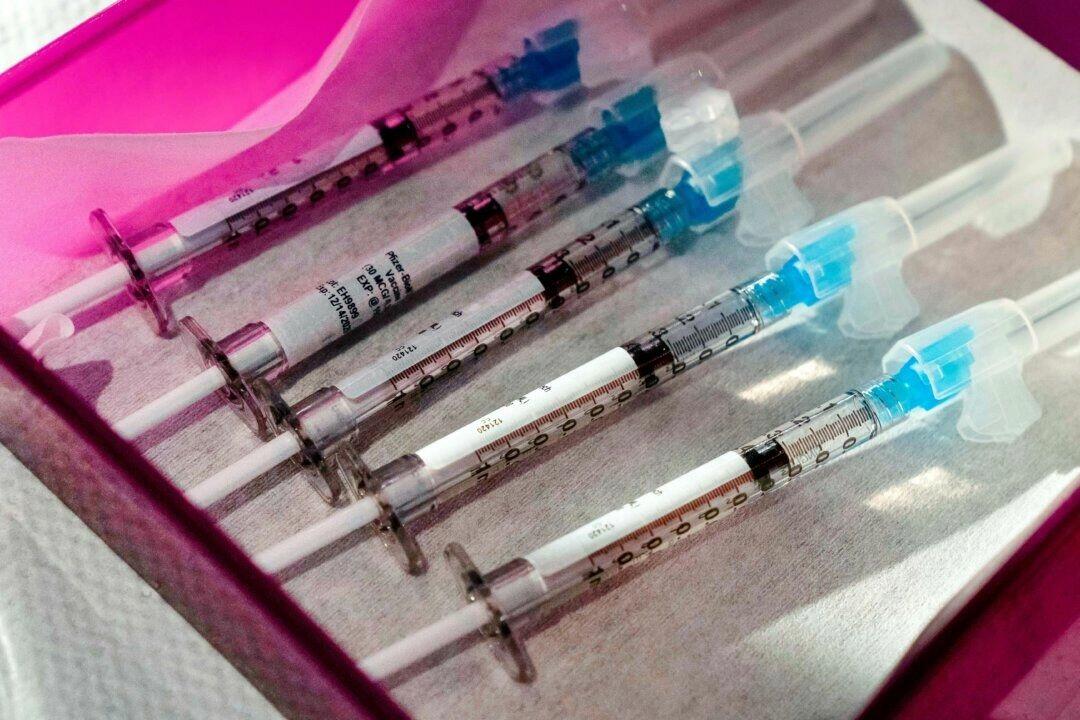
Veterans Affairs Kept COVID-19 Vaccine Mandate In Place Without Evidence
Veterans Affairs Kept COVID-19 Vaccine Mandate In Place Without Evidence
Authored by Zachary Stieber via The Epoch Times (emphasis ours),
The…
Share this:

Authored by Zachary Stieber via The Epoch Times (emphasis ours),
The U.S. Department of Veterans Affairs (VA) reviewed no data when deciding in 2023 to keep its COVID-19 vaccine mandate in place.
VA Secretary Denis McDonough said on May 1, 2023, that the end of many other federal mandates “will not impact current policies at the Department of Veterans Affairs.”
He said the mandate was remaining for VA health care personnel “to ensure the safety of veterans and our colleagues.”
Mr. McDonough did not cite any studies or other data. A VA spokesperson declined to provide any data that was reviewed when deciding not to rescind the mandate. The Epoch Times submitted a Freedom of Information Act for “all documents outlining which data was relied upon when establishing the mandate when deciding to keep the mandate in place.”
The agency searched for such data and did not find any.
“The VA does not even attempt to justify its policies with science, because it can’t,” Leslie Manookian, president and founder of the Health Freedom Defense Fund, told The Epoch Times.
“The VA just trusts that the process and cost of challenging its unfounded policies is so onerous, most people are dissuaded from even trying,” she added.
The VA’s mandate remains in place to this day.
The VA’s website claims that vaccines “help protect you from getting severe illness” and “offer good protection against most COVID-19 variants,” pointing in part to observational data from the U.S. Centers for Disease Control and Prevention (CDC) that estimate the vaccines provide poor protection against symptomatic infection and transient shielding against hospitalization.
There have also been increasing concerns among outside scientists about confirmed side effects like heart inflammation—the VA hid a safety signal it detected for the inflammation—and possible side effects such as tinnitus, which shift the benefit-risk calculus.
President Joe Biden imposed a slate of COVID-19 vaccine mandates in 2021. The VA was the first federal agency to implement a mandate.
President Biden rescinded the mandates in May 2023, citing a drop in COVID-19 cases and hospitalizations. His administration maintains the choice to require vaccines was the right one and saved lives.
“Our administration’s vaccination requirements helped ensure the safety of workers in critical workforces including those in the healthcare and education sectors, protecting themselves and the populations they serve, and strengthening their ability to provide services without disruptions to operations,” the White House said.
Some experts said requiring vaccination meant many younger people were forced to get a vaccine despite the risks potentially outweighing the benefits, leaving fewer doses for older adults.
“By mandating the vaccines to younger people and those with natural immunity from having had COVID, older people in the U.S. and other countries did not have access to them, and many people might have died because of that,” Martin Kulldorff, a professor of medicine on leave from Harvard Medical School, told The Epoch Times previously.
The VA was one of just a handful of agencies to keep its mandate in place following the removal of many federal mandates.
“At this time, the vaccine requirement will remain in effect for VA health care personnel, including VA psychologists, pharmacists, social workers, nursing assistants, physical therapists, respiratory therapists, peer specialists, medical support assistants, engineers, housekeepers, and other clinical, administrative, and infrastructure support employees,” Mr. McDonough wrote to VA employees at the time.
“This also includes VA volunteers and contractors. Effectively, this means that any Veterans Health Administration (VHA) employee, volunteer, or contractor who works in VHA facilities, visits VHA facilities, or provides direct care to those we serve will still be subject to the vaccine requirement at this time,” he said. “We continue to monitor and discuss this requirement, and we will provide more information about the vaccination requirements for VA health care employees soon. As always, we will process requests for vaccination exceptions in accordance with applicable laws, regulations, and policies.”
The version of the shots cleared in the fall of 2022, and available through the fall of 2023, did not have any clinical trial data supporting them.
A new version was approved in the fall of 2023 because there were indications that the shots not only offered temporary protection but also that the level of protection was lower than what was observed during earlier stages of the pandemic.
Ms. Manookian, whose group has challenged several of the federal mandates, said that the mandate “illustrates the dangers of the administrative state and how these federal agencies have become a law unto themselves.”
Government
Low Iron Levels In Blood Could Trigger Long COVID: Study
Low Iron Levels In Blood Could Trigger Long COVID: Study
Authored by Amie Dahnke via The Epoch Times (emphasis ours),
People with inadequate…
Share this:


Authored by Amie Dahnke via The Epoch Times (emphasis ours),
People with inadequate iron levels in their blood due to a COVID-19 infection could be at greater risk of long COVID.
A new study indicates that problems with iron levels in the bloodstream likely trigger chronic inflammation and other conditions associated with the post-COVID phenomenon. The findings, published on March 1 in Nature Immunology, could offer new ways to treat or prevent the condition.
Long COVID Patients Have Low Iron Levels
Researchers at the University of Cambridge pinpointed low iron as a potential link to long-COVID symptoms thanks to a study they initiated shortly after the start of the pandemic. They recruited people who tested positive for the virus to provide blood samples for analysis over a year, which allowed the researchers to look for post-infection changes in the blood. The researchers looked at 214 samples and found that 45 percent of patients reported symptoms of long COVID that lasted between three and 10 months.
In analyzing the blood samples, the research team noticed that people experiencing long COVID had low iron levels, contributing to anemia and low red blood cell production, just two weeks after they were diagnosed with COVID-19. This was true for patients regardless of age, sex, or the initial severity of their infection.
According to one of the study co-authors, the removal of iron from the bloodstream is a natural process and defense mechanism of the body.
But it can jeopardize a person’s recovery.
“When the body has an infection, it responds by removing iron from the bloodstream. This protects us from potentially lethal bacteria that capture the iron in the bloodstream and grow rapidly. It’s an evolutionary response that redistributes iron in the body, and the blood plasma becomes an iron desert,” University of Oxford professor Hal Drakesmith said in a press release. “However, if this goes on for a long time, there is less iron for red blood cells, so oxygen is transported less efficiently affecting metabolism and energy production, and for white blood cells, which need iron to work properly. The protective mechanism ends up becoming a problem.”
The research team believes that consistently low iron levels could explain why individuals with long COVID continue to experience fatigue and difficulty exercising. As such, the researchers suggested iron supplementation to help regulate and prevent the often debilitating symptoms associated with long COVID.
“It isn’t necessarily the case that individuals don’t have enough iron in their body, it’s just that it’s trapped in the wrong place,” Aimee Hanson, a postdoctoral researcher at the University of Cambridge who worked on the study, said in the press release. “What we need is a way to remobilize the iron and pull it back into the bloodstream, where it becomes more useful to the red blood cells.”
The research team pointed out that iron supplementation isn’t always straightforward. Achieving the right level of iron varies from person to person. Too much iron can cause stomach issues, ranging from constipation, nausea, and abdominal pain to gastritis and gastric lesions.
1 in 5 Still Affected by Long COVID
COVID-19 has affected nearly 40 percent of Americans, with one in five of those still suffering from symptoms of long COVID, according to the U.S. Centers for Disease Control and Prevention (CDC). Long COVID is marked by health issues that continue at least four weeks after an individual was initially diagnosed with COVID-19. Symptoms can last for days, weeks, months, or years and may include fatigue, cough or chest pain, headache, brain fog, depression or anxiety, digestive issues, and joint or muscle pain.


Walmart launches clever answer to Target’s new membership program


Veterans Affairs Kept COVID-19 Vaccine Mandate In Place Without Evidence


The Coming Of The Police State In America


When Military Rule Supplants Democracy


United Airlines adds new flights to faraway destinations


Low Iron Levels In Blood Could Trigger Long COVID: Study


Walmart has really good news for shoppers (and Joe Biden)


Another beloved brewery files Chapter 11 bankruptcy
Walmart joins Costco in sharing key pricing news


Angry Shouting Aside, Here’s What Biden Is Running On
-

 Uncategorized2 weeks ago
All Of The Elements Are In Place For An Economic Crisis Of Staggering Proportions
-

 Uncategorized1 month ago
Cathie Wood sells a major tech stock (again)
-

 Uncategorized3 weeks ago
California Counties Could Be Forced To Pay $300 Million To Cover COVID-Era Program
-

 Uncategorized2 weeks ago
Apparel Retailer Express Moving Toward Bankruptcy
-

 Uncategorized3 weeks ago
Industrial Production Decreased 0.1% in January
-
International2 days ago
Walmart launches clever answer to Target’s new membership program
-

 International2 days ago
EyePoint poaches medical chief from Apellis; Sandoz CFO, longtime BioNTech exec to retire
-

 Uncategorized3 weeks ago
RFK Jr: The Wuhan Cover-Up & The Rise Of The Biowarfare-Industrial Complex