S&P 500 Risk Profile: 14 June 2022
A common definition of a bear market is a 20% stock market decline. By that standard, the S&P 500 crossed that Rubicon yesterday (June 13) for the…
Share this:

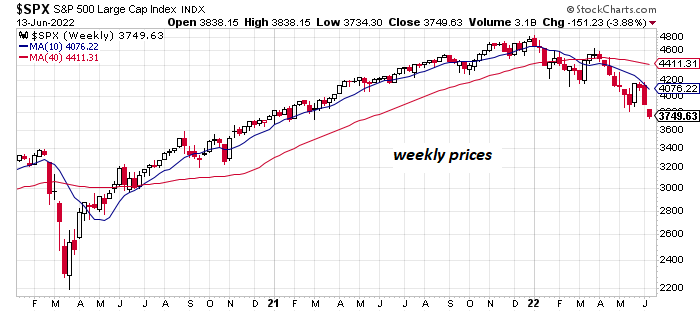
A common definition of a bear market is a 20% stock market decline. By that standard, the S&P 500 crossed that Rubicon yesterday (June 13) for the first time since the pandemic crash in March 2020 as the market’s drawdown reached nearly -22%.
Whatever you call, the market trend of late is clearly negative. But that’s old news. The S&P 500’s directional bias has been clearly pointing down for several months and so anyone who’s surprised by the recent tumble hasn’t been paying attention.
How close is the market to a bottom? That’s the critical question, as it always is when the market slides. But the standard answer still applies: no one knows in real time, although we can use some analytics to guesstimate how near we are to a bottom.
One way to estimate an answer is by monitoring an aggregate of several proxies via CapitalSpectator.com’s S&P 500 Sentiment Momentum Index (for details, see this summary). The index (cited in Z-scores) is currently posting its lowest reading since the pandemic initially triggered a sharp correction in the spring of 2020, leaving the index at roughly -2 standard deviations, twice as deep since our April update. It’s clear that the market is closer to a bottom. Whether this is the actual bottom, alas, can only be determined with hindsight. Keep in mind that the sentiment data below shows that while -2 is a relatively low mark, the S&P has managed to go deeper and so the potential for more selling can’t be dismissed. That said, it appears that the bulk of the downside is behind us. On the other hand, conservative investors may want to wait until we see some upside trending behavior to call a bottom. By that standard, it’s still too early to go fishing.

For another perspective on how the market correction stacks up vis-à-vis history, consider the drawdown chart below. The current peak-to-trough decline for the S&P 500 fell to nearly -22% yesterday. The slide is no longer a garden-variety correction, although we’re still well above the steepest drawdowns reached in the past 60-plus years. In other words, there’s still precedent for further deterioration.

Using a Hidden Markov model (HMM) clearly shows that the S&P 500 has entered bear-market terrain. This indicator has been hinting at no less recently, inching above the 50% probability mark (just barely) in early May, jumping to 59% by the end of last month, and then surging to 83% at yesterday’s close. (For some background on how the analytics are calculated in the chart below, see this primer.)

Applying another econometric model to estimate so-called bubble risk shows that this indicator started rebounding in April, effectively warning of a resumption in elevated crash risk. The indicated then jumped to a clear high alert last month, and remains so as of yesterday’s close. (See this 2014 post for some background on the methodology).

Unsurprisingly, the recent market decline has taken some of the froth off of valuation, although the S&P is still well above levels that can be considered reasonably valued, based on the CAPE ratio.

Finally, the ratio for a pair US equity ETFs continues to suggest that the recent return of risk-off sentiment for stocks continues. Comparing the relative performance of the S&P SPDR (SPY) to iShares MSCI Minimum Volatility (USMV) indicates that market sentiment remains defensive (ratio is falling). When this ratio begins to stabilize and turn higher that shift will provide a possible early sign that the tide is starting to turn in favor of the bulls again. For the moment, however, such a change is nowhere on the immediate horizon.

Learn To Use R For Portfolio Analysis
Quantitative Investment Portfolio Analytics In R:
An Introduction To R For Modeling Portfolio Risk and Return
By James Picerno

International
Net Zero, The Digital Panopticon, & The Future Of Food
Net Zero, The Digital Panopticon, & The Future Of Food
Authored by Colin Todhunter via Off-Guardian.org,
The food transition, the energy…
Share this:


Authored by Colin Todhunter via Off-Guardian.org,
The food transition, the energy transition, net-zero ideology, programmable central bank digital currencies, the censorship of free speech and clampdowns on protest. What’s it all about? To understand these processes, we need to first locate what is essentially a social and economic reset within the context of a collapsing financial system.
Writer Ted Reece notes that the general rate of profit has trended downwards from an estimated 43% in the 1870s to 17% in the 2000s. By late 2019, many companies could not generate enough profit. Falling turnover, squeezed margins, limited cashflows and highly leveraged balance sheets were prevalent.
Professor Fabio Vighi of Cardiff University has described how closing down the global economy in early 2020 under the guise of fighting a supposedly new and novel pathogen allowed the US Federal Reserve to flood collapsing financial markets (COVID relief) with freshly printed money without causing hyperinflation. Lockdowns curtailed economic activity, thereby removing demand for the newly printed money (credit) in the physical economy and preventing ‘contagion’.
According to investigative journalist Michael Byrant, €1.5 trillion was needed to deal with the crisis in Europe alone. The financial collapse staring European central bankers in the face came to a head in 2019. The appearance of a ‘novel virus’ provided a convenient cover story.
The European Central Bank agreed to a €1.31 trillion bailout of banks followed by the EU agreeing to a €750 billion recovery fund for European states and corporations. This package of long-term, ultra-cheap credit to hundreds of banks was sold to the public as a necessary programme to cushion the impact of the pandemic on businesses and workers.
In response to a collapsing neoliberalism, we are now seeing the rollout of an authoritarian great reset — an agenda that intends to reshape the economy and change how we live.
SHIFT TO AUTHORITARIANISM
The new economy is to be dominated by a handful of tech giants, global conglomerates and e-commerce platforms, and new markets will also be created through the financialisation of nature, which is to be colonised, commodified and traded under the notion of protecting the environment.
In recent years, we have witnessed an overaccumulation of capital, and the creation of such markets will provide fresh investment opportunities (including dodgy carbon offsetting Ponzi schemes) for the super-rich to park their wealth and prosper.
This great reset envisages a transformation of Western societies, resulting in permanent restrictions on fundamental liberties and mass surveillance. Being rolled out under the benign term of a ‘Fourth Industrial Revolution’, the World Economic Forum (WEF) says the public will eventually ‘rent’ everything they require (remember the WEF video ‘you will own nothing and be happy’?): stripping the right of ownership under the guise of a ‘green economy’ and underpinned by the rhetoric of ‘sustainable consumption’ and ‘climate emergency’.
Climate alarmism and the mantra of sustainability are about promoting money-making schemes. But they also serve another purpose: social control.
Neoliberalism has run its course, resulting in the impoverishment of large sections of the population. But to dampen dissent and lower expectations, the levels of personal freedom we have been used to will not be tolerated. This means that the wider population will be subjected to the discipline of an emerging surveillance state.
To push back against any dissent, ordinary people are being told that they must sacrifice personal liberty in order to protect public health, societal security (those terrible Russians, Islamic extremists or that Sunak-designated bogeyman George Galloway) or the climate. Unlike in the old normal of neoliberalism, an ideological shift is occurring whereby personal freedoms are increasingly depicted as being dangerous because they run counter to the collective good.
The real reason for this ideological shift is to ensure that the masses get used to lower living standards and accept them. Consider, for instance, the Bank of England’s chief economist Huw Pill saying that people should ‘accept’ being poorer. And then there is Rob Kapito of the world’s biggest asset management firm BlackRock, who says that a “very entitled” generation must deal with scarcity for the first time in their lives.
At the same time, to muddy the waters, the message is that lower living standards are the result of the conflict in Ukraine and supply shocks that both the war and ‘the virus’ have caused.
The net-zero carbon emissions agenda will help legitimise lower living standards (reducing your carbon footprint) while reinforcing the notion that our rights must be sacrificed for the greater good. You will own nothing, not because the rich and their neoliberal agenda made you poor but because you will be instructed to stop being irresponsible and must act to protect the planet.
NET-ZERO AGENDA
But what of this shift towards net-zero greenhouse gas emissions and the plan to slash our carbon footprints? Is it even feasible or necessary?
Gordon Hughes, a former World Bank economist and current professor of economics at the University of Edinburgh, says in a new report that current UK and European net-zero policies will likely lead to further economic ruin.
Apparently, the only viable way to raise the cash for sufficient new capital expenditure (on wind and solar infrastructure) would be a two decades-long reduction in private consumption of up to 10 per cent. Such a shock has never occurred in the last century outside war; even then, never for more than a decade.
But this agenda will also cause serious environmental degradation. So says Andrew Nikiforuk in the article The Rising Chorus of Renewable Energy Skeptics, which outlines how the green techno-dream is vastly destructive.
He lists the devastating environmental impacts of an even more mineral-intensive system based on renewables and warns:
“The whole process of replacing a declining system with a more complex mining-based enterprise is now supposed to take place with a fragile banking system, dysfunctional democracies, broken supply chains, critical mineral shortages and hostile geopolitics.”
All of this assumes that global warming is real and anthropogenic. Not everyone agrees. In the article Global warming and the confrontation between the West and the rest of the world, journalist Thierry Meyssan argues that net zero is based on political ideology rather than science. But to state such things has become heresy in the Western countries and shouted down with accusations of ‘climate science denial’.
Regardless of such concerns, the march towards net zero continues, and key to this is the United Nations Agenda 2030 for Sustainable Development Goals.
Today, almost every business or corporate report, website or brochure includes a multitude of references to ‘carbon footprints’, ‘sustainability’, ‘net zero’ or ‘climate neutrality’ and how a company or organisation intends to achieve its sustainability targets. Green profiling, green bonds and green investments go hand in hand with displaying ‘green’ credentials and ambitions wherever and whenever possible.
It seems anyone and everyone in business is planting their corporate flag on the summit of sustainability. Take Sainsbury’s, for instance. It is one of the ‘big six’ food retail supermarkets in the UK and has a vision for the future of food that it published in 2019.
Here’s a quote from it:
“Personalised Optimisation is a trend that could see people chipped and connected like never before. A significant step on from wearable tech used today, the advent of personal microchips and neural laces has the potential to see all of our genetic, health and situational data recorded, stored and analysed by algorithms which could work out exactly what we need to support us at a particular time in our life. Retailers, such as Sainsbury’s could play a critical role to support this, arranging delivery of the needed food within thirty minutes — perhaps by drone.”
Tracked, traced and chipped — for your own benefit. Corporations accessing all of our personal data, right down to our DNA. The report is littered with references to sustainability and the climate or environment, and it is difficult not to get the impression that it is written so as to leave the reader awestruck by the technological possibilities.
However, the promotion of a brave new world of technological innovation that has nothing to say about power — who determines policies that have led to massive inequalities, poverty, malnutrition, food insecurity and hunger and who is responsible for the degradation of the environment in the first place — is nothing new.
The essence of power is conveniently glossed over, not least because those behind the prevailing food regime are also shaping the techno-utopian fairytale where everyone lives happily ever after eating bugs and synthetic food while living in a digital panopticon.
FAKE GREEN
The type of ‘green’ agenda being pushed is a multi-trillion market opportunity for lining the pockets of rich investors and subsidy-sucking green infrastructure firms and also part of a strategy required to secure compliance required for the ‘new normal’.
It is, furthermore, a type of green that plans to cover much of the countryside with wind farms and solar panels with most farmers no longer farming. A recipe for food insecurity.
Those investing in the ‘green’ agenda care first and foremost about profit. The supremely influential BlackRock invests in the current food system that is responsible for polluted waterways, degraded soils, the displacement of smallholder farmers, a spiralling public health crisis, malnutrition and much more.
It also invests in healthcare — an industry that thrives on the illnesses and conditions created by eating the substandard food that the current system produces. Did Larry Fink, the top man at BlackRock, suddenly develop a conscience and become an environmentalist who cares about the planet and ordinary people? Of course not.
Any serious deliberations on the future of food would surely consider issues like food sovereignty, the role of agroecology and the strengthening of family farms — the backbone of current global food production.
The aforementioned article by Andrew Nikiforuk concludes that, if we are really serious about our impacts on the environment, we must scale back our needs and simplify society.
In terms of food, the solution rests on a low-input approach that strengthens rural communities and local markets and prioritises smallholder farms and small independent enterprises and retailers, localised democratic food systems and a concept of food sovereignty based on self-sufficiency, agroecological principles and regenerative agriculture.
It would involve facilitating the right to culturally appropriate food that is nutritionally dense due to diverse cropping patterns and free from toxic chemicals while ensuring local ownership and stewardship of common resources like land, water, soil and seeds.
That’s where genuine environmentalism and the future of food begins.
Government
Five Aerospace Investments to Buy as Wars Worsen Copy
Five aerospace investments to buy as wars worsen give investors a chance to acquire shares of companies focused on fortifying national defense. The five…
Share this:

Five aerospace investments to buy as wars worsen give investors a chance to acquire shares of companies focused on fortifying national defense.
The five aerospace investments to buy provide military products to help protect freedom amid Russia’s ongoing onslaught against Ukraine that began in February 2022, as well as supply arms in the Middle East used after Hamas militants attacked and murdered civilians in Israel on Oct. 7. Even though the S&P 500 recently reached all-time highs, these five aerospace investments have remained reasonably priced and rated as recommendations by seasoned analysts and a pension fund chairman.
State television broadcasts in Russia show the country’s soldiers advancing further into Ukrainian territory, but protests have occurred involving family members of those serving in perilous conditions in the invasion of their neighboring nation to be brought home. Even though hundreds of thousands of Russians also have fled to other countries to avoid compulsory military service, the aggressor’s President Vladimir Putin has vowed to continue to send additional soldiers into the fierce fighting.
While Russia’s land-grab of Crimea and other parts of Ukraine show no end in sight, Israel’s war with Hamas likely will last for at least additional months, according to the latest reports. United Nations’ leaders expressed alarm on Dec. 26 about intensifying Israeli attacks that killed more than 100 Palestinians over two days in part of the Gaza Strip, when 15 members of the Israel Defense Force (IDF) also lost their lives.
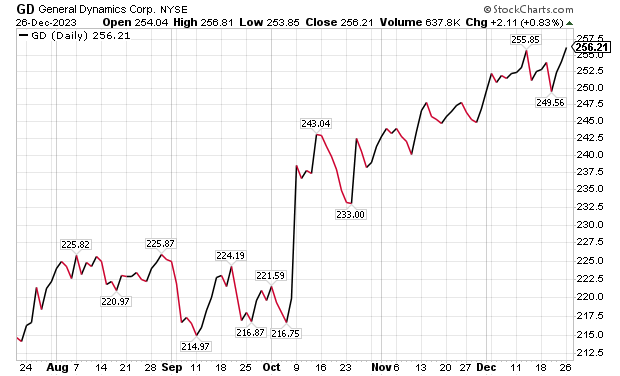
Five Aerospace Investments to Buy as Wars Worsen: General Dynamics
One of the five aerospace investments to buy as wars worsen is General Dynamics (NYSE: GD), a Reston, Virginia-based aerospace company with more than 100,000 employees in 70-plus countries. A key business unit of General Dynamics is Gulfstream Aerospace Corporation, a manufacturer of business aircraft. Other segments of General Dynamics focus on making military products such as Abrams tanks, Stryker fighting vehicles, ASCOD fighting vehicles like the Spanish PIZARRO and British AJAX, LAV-25 Light Armored Vehicles and Flyer-60 lightweight tactical vehicles.
For the U.S. Navy and other allied armed forces, General Dynamics builds Virginia-class attack submarines, Columbia-class ballistic missile submarines, Arleigh Burke-class guided missile destroyers, Expeditionary Sea Base ships, fleet logistics ships, commercial cargo ships, aircraft and naval gun systems, Hydra-70 rockets, military radios and command and control systems. In addition, the company provides radio and optical telescopes, secure mobile phones, PIRANHA and PANDUR wheeled armored vehicles and mobile bridge systems.
Chicago-based investment firm William Blair & Co. is among those recommending General Dynamics. The Chicago firm gave an “outperform” rating to General Dynamics in a Dec. 21 research note.
Gulfstream is seeking G700 FAA certification by the end of 2023, suggesting potentially positive news in the next 10 days, William Blair wrote in its recent research note. The investment firm projected that General Dynamics would trade upward upward upon the G700’s certification.
“General Dynamics’ 2023 aircraft delivery guidance of approximately 134 planes assumes that 19 G700s are delivered in the fourth quarter,” wrote William Blair’s aerospace and defense analyst Louie DiPalma. “Even if deliveries fall short of this target, we believe investors will take a glass-half-full approach upon receipt of the certification.”
Chart courtesy of www.stockcharts.com.
Five Aerospace Investments to Buy as Wars Worsen: GD Outlook
The G700 is a major focus area for investors because it is Gulfstream’s most significant aircraft introduction since the iconic G650 in 2012, DiPalma wrote. Gulfstream has the highest market share in the long-range jet segment of the private aircraft market, the highest profit margin of aircraft peers and the most premium business aviation brand, he added.
“The aircraft remains immensely popular today with corporations and high-net-worth individuals,” Di Palma wrote. “Elon Musk has reportedly placed an order for a G700 to go along with his existing G650. Qatar Airways announced at the Paris Air Show that 10 G700 aircraft will become part of its fleet.”
G700 deliveries and subsequent G800 deliveries are expected to be the cornerstone of Gulfstream’s growth and margin expansion for the next decade, DiPalma wrote. This should lead to a rebound in the stock price as the margins for the G700 and G800 are very attractive, he added.
Management’s guidance is for the aerospace operating margin to increase from about 13.2% in 2022 to roughly 14.0% in 2023 and 15.8% in 2024. Longer term, a high-teens profit margin appears within reach, DiPalma projected.
In other General Dynamics business segments, William Blair expects several yet-unannounced large contract awards for General Dynamics IT, to go along with C$1.7 billion, or US$1.29 billion, in General Dynamics Mission Systems contracts announced on Dec. 20 for the Canadian Army. General Dynamics shares are poised to have a strong 2024, William Blair wrote.
Five Aerospace Investments to Buy as Wars Worsen: VSE Corporation
Alexandria, Virginia-based VSE Corporation’s (NASDAQ: VSEC) price-to-earnings (P/E) valuation multiple of 22 received support when AAR Corp. (NYSE: AIR), a Wood Dale, Illinois, provider of aviation services, announced on Dec. 21 that it would acquire the product support business of Triumph Group (NYSE: TGI), a Berwyn, Pennsylvania, supplier of aerospace services, structures and systems. AAR’s purchase price of $725 million reflects confidence in a continued post-pandemic aerospace rebound.
VSE, a provider of aftermarket distribution and repair services for land, sea and air transportation assets used by government and commercial markets, is rated “outperform” by William Blair. The company’s core services include maintenance, repair and operations (MRO), parts distribution, supply chain management and logistics, engineering support, as well as consulting and training for global commercial, federal, military and defense customers.
“Robust consumer travel demand and aging aircraft fleets have driven elevated maintenance visits,” William Blair’s DiPalma wrote in a Dec. 21 research note. “The AAR–Triumph deal is valued at a premium 13-times 2024 EBITDA multiple, which was in line with the valuation multiple that Heico (NYSE: HEI) paid for Wencor over the summer.”
VSE currently trades at a discounted 9.5 times consensus 2024 earnings before interest, taxes, depreciation and amortization (EBITDA) estimates, as well as 11.6 times consensus 2023 EBITDA.
Five Aerospace Investments to Buy as Wars Worsen: VSE Undervalued?
“We expect that VSE shares will trend higher as investors process this deal,” DiPalma wrote. “VSE shares trade at 9.5 times consensus 2024 adjusted EBITDA, compared with peers and M&A comps in the 10-to-14-times range. We think that VSE’s multiple will expand as it closes the divestiture of its federal and defense business and makes strategic acquisitions. We see consistent 15% annual upside for shares as VSE continues to take share in the $110 billion aviation aftermarket industry.”
William Blair reaffirmed its “outperform” rating for VSE on Dec. 21. The main risk to VSE shares is lumpiness associated with its aviation services margins, Di Palma wrote. However, he raised 2024 estimates to further reflect commentary from VSE’s analysts’ day in November.

Chart courtesy of www.stockcharts.com.
Five Aerospace Investments to Buy as Wars Worsen: HEICO Corporation
HEICO Corporation (NYSEL: HEI), is a Hollywood, Florida-based technology-driven aerospace, industrial, defense and electronics company that also is ranked as an “outperform” investment by William Blair’s DiPalma. The aerospace aftermarket parts provider recently reported fourth-quarter financials above consensus analysts’ estimates, driven by 20% organic growth in HEICO’s flight support group.
HEICO’s management indicated that the performance of recently acquired Wencor is exceeding expectations. However, HEICO leaders offered color on 2024 organic growth and margin expectations that forecast reduced gains. Even though consensus estimates already assumed slowing growth, it is still not a positive for HEICO, DiPalma wrote.
William Blair forecasts 15% annual upside to HEICO’s shares, based on EBITDA growth. HEICO’s management cited a host of reasons for its quarterly outperformance, highlighted by the continued commercial air travel recovery. The company also referenced new product introductions and efficiency initiatives.
HEICO’s defense product sales increased by 26% sequentially, marking the third consecutive sequential increase in defense product revenue. The company’s leaders conveyed that defense in general is moving in the right direction to enhance financial performance.

Chart courtesy of www.stockcharts.com.
Five Dividend-paying Defense and Aerospace Investments to Purchase: XAR
A fourth way to obtain exposure to defense and aerospace investments is through SPDR S&P Aerospace and Defense ETF (XAR). That exchange-traded fund tracks the S&P Aerospace & Defense Select Industry Index. The fund is overweight in industrials and underweight in technology and consumer cyclicals, said Bob Carlson, a pension fund chairman who heads the Retirement Watch investment newsletter.

Bob Carlson, who heads Retirement Watch, answers questions from Paul Dykewicz.
XAR has 34 securities, and 44.2% of the fund is in the 10 largest positions. The fund is up 25.82% in the last 12 months, 22.03% in the past three months and 7.92% for the last month. Its dividend yield recently measured 0.38%.
The largest positions in the fund recently were Axon Enterprise (NASDAQ: AXON), Boeing (NYSE: BA), L3Harris Technologies (NYSE: LHX), Spirit Aerosystems (NYSE: SPR) and Virgin Galactic (NYSE: SPCE).

Chart courtesy of www.stockcharts.com
Five Dividend-paying Defense and Aerospace Investments to Purchase: PPA
The second fund recommended by Carlson is Invesco Aerospace & Defense ETF (PPA), which tracks the SPADE Defense Index. It has the same underweighting and overweighting as XAR, he said.
PPA recently held 52 securities and 53.2% of the fund was in its 10 largest positions. With so many holdings, the fund offers much reduced risk compared to buying individual stocks. The largest positions in the fund recently were Boeing (NYSE: BA), RTX Corp. (NYSE: RTX), Lockheed Martin (NYSE: LMT), Northrop Grumman (NYSE: NOC) and General Electric (NYSE:GE).
The fund is up 19.07% for the past year, 50.34% in the last three months and 5.30% during the past month. The dividend yield recently touched 0.69%.

Chart courtesy of www.stockcharts.com
Other Fans of Aerospace
Two fans of aerospace stocks are Mark Skousen, PhD, and seasoned stock picker Jim Woods. The pair team up to head the Fast Money Alert advisory service They already are profitable in their recent recommendation of Lockheed Martin (NYSE: LMT) in Fast Money Alert.

Mark Skousen, a scion of Ben Franklin, meets with Paul Dykewicz.

Jim Woods, a former U.S. Army paratrooper, co-heads Fast Money Alert.
Bryan Perry, who heads the Cash Machine investment newsletter and the Micro-Cap Stock Trader advisory service, recommends satellite services provider Globalstar (NYSE American: GSAT), of Covington, Louisiana, that has jumped 50.00% since he advised buying it two months ago. Perry is averaging a dividend yield of 11.14% in his Cash Machine newsletter but is breaking out with the red-hot recommendation of Globalstar in his Micro-Cap Stock Trader advisory service.

Bryan Perry heads Cash Machine, averaging an 11.14% dividend yield.
Military Equipment Demand Soars amid Multiple Wars
The U.S. military faces an acute need to adopt innovation, to expedite implementation of technological gains, to tap into the talents of people in various industries and to step-up collaboration with private industry and international partners to enhance effectiveness, U.S. Joint Chiefs of Staff Gen. Charles Q. Brown Jr. told attendees on Nov 16 at a national security conference. Prime examples of the need are showed by multiple raging wars, including the Middle East and Ukraine. A cold war involves China and its increasingly strained relationships with Taiwan and other Asian nations.
The shocking Oct. 7 attack by Hamas on Israel touched off an ongoing war in the Middle East, coupled with Russia’s February 2022 invasion and continuing assault of neighboring Ukraine. Those brutal military conflicts show the fragility of peace when determined aggressors are willing to use any means necessary to achieve their goals. To fend off such attacks, rapid and effective response is required.
“The Department of Defense is doing more than ever before to deter, defend, and, if necessary, defeat aggression,” Gen. Brown said at the National Security Innovation Forum at the Johns Hopkins University Bloomberg Center in Washington, D.C.
One of Russia’s war ships, the 360-foot-long Novocherkassk, was damaged on Dec. 26 by a Ukrainian attack on the Black Sea port of Feodosia in Crimea. This video of an explosion at the port that reportedly shows a section of the ship hit by aircraft-guided missiles.

Chairman Joint Chiefs of Staff Gen. Charles Q. Brown, Jr.
Photo By: Benjamin Applebaum
National security threats can compel immediate action, Gen. Brown said he quickly learned since taking his post on Oct. 1.
“We may not have much warning when the next fight begins,” Gen. Brown said. “We need to be ready.”
In a pre-recorded speech at the national security conference, Michael R. Bloomberg, founder of Bloomberg LP, told the John Hopkins national security conference attendees about the critical need for collaboration between government and industry.
“Building enduring technological advances for the U.S. military will help our service members and allies defend freedom across the globe,” Bloomberg said.
The “horrific terrorist attacks” against Israel and civilians living there on Oct. 7 underscore the importance of that mission, Bloomberg added.
Paul Dykewicz, www.pauldykewicz.com, is an accomplished, award-winning journalist who has written for Dow Jones, the Wall Street Journal, Investor’s Business Daily, USA Today, the Journal of Commerce, Seeking Alpha, Guru Focus and other publications and websites. Attention Holiday Gift Buyers! Consider purchasing Paul’s inspirational book, “Holy Smokes! Golden Guidance from Notre Dame’s Championship Chaplain,” with a foreword by former national championship-winning football coach Lou Holtz. The uplifting book is great gift and is endorsed by Joe Montana, Joe Theismann, Ara Parseghian, “Rocket” Ismail, Reggie Brooks, Dick Vitale and many others. Call 202-677-4457 for special pricing on multiple-book purchases or autographed copies! Follow Paul on Twitter @PaulDykewicz. He is the editor of StockInvestor.com and DividendInvestor.com, a writer for both websites and a columnist. He further is editorial director of Eagle Financial Publications in Washington, D.C., where he edits monthly investment newsletters, time-sensitive trading alerts, free e-letters and other investment reports. Paul previously served as business editor of Baltimore’s Daily Record newspaper, after writing for the Baltimore Business Journal and Crain Communications.
The post Five Aerospace Investments to Buy as Wars Worsen Copy appeared first on Stock Investor.
dow jones sp 500 nasdaq stocks pandemic etf micro-cap army recovery russia ukraine chinaInternational
Health Officials: Man Dies From Bubonic Plague In New Mexico
Health Officials: Man Dies From Bubonic Plague In New Mexico
Authored by Jack Phillips via The Epoch Times (emphasis ours),
Officials in…
Share this:


Authored by Jack Phillips via The Epoch Times (emphasis ours),
Officials in New Mexico confirmed that a resident died from the plague in the United States’ first fatal case in several years.
The New Mexico Department of Health, in a statement, said that a man in Lincoln County “succumbed to the plague.” The man, who was not identified, was hospitalized before his death, officials said.
They further noted that it is the first human case of plague in New Mexico since 2021 and also the first death since 2020, according to the statement. No other details were provided, including how the disease spread to the man.
The agency is now doing outreach in Lincoln County, while “an environmental assessment will also be conducted in the community to look for ongoing risk,” the statement continued.
“This tragic incident serves as a clear reminder of the threat posed by this ancient disease and emphasizes the need for heightened community awareness and proactive measures to prevent its spread,” the agency said.
A bacterial disease that spreads via rodents, it is generally spread to people through the bites of infected fleas. The plague, known as the black death or the bubonic plague, can spread by contact with infected animals such as rodents, pets, or wildlife.
The New Mexico Health Department statement said that pets such as dogs and cats that roam and hunt can bring infected fleas back into homes and put residents at risk.
Officials warned people in the area to “avoid sick or dead rodents and rabbits, and their nests and burrows” and to “prevent pets from roaming and hunting.”
“Talk to your veterinarian about using an appropriate flea control product on your pets as not all products are safe for cats, dogs or your children” and “have sick pets examined promptly by a veterinarian,” it added.
“See your doctor about any unexplained illness involving a sudden and severe fever, the statement continued, adding that locals should clean areas around their home that could house rodents like wood piles, junk piles, old vehicles, and brush piles.
The plague, which is spread by the bacteria Yersinia pestis, famously caused the deaths of an estimated hundreds of millions of Europeans in the 14th and 15th centuries following the Mongol invasions. In that pandemic, the bacteria spread via fleas on black rats, which historians say was not known by the people at the time.
Other outbreaks of the plague, such as the Plague of Justinian in the 6th century, are also believed to have killed about one-fifth of the population of the Byzantine Empire, according to historical records and accounts. In 2013, researchers said the Justinian plague was also caused by the Yersinia pestis bacteria.
But in the United States, it is considered a rare disease and usually occurs only in several countries worldwide. Generally, according to the Mayo Clinic, the bacteria affects only a few people in U.S. rural areas in Western states.
Recent cases have occurred mainly in Africa, Asia, and Latin America. Countries with frequent plague cases include Madagascar, the Democratic Republic of Congo, and Peru, the clinic says. There were multiple cases of plague reported in Inner Mongolia, China, in recent years, too.
Symptoms
Symptoms of a bubonic plague infection include headache, chills, fever, and weakness. Health officials say it can usually cause a painful swelling of lymph nodes in the groin, armpit, or neck areas. The swelling usually occurs within about two to eight days.
The disease can generally be treated with antibiotics, but it is usually deadly when not treated, the Mayo Clinic website says.
“Plague is considered a potential bioweapon. The U.S. government has plans and treatments in place if the disease is used as a weapon,” the website also says.
According to data from the U.S. Centers for Disease Control and Prevention, the last time that plague deaths were reported in the United States was in 2020 when two people died.


IFM’s Hat Trick and Reflections On Option-To-Buy M&A


Q4 Update: Delinquencies, Foreclosures and REO


Pharma industry reputation remains steady at a ‘new normal’ after Covid, Harris Poll finds


Net Zero, The Digital Panopticon, & The Future Of Food


Part 1: Current State of the Housing Market; Overview for mid-March 2024


Riley Gaines Explains How Women’s Sports Are Rigged To Promote The Trans Agenda


Health Officials: Man Dies From Bubonic Plague In New Mexico


Five Aerospace Investments to Buy as Wars Worsen Copy


Analyst reviews Apple stock price target amid challenges


The SNF Institute for Global Infectious Disease Research announces new advisory board
-

 Uncategorized3 weeks ago
All Of The Elements Are In Place For An Economic Crisis Of Staggering Proportions
-

 International6 days ago
EyePoint poaches medical chief from Apellis; Sandoz CFO, longtime BioNTech exec to retire
-

 Uncategorized4 weeks ago
California Counties Could Be Forced To Pay $300 Million To Cover COVID-Era Program
-

 Uncategorized3 weeks ago
Apparel Retailer Express Moving Toward Bankruptcy
-

 Uncategorized4 weeks ago
Industrial Production Decreased 0.1% in January
-

 International6 days ago
Walmart launches clever answer to Target’s new membership program
-

 Uncategorized4 weeks ago
RFK Jr: The Wuhan Cover-Up & The Rise Of The Biowarfare-Industrial Complex
-

 Uncategorized3 weeks ago
GOP Efforts To Shore Up Election Security In Swing States Face Challenges