Uncategorized
Sector Spotlight: Keep An Eye; This Could Be A Massive Multiyear Breakout
There is no debate when it comes to concluding that 2022 has been a choppy year for equities globally. The markets had to deal with all sorts of things;…
Share this:

There is no debate when it comes to concluding that 2022 has been a choppy year for equities globally. The markets had to deal with all sorts of things; rising inflation, fear of recession, geopolitical tensions, and a slew of rate highs from the central banks all over the world. Having said this, these situations presented us with a need almost all the time to stay invested in a sector that is resilient and presents stability to at least a portion of any investor's portfolio. The NIFTY PSE Sector, represented by NIFTY PSE Index ($CNXPSE) is one such sector.
The NIFTY PSE Index comprises of companies in which 51% of outstanding share capital is held by the Central Government and/or State Government, directly or indirectly.
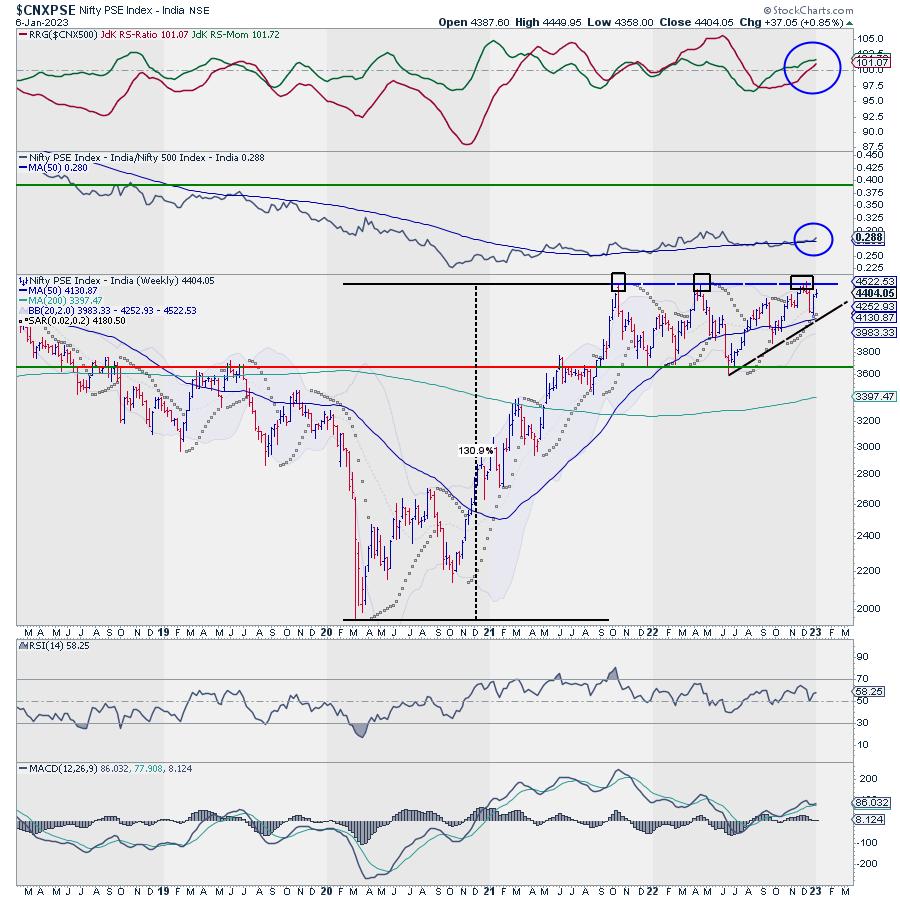
A glance at the weekly charts presents an interesting picture; a glance at the long-term monthly charts presents an even more interesting picture which is the real source of excitement. Let us begin with the weekly chart first.
After forming the pandemic lows in March 2020, $CNXPSE has risen 130% as of today. It rose from the lows formed near the 1960-1990 zones and formed its peak above 4400 levels in October 2021. Despite resilient relative performance many times in the past year, this sector has not returned anything practically over the last 14 months as it stays at the same level that was seen in October 2021.
Looking from a short to medium-term perspective, it is seen oscillating in a trading range of 3650-4450 levels. The level of 4400 has been tested at least thrice since October 21; it appears to be making higher bottoms within this area pattern and may stage a breakout if it moves meaningfully above 4500 levels.
That is not all. If we zoom out and take a long-term view, this is where the real excitement comes in. Let us take a look at the long-term monthly chart of $CNXPSE.

Following its inception in January 1995, the NIFTY PSE Index marked its low point near 325-330 levels in September 2001. Beginning from this time until the peak formed near 4400 in January 2008, this index ended up returning impressive 1400+% returns in just over 6 years. However, from January 2008 until now, the index has not returned anything in 14 years as it stays at the same level today as it was in January 2008.
Intermittent outperformance apart, the Index tested the 4400-4500 levels in January 2008, a few times between September and December 2017, and a few times over the past 14 months.
This translates into the fact that unless you invested in the PSE pocket during pandemic lows, you have received well over 130% returns; however, if you are invested since 2008, you have received nothing over the past 15 years.
How would Investors track and stay invested in this pocket?
The answer to this could be in perhaps two ways.
For Active Investors, it would mean actively tracking the rotations and staying invested in the stocks with strong relative momentum within the Nifty PSE Index. As of now, the picture stands as under:

The above RRG shows NIFTY PSE Constituents benchmarked against the NIFTY PSE Index. The ones circled in blue and green are the ones that are seen relatively outperforming the benchmark.
For Passive Investors, the approach may be slightly different. They may just stay invested in the Index constituents in the proportion of their weight in the Index.

Interestingly, the NIFTY PSE Index is made up of 20 stocks. However, the top 10 stocks represent 76.37% of the Index. Tracking and staying invested in these stocks should serve the purpose enough!
What makes this pocket resilient and safe?
This group enjoys a positive to strongly positive correlation with the frontline NIFTY 50 Index. Over the past year, it has seen a correlation of 0.63, but over 5 years and since inception, it has seen a correlation of 0.70 and 0.74 with the Nifty.
The safety and resilience come with the Beta that this sector has against the NIFTY. It has a Beta below 1. Over the last one year, it has seen a Beta of 0.71. Over the last 5 years and since inception, it has a Beta of 0.83 against the NIFTY. This has ensured that in turbulent times, this group of stocks has declined less than the frontline index.
Conclusion?
Pretty much straightforward and simple. Watch out for a meaningful move above 4450-4500 in this index and we may be in for a multiyear breakout in this index!
Founder and Technical Analyst,
recession pandemic equities stocksUncategorized
Wall Street Bonuses Fall For Second Year To 2019 Lows Amid Capital Markets Freeze
Wall Street Bonuses Fall For Second Year To 2019 Lows Amid Capital Markets Freeze
Wall Street bonuses have declined for two consecutive years,…
Share this:

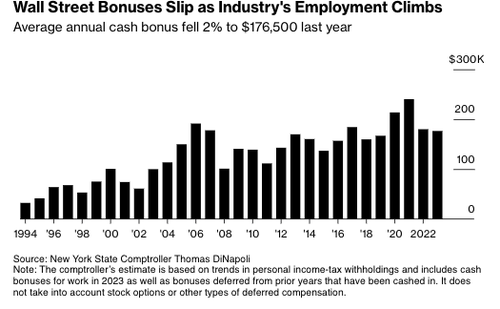
Wall Street bonuses have declined for two consecutive years, falling to levels last seen in 2019, according to the latest yearly figures released by New York State Comptroller Thomas P. DiNapoli. This trend is occurring amidst a multi-year downturn in capital markets due to the Federal Reserve's interest rate hiking cycle.
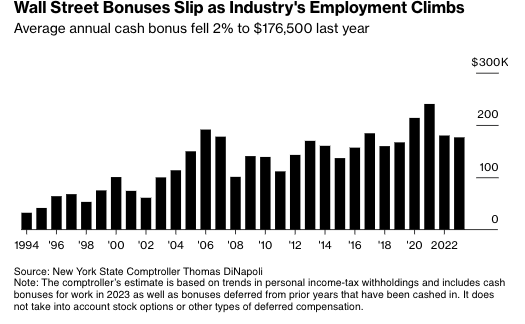
According to the report, the average Wall Street cash bonus fell 2% to $176,500 in 2023, the lowest level since 2019. The drop was far less than the 25% plunge in 2022. Last year's bonus pool was $33.8 billion, unchanged from the previous year but far less than the $42.7 billion during the stock market mania in 2021.
"Wall Street's average cash bonuses dipped slightly from last year, with continued market volatility and more people joining the securities workforce," DiNapoli said in a news release on Tuesday.
He continued: "While these bonuses affect income tax revenues for the state and city, both budgeted for larger declines so the impact on projected revenues should be limited."
"The securities industry's continued strength should not overshadow the broader economic picture in New York, where we need all sectors to enjoy full recovery from the pandemic," he added.
Despite the slump, the report said Wall Street's profits rose 1.8% last year, "but firms have taken a more cautious approach to compensation, and more employees have joined the securities industry, which accounts for the slight decline in the average bonus."
The report showed the industry employed 198,500 people in 2023, up from 191,600 the prior year. This expansion occurred during a period when US banks laid off 23,000 jobs.
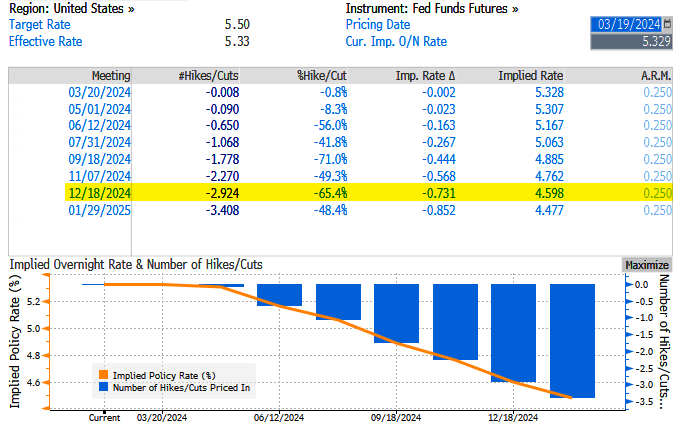
Given that swaps traders and economists at Goldman Sachs Group are forecasting fewer Fed interest-rate cuts this year, a higher-for-longer rates environment will continue to discourage capital-market activity.
There's about a 50% chance of a June cut. Over the last several months, the Fed's interest-rate target implied by overnight index swaps and SOFR futures went from 700bps of cuts to currently 292bps of cuts for the full year.
Any delay in the easing cycle will only mean another year of depressed bonuses for Wall Street.
Uncategorized
Caitlin Clark, Coach Prime, and Linsanity: The Anatomy of a Viewership ‘Craze’
This is a trying time for sports on television as the industry fights the headwinds of cord-cutting and media fragmentation. Television networks and leagues…
Share this:

This is a trying time for sports on television as the industry fights the headwinds of cord-cutting and media fragmentation. Television networks and leagues have taken measures that just a short time ago would have been considered extreme, desperate, or some combination of the two: an In-Season Tournament in the NBA; MLB in an Iowa cornfield; NASCAR inside the L.A. Coliseum. These efforts have been met with moderate success from a viewership standpoint, but they are not the type of needle-movers that drastically impact viewership in the aggregate. That type of shift requires a unicorn, and the last year has featured two: Caitlin Clark and Deion Sanders.
Clark has spent the past season breaking records on and off the court. Her Iowa Hawkeyes played in two of the four most watched college basketball games this season — regardless of gender. Both her record-breaking game against Ohio State and Big Ten Tournament championship win against Nebraska attracted over three million viewers. Only two men’s games, a Thanksgiving NFL lead-out between Michigan State and Arizona on FOX (5.18m), and a Duke-UNC game on ESPN (3.08m) also eclipsed the three million mark. Clark’s Big Ten Tournament semifinal against Michigan was the most watched women’s sporting event ever measured on Big Ten Network (1.08m). The championship game on CBS was the network’s most watched college basketball game of the year, men’s or women’s (pending results from this past weekend).
Of the six most watched women’s college basketball games this year, Clark played in five. Last year’s LSU-Iowa championship game delivered 9.9m viewers, the most ever for a women’s college game in the Nielsen people-meter era (dates back to 1988). The list could go on.
Deion Sanders — aka Coach Prime — transcended the sport of college football for a moment last fall. On his way to becoming Sports Illustrated Sportsperson of the Year, the Prime-fueled Colorado Buffaloes played in five of the fifteen most-watched regular season games of the year, more than any other school. Through the first five weeks of the season, Colorado played in either the first or second most-watched game of the week. Incredibly, that includes a Week 3 game against Colorado State that averaged 9.3 million viewers on ESPN, despite not kicking off until after 10 PM ET. That game drew four million more viewers than the second-most watched game that week, Georgia-South Carolina in the afternoon window on CBS. All of this for a team that won just one game the previous season.
Such viewership anomalies do not happen in a bubble; they are products of larger, media-driven forces. Think of last summer’s “Barbenheimer” craze for instance. Those two blockbuster films almost single-handedly lifted the box office from its pandemic-era depths. As many Hollywood analysts pointed out, the organic social media trend spurred from the strange juxtaposition of both movies being released on the same day led them to sell more tickets. Established media operations then picked up the story and fed into the trend. Social media isn’t always wagging the tail of traditional media, it can go both ways. The key to a true ‘craze’ however, is breaking through everywhere, no matter the media one consumes.
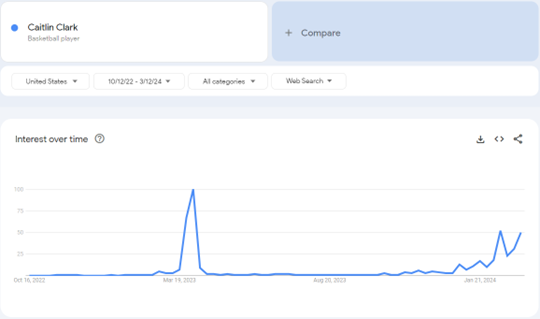
Maybe the most comparable sports craze in recent memory to the Clark-Sanders charged viewership of this past year is Linsanity. For a few weeks in 2012, New York Knicks guard Jeremy Lin broke out in a series of masterful performances that captured the imagination of the basketball world. Lin helped MSG Network improve its ratings by 82% through mid-February compared to the previous season — an absurd jump. However, Linsanity is perhaps also the most illustrative of another key factor in these viewership crazes: by definition, they are fleeting.
A look at Google search trends (below) puts these anomalies into perspective. Linsanity lasted about three weeks. Prime Time at Colorado was able to break through for about a month. Clark’s 2023 spike held for a few weeks in March, though her spike started much earlier this season, beginning to trend up in January. The lesson here, these massive viewership crazes are nice to have, can potentially raise the floor of a sport on the margins, but cannot be relied on for sustained viewership long term.
Caitlin Clark
Deion Sanders

Jeremy Lin

This isn’t to say these anomalies are without value. Networks have realized that facilitating these crazes help maintain healthy viewership in a difficult television environment. Thus, manufacturing these short-lived spikes could prove to be a key component of network’s strategies into the future. Last year for instance, FOX sent its Big Noon Kickoff show to a Colorado game four of the first five weeks of the season to help jump-start the Deion Sanders media blitz. ESPN’s College GameDay also setup shop in Boulder for the Week 3 game against Colorado State, the same week CBS’s 60 Minutes aired a Deion Sanders story.
As for Clark, ESPN recently announced that for the first time, it will embed a reporter (Holly Rowe) with Iowa for the team’s upcoming NCAA Tournament run. FOX gave Clark special treatment as well. When the network aired Caitlin Clark games this season, they would have her stat line permanently fixed on the scorebug. They livestreamed a “Caitlin Clark Cam” on TikTok. FOX even reportedly offered Clark an NIL package to incentivize her to play in college another year.
Of course, these crazes cannot solely be manufactured by the networks. There must be some truly organic interest in the subject for any of this to be possible. Between Clark and Sanders, there’s evidence to suggest that such crazes are becoming more frequent. Two in one year is notable when the last similar instance was Linsanity in 2012. This is partly due to the networks’ willingness to feed into these stories, though the growing desire in public life for shared experiences should not be discounted either.
Record-setting viewership has become commonplace for sporting events that have found ways to break into the monoculture. To be sure, some of that is because of Nielsen’s changes to out-of-home viewing measurements, though arguably the reason a property like the NFL has been so successful lately is because of its ubiquity in American life. Clark and Sanders have been able to simulate similar far-reaching appeal to generate viewership, albeit for shorter periods of time, and orders of magnitude smaller than the NFL.
A level of cultish personality, elite talent, or both seems prerequisite for a viewership craze to start. The level to which television networks will find ways to capitalize on these circumstances in the future remains to be seen. As traditional media fights for survival, with live sports as a main component, replicating Clark or Sanders-esque media booms may well become a substantial part of the formula. The next few years will be telling about how much influence traditional media still has in its agenda-setting role, and how far they’ll be willing to go to facilitate a media-induced frenzy.
The post Caitlin Clark, Coach Prime, and Linsanity: The Anatomy of a Viewership ‘Craze’ appeared first on Sports Media Watch.
fed pandemic treatmentUncategorized
100 sats would equal $1 if we repeat last cycle’s dollar demise
The inverse of the standard BTC/USD chart gives an interesting perspective on the rise in the purchasing power of Bitcoin over time. The USDT/BTC chart…
Share this:

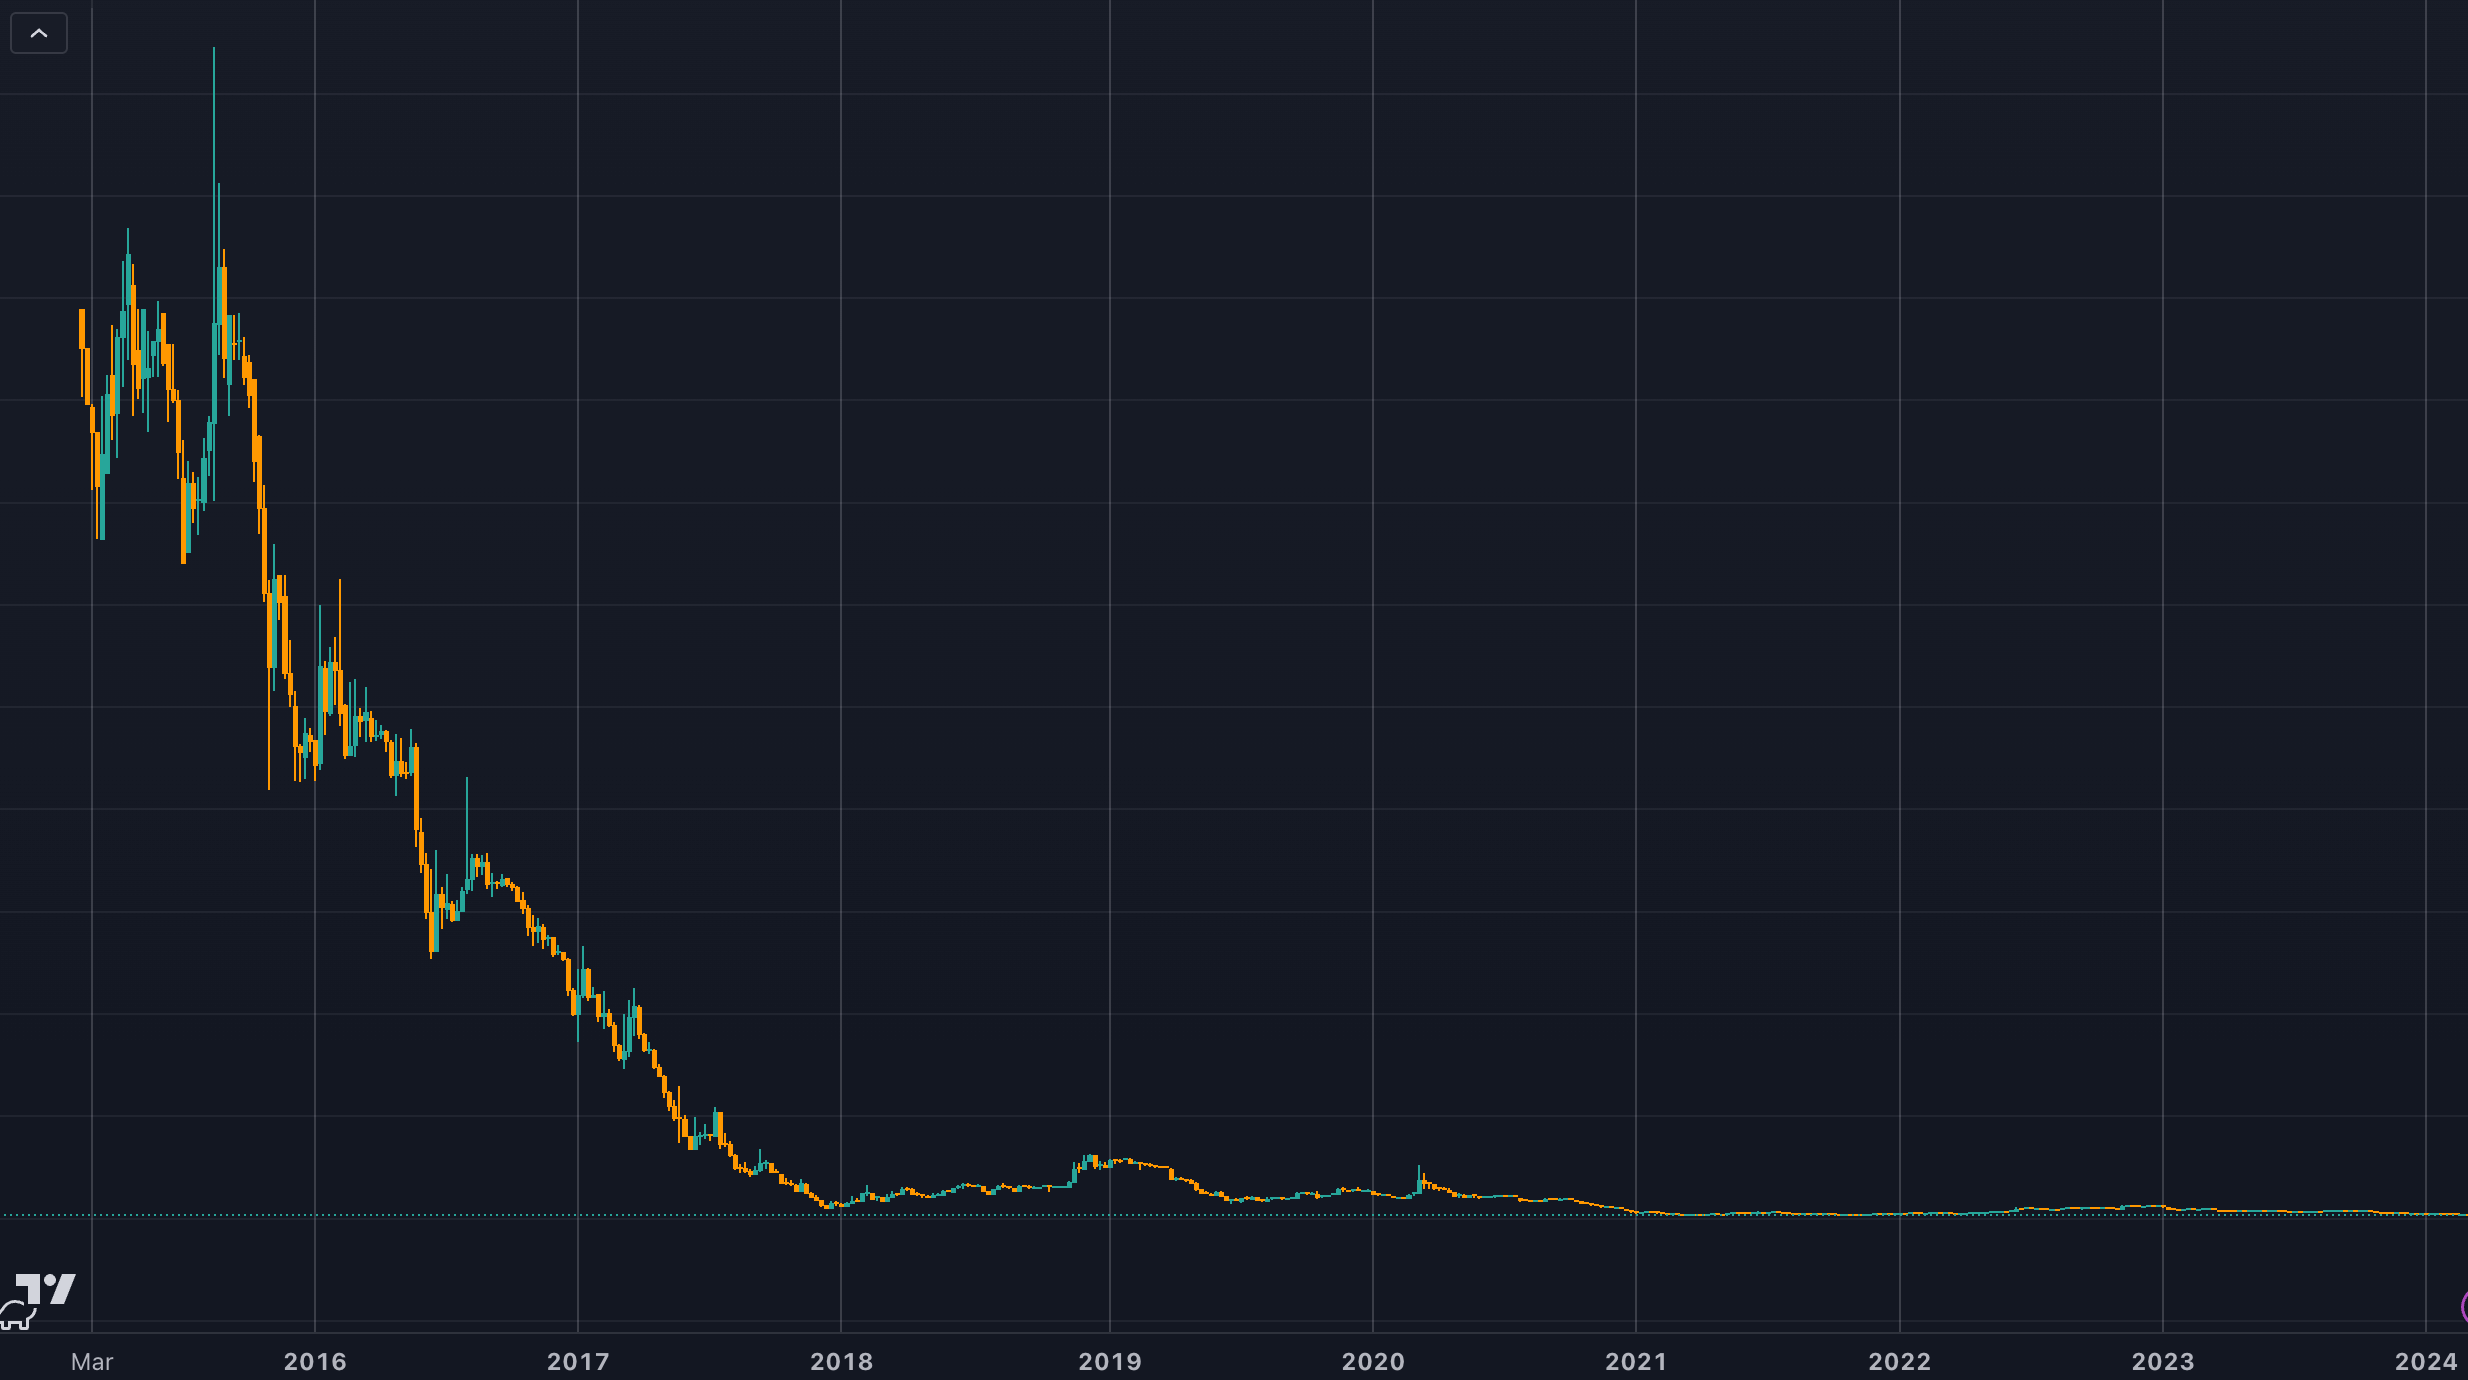
The inverse of the standard BTC/USD chart gives an interesting perspective on the rise in the purchasing power of Bitcoin over time. The USDT/BTC chart below highlights the dollar’s decline against Bitcoin since 2015. From its peak, the dollar has fallen 99.7% against Bitcoin.
When viewed in this form, it’s hard to be bearish on a 13% dip from a new all-time high.
When we look at the chart over a shorter timeframe in a log format, we can better analyze recent data. Since the COVID-19 crash of May 2020, the dollar has fallen 96% against Bitcoin. Currently, $1 equals around 1,580 satoshis (sats.) A further fall of just 36% would bring us to 1,000 per dollar.
Moreover, for 100 sats to equal $1, the dollar would only need to fall another 93.6%, less than the move last cycle. This would make 1 cent akin to 1 sat, bringing nominal parity between Bitcoin and the dollar in unit terms. The Bitcoin to USD increase would be approximately 1,500% to $1 million.

Finally, 10 sats per dollar would require a 99.4% decline, and 1 sat per dollar would total up to 100%. Bitcoin cannot be divided beyond 1 satoshi. Should Bitcoin ever be valued beyond $100 million per coin, we would run out of sufficient notation tools to delineate the exchange rate. However, that would give it a market cap of around $2 quadrillion, over 3 times the value of the world’s current wealth.
The post 100 sats would equal $1 if we repeat last cycle’s dollar demise appeared first on CryptoSlate.
bitcoin btc covid-19

Manufacturing and construction vs. the still-inverted yield curve


When words make you sick


Default: San Francisco Four Seasons Hotel Investors $3 Million Late On Loan As Foreclosure Looms


Caitlin Clark, Coach Prime, and Linsanity: The Anatomy of a Viewership ‘Craze’


Half Of Downtown Pittsburgh Office Space Could Be Empty In 4 Years


US Economic Conditions Scream “Buy Gold”


Airline, travel companies face Chapter 11 bankruptcy, default risk


Profits over patients: For-profit nursing home chains are draining resources from care while shifting huge sums to owners’ pockets


Wall Street Bonuses Fall For Second Year To 2019 Lows Amid Capital Markets Freeze


How much stress is too much? A psychiatrist explains the links between toxic stress and poor health − and how to get help
-

 Spread & Containment6 days ago
IFM’s Hat Trick and Reflections On Option-To-Buy M&A
-

 Uncategorized4 weeks ago
All Of The Elements Are In Place For An Economic Crisis Of Staggering Proportions
-

 International2 weeks ago
EyePoint poaches medical chief from Apellis; Sandoz CFO, longtime BioNTech exec to retire
-

 Uncategorized1 month ago
California Counties Could Be Forced To Pay $300 Million To Cover COVID-Era Program
-

 Uncategorized4 weeks ago
Apparel Retailer Express Moving Toward Bankruptcy
-

 Uncategorized1 month ago
Industrial Production Decreased 0.1% in January
-

 International2 weeks ago
Walmart launches clever answer to Target’s new membership program
-

 Uncategorized1 month ago
RFK Jr: The Wuhan Cover-Up & The Rise Of The Biowarfare-Industrial Complex