Uncategorized
Regional Bank Reckoning Looms As Regulators Call For FHLB Limits
Regional Bank Reckoning Looms As Regulators Call For FHLB Limits
Is Bill Gross about to face another big loser? On Nov 2nd, the former ‘bond…
Share this:

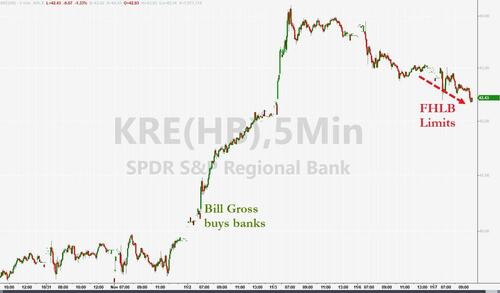
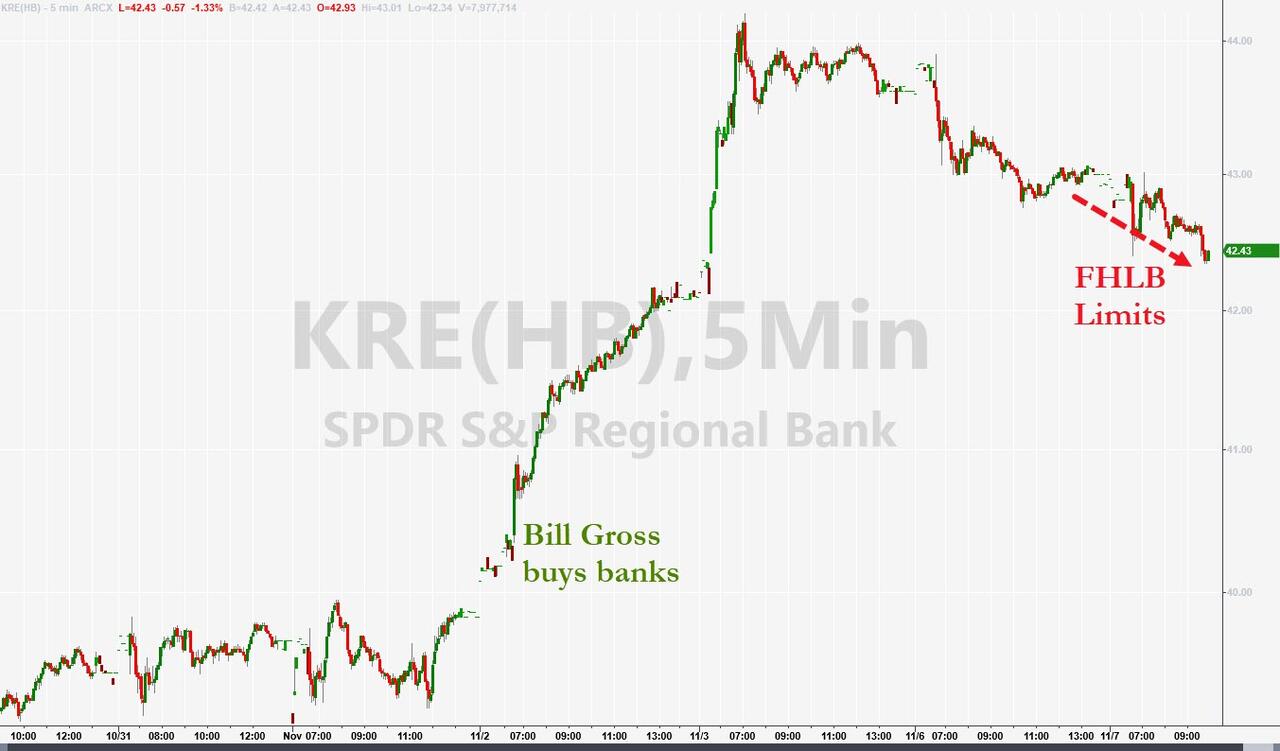
Is Bill Gross about to face another big loser? On Nov 2nd, the former 'bond king' wrote on X that "regional bank falling knife has hit bottom" adding that he was buying shares of Truist Financial, Citizens Financial Group, KeyCorp, and First Horizon.
The Regional Bank Index soared for two days after that, but the last two days have seen the index give some of those gains back...
And today, we get headlines that - on their face - would seem like very bad news for smaller banks as regulators push to close the cookie jar of cheap rescue cash that access to Federal Home Loan Banks has provided.
After a review of the system that lasted more than a year, the Federal Housing Finance Agency will move FHLBs away from serving as lenders of last resort for financial firms in turmoil, and back to their roots in housing finance. Specifically, the plans ratchet up federal oversight and seek to push banks toward the Fed’s discount window in times of extreme stress, according to a report to be published Tuesday.
As Bloomberg reports, banks borrow hundreds of billions of dollars from the government-chartered FHLBs each year to fulfill short-term funding needs.
The practice came under scrutiny after the FHLBs, which have implied backing from the government, lent heavily to Silicon Valley Bank, Signature Bank and First Republic Bank as they careened toward failure.
The report specifically notes that "concerns with FHLBank lending to significantly deteriorating financial institutions must be addressed."
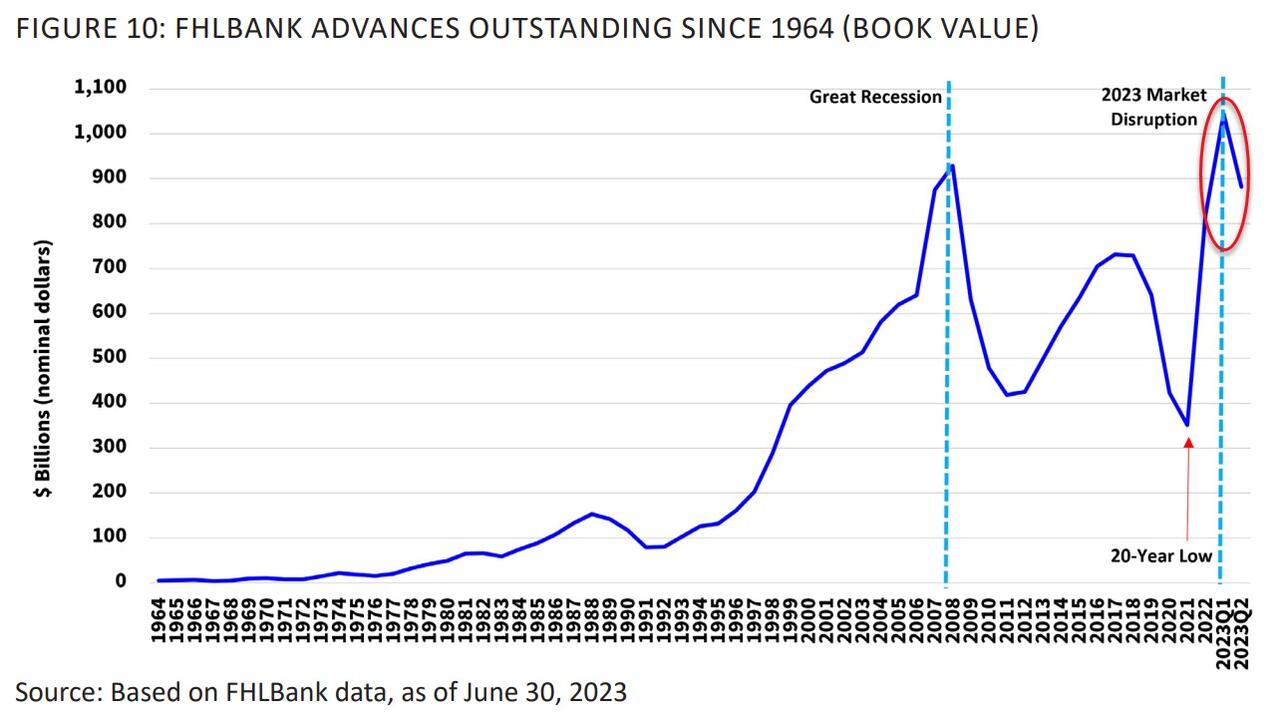
...advance volumes fell to 20-year lows in late 2021, coinciding with rising volumes of deposits that provided a liquidity cushion for commercial banks during the pandemic.
However, during the week beginning March 13, 2023, the FHLBanks funded $675.6 billion in advances, the largest one-week advance volume in FHLBank System history.
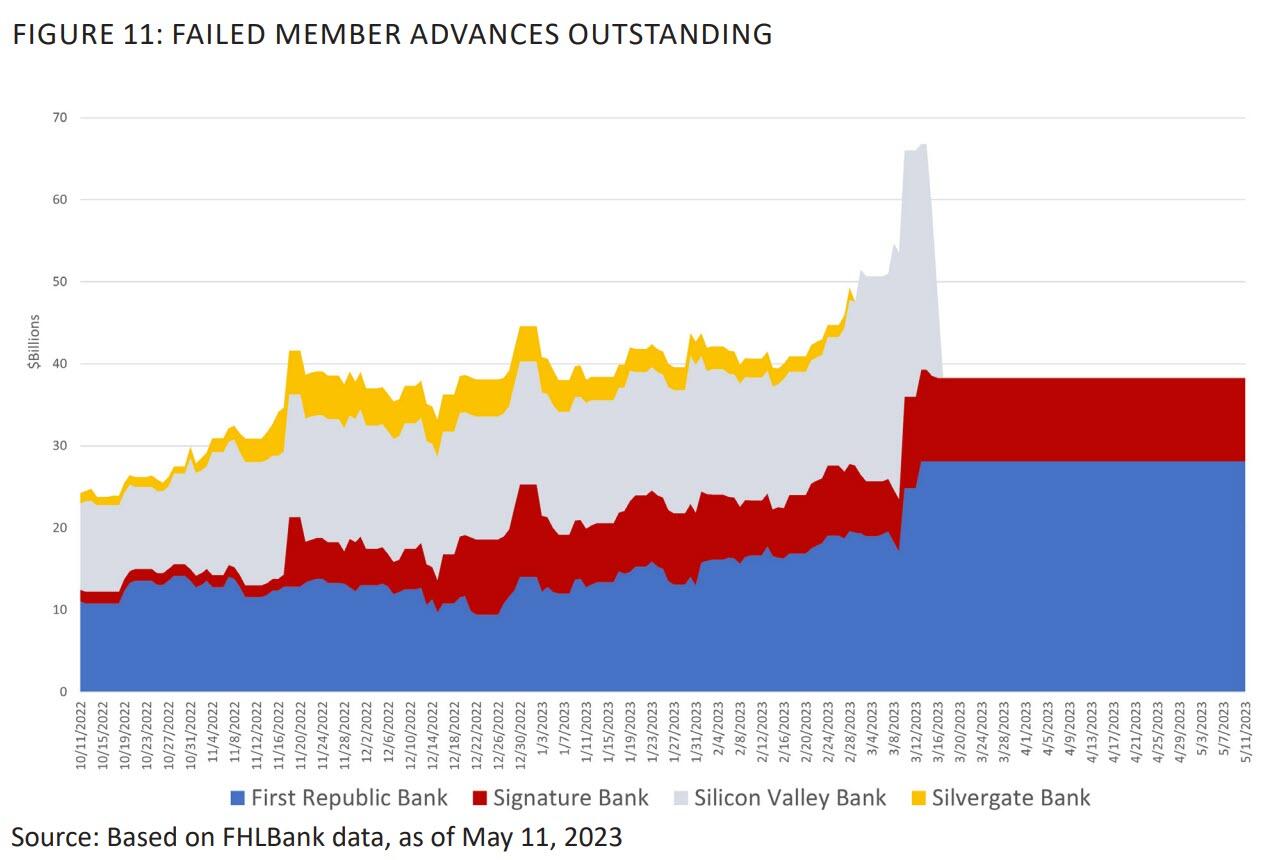
While the FHLBank advances helped many members withstand market stress, Silvergate Bank (an active borrower) voluntarily dissolved in the prior week.
Shortly thereafter, Silicon Valley Bank and Signature Bank failed after actively borrowing from their respective FHLBanks.
First Republic Bank, another member, failed approximately seven weeks later.
As shown in Figure 11, these four entities increased their borrowings from their FHLBanks starting in late 2022.
This resembled a pattern observed in the lead-up to the 2008 crisis, during which the System saw increased borrowing by members in distress just before failure.
The FHLBank System did not incur losses on its advances to these failed members.
The broader financial system, however, incurred losses because of these failures, highlighting the need for greater focus by the FHLBanks on evaluating member creditworthiness and better coordination with their members’ primary regulators when a member’s financial condition is deteriorating.
Even more problematically, the report notes that during the March 2023 bank failures, the FHLBanks also discovered that some large, troubled members had not established the ability to borrow from the Federal Reserve discount window and therefore were overly reliant on the FHLBanks.
While the FHLBanks continue to serve as a source for reliable liquidity - which allows members, particularly smaller members, to continue to serve their communities - the Federal Reserve has long been considered the U.S. banking system’s lender of last resort.
...Nevertheless, during the March 2023 bank failures, the FHLBank System’s role of providing low-cost liquidity came under stress, due to sizable advance demand from large members, some of which were significantly bigger than the FHLBanks themselves.
The reliance of some large, troubled members on the FHLBanks, rather than the Federal Reserve, for liquidity during periods of significant financial stress may be inconsistent with the relative responsibilities of the FHLBanks and the Federal Reserve.
Among the major changes, the Federal Housing Finance Agency, which oversees FHLBs, will propose a rule to force many banks to hold 10% of their assets in mortgage loans to maintain access to the FHLBs.
The regulator is also exploring new guardrails for lending money to troubled institutions and tougher stress tests.
Bloomberg's Alex Harris highlights some of the possible issues:
-
Smaller fed funds market: FHLBs are the largest lender of cash in the market for federal funds. If banks borrow less, FHLBs may have less excess cash to lend
-
Jumpier monetary policy rate: Less volume in the fed funds market could make the fed funds rate -- the US monetary authority’s target benchmark -- more prone to movements within the range, prompting officials to tweak tools to maintain control
-
Less issuance: The FHLB Office of Finance issues agency discount notes to fund system-wide demand for short-term loans, or advances. Fewer advances means less market supply, which may push T-bill yields lower and motivate buyers of FHLB paper, such as money-market funds, to continue parking cash at the Fed’s reverse repo facility
-
Higher costs: If banks have to turn elsewhere for funding, such as to the commercial paper market, that may drive borrowing rates higher for institutions
-
More reserves: Losing a portion of low-cost funding could drive bank liquidity coverage ratios lower, at which point institutions could hold more reserves to fill the funding gap. That means the banking system’s lowest comfortable level of reserves could actually be much higher
Simply put, this regulatory overhaul will ripple through dollar funding markets - and potentially Fed policy - as smaller US banks are forced to pay up for their emergency cash at The Fed's discount window or the BTFP (which will offer the market much more transparency into just how bad the situation is).
And in case you really believed Bill Gross, just a day ago, the NYFed blog reported new models of banking system vulnerability.
The most important change in methodology is that the measures now incorporate unrealized losses (or gains) on all securities. The goal of this change is to reflect more closely the economic value of bank assets in a stress scenario.
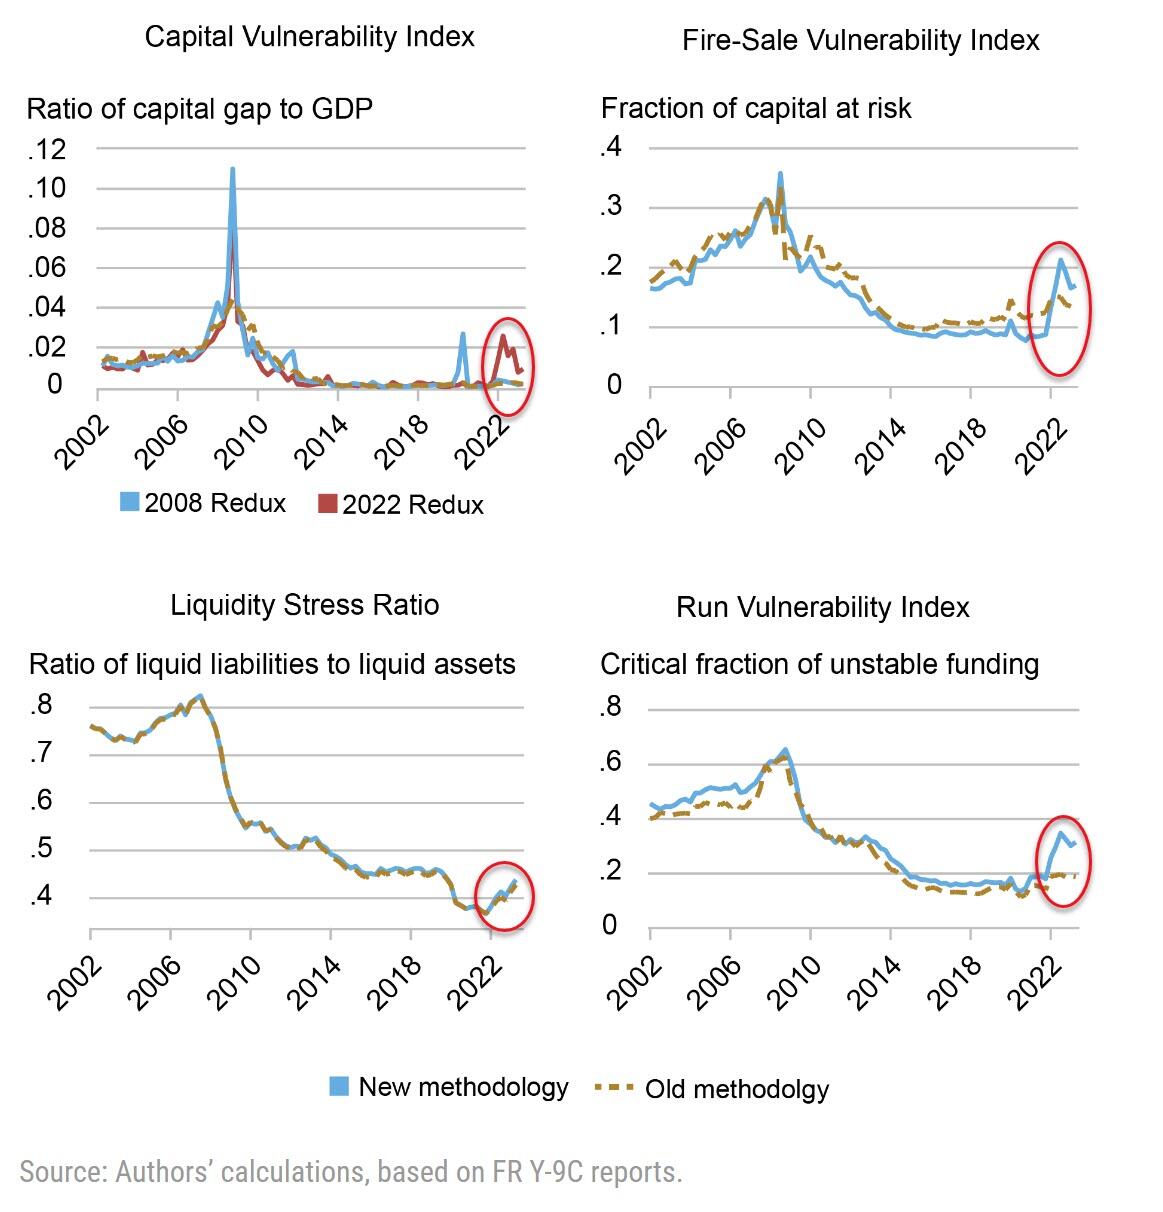
Their new measures, adapted to this recent shock, suggest a moderate increase in systemic vulnerability compared to the low levels of the previous ten years.
Uncategorized
February Employment Situation
By Paul Gomme and Peter Rupert The establishment data from the BLS showed a 275,000 increase in payroll employment for February, outpacing the 230,000…
Share this:


By Paul Gomme and Peter Rupert
The establishment data from the BLS showed a 275,000 increase in payroll employment for February, outpacing the 230,000 average over the previous 12 months. The payroll data for January and December were revised down by a total of 167,000. The private sector added 223,000 new jobs, the largest gain since May of last year.

Temporary help services employment continues a steep decline after a sharp post-pandemic rise.


Average hours of work increased from 34.2 to 34.3. The increase, along with the 223,000 private employment increase led to a hefty increase in total hours of 5.6% at an annualized rate, also the largest increase since May of last year.

The establishment report, once again, beat “expectations;” the WSJ survey of economists was 198,000. Other than the downward revisions, mentioned above, another bit of negative news was a smallish increase in wage growth, from $34.52 to $34.57.

The household survey shows that the labor force increased 150,000, a drop in employment of 184,000 and an increase in the number of unemployed persons of 334,000. The labor force participation rate held steady at 62.5, the employment to population ratio decreased from 60.2 to 60.1 and the unemployment rate increased from 3.66 to 3.86. Remember that the unemployment rate is the number of unemployed relative to the labor force (the number employed plus the number unemployed). Consequently, the unemployment rate can go up if the number of unemployed rises holding fixed the labor force, or if the labor force shrinks holding the number unemployed unchanged. An increase in the unemployment rate is not necessarily a bad thing: it may reflect a strong labor market drawing “marginally attached” individuals from outside the labor force. Indeed, there was a 96,000 decline in those workers.


Earlier in the week, the BLS announced JOLTS (Job Openings and Labor Turnover Survey) data for January. There isn’t much to report here as the job openings changed little at 8.9 million, the number of hires and total separations were little changed at 5.7 million and 5.3 million, respectively.

As has been the case for the last couple of years, the number of job openings remains higher than the number of unemployed persons.

Also earlier in the week the BLS announced that productivity increased 3.2% in the 4th quarter with output rising 3.5% and hours of work rising 0.3%.

The bottom line is that the labor market continues its surprisingly (to some) strong performance, once again proving stronger than many had expected. This strength makes it difficult to justify any interest rate cuts soon, particularly given the recent inflation spike.
unemployment pandemic unemploymentUncategorized
Mortgage rates fall as labor market normalizes
Jobless claims show an expanding economy. We will only be in a recession once jobless claims exceed 323,000 on a four-week moving average.
Share this:


Everyone was waiting to see if this week’s jobs report would send mortgage rates higher, which is what happened last month. Instead, the 10-year yield had a muted response after the headline number beat estimates, but we have negative job revisions from previous months. The Federal Reserve’s fear of wage growth spiraling out of control hasn’t materialized for over two years now and the unemployment rate ticked up to 3.9%. For now, we can say the labor market isn’t tight anymore, but it’s also not breaking.
The key labor data line in this expansion is the weekly jobless claims report. Jobless claims show an expanding economy that has not lost jobs yet. We will only be in a recession once jobless claims exceed 323,000 on a four-week moving average.
From the Fed: In the week ended March 2, initial claims for unemployment insurance benefits were flat, at 217,000. The four-week moving average declined slightly by 750, to 212,250
Below is an explanation of how we got here with the labor market, which all started during COVID-19.
1. I wrote the COVID-19 recovery model on April 7, 2020, and retired it on Dec. 9, 2020. By that time, the upfront recovery phase was done, and I needed to model out when we would get the jobs lost back.
2. Early in the labor market recovery, when we saw weaker job reports, I doubled and tripled down on my assertion that job openings would get to 10 million in this recovery. Job openings rose as high as to 12 million and are currently over 9 million. Even with the massive miss on a job report in May 2021, I didn’t waver.
Currently, the jobs openings, quit percentage and hires data are below pre-COVID-19 levels, which means the labor market isn’t as tight as it once was, and this is why the employment cost index has been slowing data to move along the quits percentage.

3. I wrote that we should get back all the jobs lost to COVID-19 by September of 2022. At the time this would be a speedy labor market recovery, and it happened on schedule, too
Total employment data
4. This is the key one for right now: If COVID-19 hadn’t happened, we would have between 157 million and 159 million jobs today, which would have been in line with the job growth rate in February 2020. Today, we are at 157,808,000. This is important because job growth should be cooling down now. We are more in line with where the labor market should be when averaging 140K-165K monthly. So for now, the fact that we aren’t trending between 140K-165K means we still have a bit more recovery kick left before we get down to those levels.

From BLS: Total nonfarm payroll employment rose by 275,000 in February, and the unemployment rate increased to 3.9 percent, the U.S. Bureau of Labor Statistics reported today. Job gains occurred in health care, in government, in food services and drinking places, in social assistance, and in transportation and warehousing.
Here are the jobs that were created and lost in the previous month:

In this jobs report, the unemployment rate for education levels looks like this:
- Less than a high school diploma: 6.1%
- High school graduate and no college: 4.2%
- Some college or associate degree: 3.1%
- Bachelor’s degree or higher: 2.2%

Today’s report has continued the trend of the labor data beating my expectations, only because I am looking for the jobs data to slow down to a level of 140K-165K, which hasn’t happened yet. I wouldn’t categorize the labor market as being tight anymore because of the quits ratio and the hires data in the job openings report. This also shows itself in the employment cost index as well. These are key data lines for the Fed and the reason we are going to see three rate cuts this year.
recession unemployment covid-19 fed federal reserve mortgage rates recession recovery unemploymentUncategorized
Inside The Most Ridiculous Jobs Report In History: Record 1.2 Million Immigrant Jobs Added In One Month
Inside The Most Ridiculous Jobs Report In History: Record 1.2 Million Immigrant Jobs Added In One Month
Last month we though that the January…
Share this:


Last month we though that the January jobs report was the "most ridiculous in recent history" but, boy, were we wrong because this morning the Biden department of goalseeked propaganda (aka BLS) published the February jobs report, and holy crap was that something else. Even Goebbels would blush.
What happened? Let's take a closer look.
On the surface, it was (almost) another blockbuster jobs report, certainly one which nobody expected, or rather just one bank out of 76 expected. Starting at the top, the BLS reported that in February the US unexpectedly added 275K jobs, with just one research analyst (from Dai-Ichi Research) expecting a higher number.
Some context: after last month's record 4-sigma beat, today's print was "only" 3 sigma higher than estimates. Needless to say, two multiple sigma beats in a row used to only happen in the USSR... and now in the US, apparently.

Before we go any further, a quick note on what last month we said was "the most ridiculous jobs report in recent history": it appears the BLS read our comments and decided to stop beclowing itself. It did that by slashing last month's ridiculous print by over a third, and revising what was originally reported as a massive 353K beat to just 229K, a 124K revision, which was the biggest one-month negative revision in two years!

Of course, that does not mean that this month's jobs print won't be revised lower: it will be, and not just that month but every other month until the November election because that's the only tool left in the Biden admin's box: pretend the economic and jobs are strong, then revise them sharply lower the next month, something we pointed out first last summer and which has not failed to disappoint once.
In the past month the Biden department of goalseeking stuff higher before revising it lower, has revised the following data sharply lower:
— zerohedge (@zerohedge) August 30, 2023
- Jobs
- JOLTS
- New Home sales
- Housing Starts and Permits
- Industrial Production
- PCE and core PCE
To be fair, not every aspect of the jobs report was stellar (after all, the BLS had to give it some vague credibility). Take the unemployment rate, after flatlining between 3.4% and 3.8% for two years - and thus denying expectations from Sahm's Rule that a recession may have already started - in February the unemployment rate unexpectedly jumped to 3.9%, the highest since February 2022 (with Black unemployment spiking by 0.3% to 5.6%, an indicator which the Biden admin will quickly slam as widespread economic racism or something).

And then there were average hourly earnings, which after surging 0.6% MoM in January (since revised to 0.5%) and spooking markets that wage growth is so hot, the Fed will have no choice but to delay cuts, in February the number tumbled to just 0.1%, the lowest in two years...

... for one simple reason: last month's average wage surge had nothing to do with actual wages, and everything to do with the BLS estimate of hours worked (which is the denominator in the average wage calculation) which last month tumbled to just 34.1 (we were led to believe) the lowest since the covid pandemic...

... but has since been revised higher while the February print rose even more, to 34.3, hence why the latest average wage data was once again a product not of wages going up, but of how long Americans worked in any weekly period, in this case higher from 34.1 to 34.3, an increase which has a major impact on the average calculation.

While the above data points were examples of some latent weakness in the latest report, perhaps meant to give it a sheen of veracity, it was everything else in the report that was a problem starting with the BLS's latest choice of seasonal adjustments (after last month's wholesale revision), which have gone from merely laughable to full clownshow, as the following comparison between the monthly change in BLS and ADP payrolls shows. The trend is clear: the Biden admin numbers are now clearly rising even as the impartial ADP (which directly logs employment numbers at the company level and is far more accurate), shows an accelerating slowdown.

But it's more than just the Biden admin hanging its "success" on seasonal adjustments: when one digs deeper inside the jobs report, all sorts of ugly things emerge... such as the growing unprecedented divergence between the Establishment (payrolls) survey and much more accurate Household (actual employment) survey. To wit, while in January the BLS claims 275K payrolls were added, the Household survey found that the number of actually employed workers dropped for the third straight month (and 4 in the past 5), this time by 184K (from 161.152K to 160.968K).

This means that while the Payrolls series hits new all time highs every month since December 2020 (when according to the BLS the US had its last month of payrolls losses), the level of Employment has not budged in the past year. Worse, as shown in the chart below, such a gaping divergence has opened between the two series in the past 4 years, that the number of Employed workers would need to soar by 9 million (!) to catch up to what Payrolls claims is the employment situation.

There's more: shifting from a quantitative to a qualitative assessment, reveals just how ugly the composition of "new jobs" has been. Consider this: the BLS reports that in February 2024, the US had 132.9 million full-time jobs and 27.9 million part-time jobs. Well, that's great... until you look back one year and find that in February 2023 the US had 133.2 million full-time jobs, or more than it does one year later! And yes, all the job growth since then has been in part-time jobs, which have increased by 921K since February 2023 (from 27.020 million to 27.941 million).

Here is a summary of the labor composition in the past year: all the new jobs have been part-time jobs!

But wait there's even more, because now that the primary season is over and we enter the heart of election season and political talking points will be thrown around left and right, especially in the context of the immigration crisis created intentionally by the Biden administration which is hoping to import millions of new Democratic voters (maybe the US can hold the presidential election in Honduras or Guatemala, after all it is their citizens that will be illegally casting the key votes in November), what we find is that in February, the number of native-born workers tumbled again, sliding by a massive 560K to just 129.807 million. Add to this the December data, and we get a near-record 2.4 million plunge in native-born workers in just the past 3 months (only the covid crash was worse)!

The offset? A record 1.2 million foreign-born (read immigrants, both legal and illegal but mostly illegal) workers added in February!

Said otherwise, not only has all job creation in the past 6 years has been exclusively for foreign-born workers...

... but there has been zero job-creation for native born workers since June 2018!

This is a huge issue - especially at a time of an illegal alien flood at the southwest border...

... and is about to become a huge political scandal, because once the inevitable recession finally hits, there will be millions of furious unemployed Americans demanding a more accurate explanation for what happened - i.e., the illegal immigration floodgates that were opened by the Biden admin.
Which is also why Biden's handlers will do everything in their power to insure there is no official recession before November... and why after the election is over, all economic hell will finally break loose. Until then, however, expect the jobs numbers to get even more ridiculous.


Wendy’s has a new deal for daylight savings time haters


Mortgage rates fall as labor market normalizes


Racial and Ethnic Wealth Inequality in the Post‑Pandemic Era


Wealth Inequality by Age in the Post‑Pandemic Era


February Employment Situation


Shipping company files surprise Chapter 7 bankruptcy, liquidation


Stock indexes are breaking records and crossing milestones – making many investors feel wealthier
Wendy’s teases new $3 offer for upcoming holiday


Economic Earthquake Ahead? The Cracks Are Spreading Fast


S&P Index Set To Hit 5000 As Bull Run Continues
-

 Uncategorized2 weeks ago
All Of The Elements Are In Place For An Economic Crisis Of Staggering Proportions
-

 Uncategorized1 month ago
Cathie Wood sells a major tech stock (again)
-

 Uncategorized3 weeks ago
California Counties Could Be Forced To Pay $300 Million To Cover COVID-Era Program
-

 Uncategorized2 weeks ago
Apparel Retailer Express Moving Toward Bankruptcy
-

 Uncategorized3 weeks ago
Industrial Production Decreased 0.1% in January
-

 International2 days ago
Walmart launches clever answer to Target’s new membership program
-

 International2 days ago
EyePoint poaches medical chief from Apellis; Sandoz CFO, longtime BioNTech exec to retire
-

 Uncategorized3 weeks ago
RFK Jr: The Wuhan Cover-Up & The Rise Of The Biowarfare-Industrial Complex