Uncategorized
“Recession Fatigue” Looms As Consumers Begin To Break
"Recession Fatigue" Looms As Consumers Begin To Break
Authored by Lance Roberts via RealInvestmentAdvice.com,
“Recession Fatigue” is…
Share this:


Authored by Lance Roberts via RealInvestmentAdvice.com,
“Recession Fatigue” is setting in as consumers struggle under rising interest rates, high inflation, and a declining stock market. Such was a point made in a recent CNBC article:
“As the Federal Reserve aggressively raises rates to combat persistent inflation, the tough stance could come at a price. Already, falling stock markets have wiped out more than $9 trillion in wealth from U.S. households.
Fed Chairman Jerome Powell also warned the central bank’s upcoming moves to fight soaring prices may cause “some pain” ahead.
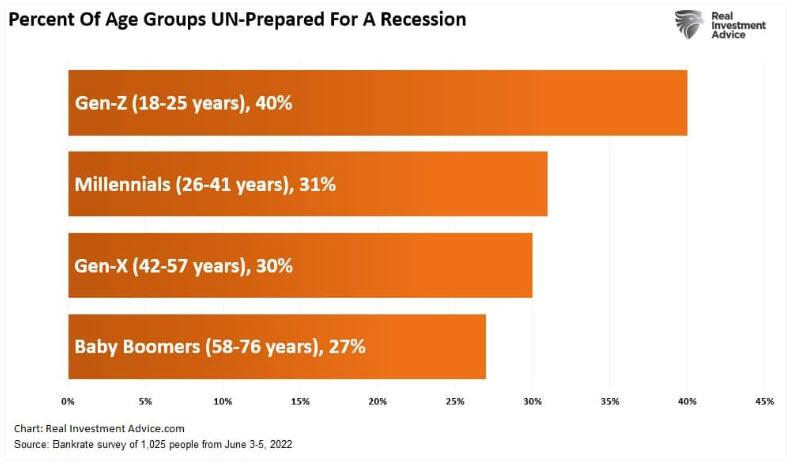
And yet, 31% of Americans said they are not equipped for an economic downturn and are not actively doing anything to better prepare for one, according to a recent Bankrate.com report.”
Interestingly, while individuals continue to suffer from “Recession Fatigue,” the economy is technically not in a recession. At least not yet, as the National Bureau of Economic Research (NBER), the official arbiter of recession dating, has not made that assessment. With unemployment rates at record lows, jobless claims at historically low levels, and consumer spending still above trend, an official recession likely has not yet begun.
However, don’t ask the average American that question. According to that Bankrate.com report, the average American has an entirely different view.
“Recession depression, recession fatigue, whatever you want to call it, the hits to Americans’ financial security keep coming. First, it was the devastating coronavirus pandemic, followed by 40-year-high inflation, and now the growing risk of another downturn. Sustaining motivation for two-plus years to prepare for tough economic times can no doubt feel exhausting.” – Bankrate.com analyst Sarah Foster.
When broken down by generation, younger adults, or Gen Zers, are more likely to experience “recession fatigue” than millennials, Gen Xers, and baby boomers. In the report, “recession fatigue” is primarily afflicting younger generations, leaving them unprepared to face a recession. Such data certainly flies in the face of media reports of households having “strong financial balance sheets.”
As we have discussed, households remain woefully short on savings despite a booming stock market over the last 12 years and $5 trillion in fiscal stimulus.

If “recession fatigue” is a problem now, it will worsen when unemployment increases.
The Great Termination
In 2020-2021, as the Government sent checks directly to households and companies forced older workers into early retirement, it became known as the “Great Resignation.” Naturally, that all worked well until inflation surged to the highest level in forty years, and all those that opted for “retirement” began looking for work to make ends meet.
Now, as the economy begins to slow, and individuals are already struggling with “recession fatigue” just trying to pay bills, the “Great Termination” is coming. Such is evident from a recent KPMG survey of C-Suite executives ringing alarm bells of a looming recession.
“Nine in ten CEOs in the U.S. (91%) believe a recession will arrive in the coming 12 months, while 86% of CEOs globally feel the same way, according to the international audit, tax, and advisory firm findings.
In America, half of the CEOs (51%) say they’re considering workforce reductions during the next six months — and in the global survey overall, eight in ten CEOs say the same.
It is “likely” and/or “extremely likely” that remote workers will be laid off first, according to a majority (60%) of 3,000 managers polled by beautiful.ai, a presentation software provider. Another 20% were undecided, and the remaining 20% said it wasn’t likely.” –MarketWatch
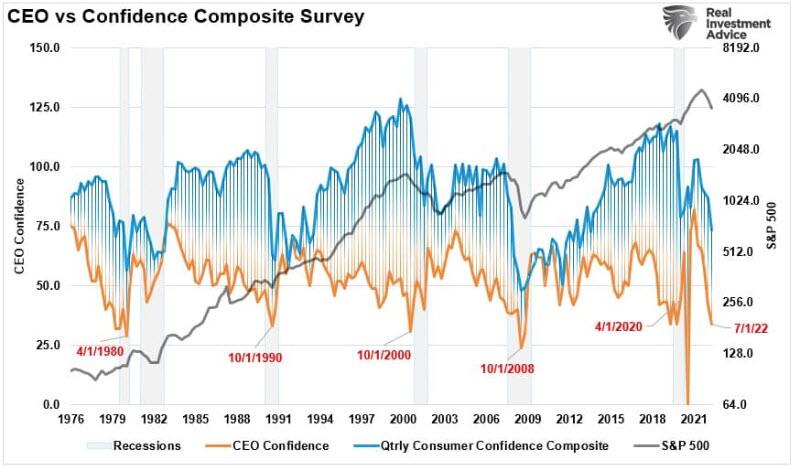
That sentiment is not surprising, given the symbiotic relationship between consumers and corporations. As shown, there is a high correlation between consumer sentiment and CEO confidence. Corporate revenues get derived from consumer demand. Therefore, when consumers contract spending due to “recession fatigue,” corporations take defensive actions to protect profitability.
Notably, given that “good employees” are hard to find, expensive to train, and challenging to replace, companies tend to be “slow to hire and slow to fire.” As such, they start with essential cost-cutting and then proceed to cuts in capital expenditures (CapEx.) According to the NFIB survey data, the current level of CapEx spending is associated with previous recessions.

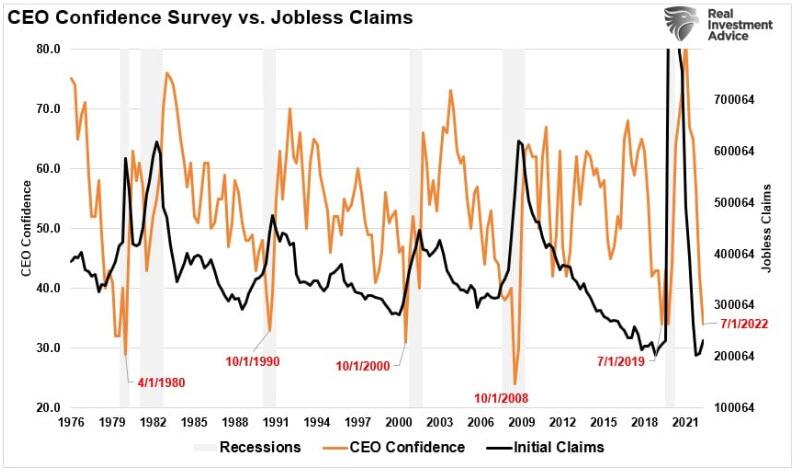
Once corporations reach the limits of cost-cutting, terminations eventually follow. As shown, CEO confidence at such low levels coincided with low jobless claims. Notably, jobless claims do not trend higher; they spike as terminations come rapidly.
An old axiom states, “a recession is when your neighbor loses their job, it’s a depression when you lose yours.”
“Recession Fatigue” Not To End Soon
Numerous articles suggest the economy remains healthy due to the “fiscal health of household balance sheets.” To wit:
“Besides a booming labor market, exceptionally strong household balance sheets help keep spending high. Households’ net worth is far higher than pre-Covid for every single income quintile, providing some buffer to the headwinds of inflation and dour consumer sentiment.” – Harvard Business Review
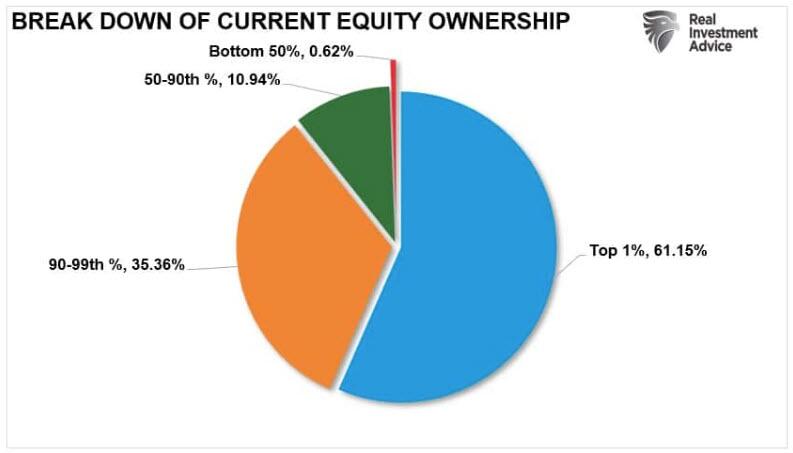
While that is a true statement, the reality is far more insidious. Most of those savings are held by the top 10% of income earners. Those are the same individuals that own about 90% of the household stock market wealth.
It is a far different picture for the bottom 90% of Americans. Those households have few choices but to tap credit cards to fill the gap between living costs and incomes.
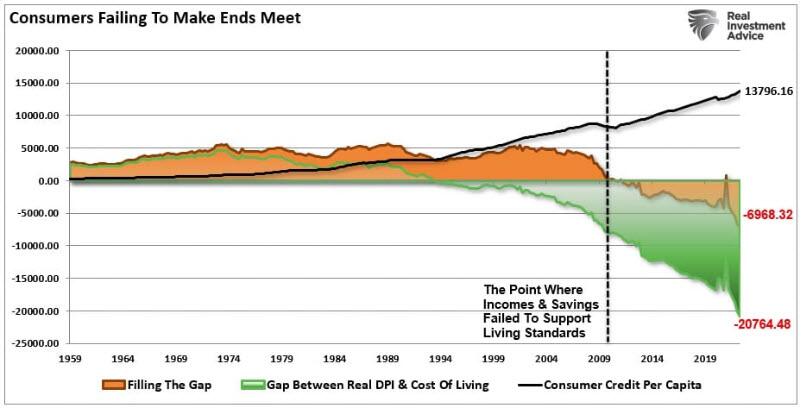
According to the latest New York Federal Reserve report, credit card debt surged by $46 billion in the second quarter. As shown above, such is not surprising as consumers struggled to maintain their standard of living. The 13% annualized increase in new debt was the largest in more than 20 years. Moreover, aggregate limits on cards marked their most significant increase in the last decade.

With the pandemic-driven savings now spent, 60% of Americans say they are living paycheck-to-paycheck. While consumers can supplement their disposable incomes with debt to offset rising inflationary pressures, it is not a long-term solution. Unfortunately, when unemployment arrives, that will no longer be an option. The data suggests the U.S. economy is on the verge of a much deeper bout of “recession fatigue” as consumption grinds to a halt.
One thing is sure. When the economy breaks, inflation will no longer be a problem. What will be problematic is the Federal Reserve scrambling to fix what they have once again broken.
Uncategorized
February Employment Situation
By Paul Gomme and Peter Rupert The establishment data from the BLS showed a 275,000 increase in payroll employment for February, outpacing the 230,000…
Share this:


By Paul Gomme and Peter Rupert
The establishment data from the BLS showed a 275,000 increase in payroll employment for February, outpacing the 230,000 average over the previous 12 months. The payroll data for January and December were revised down by a total of 167,000. The private sector added 223,000 new jobs, the largest gain since May of last year.

Temporary help services employment continues a steep decline after a sharp post-pandemic rise.


Average hours of work increased from 34.2 to 34.3. The increase, along with the 223,000 private employment increase led to a hefty increase in total hours of 5.6% at an annualized rate, also the largest increase since May of last year.

The establishment report, once again, beat “expectations;” the WSJ survey of economists was 198,000. Other than the downward revisions, mentioned above, another bit of negative news was a smallish increase in wage growth, from $34.52 to $34.57.

The household survey shows that the labor force increased 150,000, a drop in employment of 184,000 and an increase in the number of unemployed persons of 334,000. The labor force participation rate held steady at 62.5, the employment to population ratio decreased from 60.2 to 60.1 and the unemployment rate increased from 3.66 to 3.86. Remember that the unemployment rate is the number of unemployed relative to the labor force (the number employed plus the number unemployed). Consequently, the unemployment rate can go up if the number of unemployed rises holding fixed the labor force, or if the labor force shrinks holding the number unemployed unchanged. An increase in the unemployment rate is not necessarily a bad thing: it may reflect a strong labor market drawing “marginally attached” individuals from outside the labor force. Indeed, there was a 96,000 decline in those workers.


Earlier in the week, the BLS announced JOLTS (Job Openings and Labor Turnover Survey) data for January. There isn’t much to report here as the job openings changed little at 8.9 million, the number of hires and total separations were little changed at 5.7 million and 5.3 million, respectively.

As has been the case for the last couple of years, the number of job openings remains higher than the number of unemployed persons.

Also earlier in the week the BLS announced that productivity increased 3.2% in the 4th quarter with output rising 3.5% and hours of work rising 0.3%.

The bottom line is that the labor market continues its surprisingly (to some) strong performance, once again proving stronger than many had expected. This strength makes it difficult to justify any interest rate cuts soon, particularly given the recent inflation spike.
unemployment pandemic unemploymentUncategorized
Mortgage rates fall as labor market normalizes
Jobless claims show an expanding economy. We will only be in a recession once jobless claims exceed 323,000 on a four-week moving average.
Share this:


Everyone was waiting to see if this week’s jobs report would send mortgage rates higher, which is what happened last month. Instead, the 10-year yield had a muted response after the headline number beat estimates, but we have negative job revisions from previous months. The Federal Reserve’s fear of wage growth spiraling out of control hasn’t materialized for over two years now and the unemployment rate ticked up to 3.9%. For now, we can say the labor market isn’t tight anymore, but it’s also not breaking.
The key labor data line in this expansion is the weekly jobless claims report. Jobless claims show an expanding economy that has not lost jobs yet. We will only be in a recession once jobless claims exceed 323,000 on a four-week moving average.
From the Fed: In the week ended March 2, initial claims for unemployment insurance benefits were flat, at 217,000. The four-week moving average declined slightly by 750, to 212,250
Below is an explanation of how we got here with the labor market, which all started during COVID-19.
1. I wrote the COVID-19 recovery model on April 7, 2020, and retired it on Dec. 9, 2020. By that time, the upfront recovery phase was done, and I needed to model out when we would get the jobs lost back.
2. Early in the labor market recovery, when we saw weaker job reports, I doubled and tripled down on my assertion that job openings would get to 10 million in this recovery. Job openings rose as high as to 12 million and are currently over 9 million. Even with the massive miss on a job report in May 2021, I didn’t waver.
Currently, the jobs openings, quit percentage and hires data are below pre-COVID-19 levels, which means the labor market isn’t as tight as it once was, and this is why the employment cost index has been slowing data to move along the quits percentage.

3. I wrote that we should get back all the jobs lost to COVID-19 by September of 2022. At the time this would be a speedy labor market recovery, and it happened on schedule, too
Total employment data
4. This is the key one for right now: If COVID-19 hadn’t happened, we would have between 157 million and 159 million jobs today, which would have been in line with the job growth rate in February 2020. Today, we are at 157,808,000. This is important because job growth should be cooling down now. We are more in line with where the labor market should be when averaging 140K-165K monthly. So for now, the fact that we aren’t trending between 140K-165K means we still have a bit more recovery kick left before we get down to those levels.

From BLS: Total nonfarm payroll employment rose by 275,000 in February, and the unemployment rate increased to 3.9 percent, the U.S. Bureau of Labor Statistics reported today. Job gains occurred in health care, in government, in food services and drinking places, in social assistance, and in transportation and warehousing.
Here are the jobs that were created and lost in the previous month:

In this jobs report, the unemployment rate for education levels looks like this:
- Less than a high school diploma: 6.1%
- High school graduate and no college: 4.2%
- Some college or associate degree: 3.1%
- Bachelor’s degree or higher: 2.2%

Today’s report has continued the trend of the labor data beating my expectations, only because I am looking for the jobs data to slow down to a level of 140K-165K, which hasn’t happened yet. I wouldn’t categorize the labor market as being tight anymore because of the quits ratio and the hires data in the job openings report. This also shows itself in the employment cost index as well. These are key data lines for the Fed and the reason we are going to see three rate cuts this year.
recession unemployment covid-19 fed federal reserve mortgage rates recession recovery unemploymentUncategorized
Inside The Most Ridiculous Jobs Report In History: Record 1.2 Million Immigrant Jobs Added In One Month
Inside The Most Ridiculous Jobs Report In History: Record 1.2 Million Immigrant Jobs Added In One Month
Last month we though that the January…
Share this:


Last month we though that the January jobs report was the "most ridiculous in recent history" but, boy, were we wrong because this morning the Biden department of goalseeked propaganda (aka BLS) published the February jobs report, and holy crap was that something else. Even Goebbels would blush.
What happened? Let's take a closer look.
On the surface, it was (almost) another blockbuster jobs report, certainly one which nobody expected, or rather just one bank out of 76 expected. Starting at the top, the BLS reported that in February the US unexpectedly added 275K jobs, with just one research analyst (from Dai-Ichi Research) expecting a higher number.
Some context: after last month's record 4-sigma beat, today's print was "only" 3 sigma higher than estimates. Needless to say, two multiple sigma beats in a row used to only happen in the USSR... and now in the US, apparently.

Before we go any further, a quick note on what last month we said was "the most ridiculous jobs report in recent history": it appears the BLS read our comments and decided to stop beclowing itself. It did that by slashing last month's ridiculous print by over a third, and revising what was originally reported as a massive 353K beat to just 229K, a 124K revision, which was the biggest one-month negative revision in two years!

Of course, that does not mean that this month's jobs print won't be revised lower: it will be, and not just that month but every other month until the November election because that's the only tool left in the Biden admin's box: pretend the economic and jobs are strong, then revise them sharply lower the next month, something we pointed out first last summer and which has not failed to disappoint once.
In the past month the Biden department of goalseeking stuff higher before revising it lower, has revised the following data sharply lower:
— zerohedge (@zerohedge) August 30, 2023
- Jobs
- JOLTS
- New Home sales
- Housing Starts and Permits
- Industrial Production
- PCE and core PCE
To be fair, not every aspect of the jobs report was stellar (after all, the BLS had to give it some vague credibility). Take the unemployment rate, after flatlining between 3.4% and 3.8% for two years - and thus denying expectations from Sahm's Rule that a recession may have already started - in February the unemployment rate unexpectedly jumped to 3.9%, the highest since February 2022 (with Black unemployment spiking by 0.3% to 5.6%, an indicator which the Biden admin will quickly slam as widespread economic racism or something).

And then there were average hourly earnings, which after surging 0.6% MoM in January (since revised to 0.5%) and spooking markets that wage growth is so hot, the Fed will have no choice but to delay cuts, in February the number tumbled to just 0.1%, the lowest in two years...

... for one simple reason: last month's average wage surge had nothing to do with actual wages, and everything to do with the BLS estimate of hours worked (which is the denominator in the average wage calculation) which last month tumbled to just 34.1 (we were led to believe) the lowest since the covid pandemic...

... but has since been revised higher while the February print rose even more, to 34.3, hence why the latest average wage data was once again a product not of wages going up, but of how long Americans worked in any weekly period, in this case higher from 34.1 to 34.3, an increase which has a major impact on the average calculation.

While the above data points were examples of some latent weakness in the latest report, perhaps meant to give it a sheen of veracity, it was everything else in the report that was a problem starting with the BLS's latest choice of seasonal adjustments (after last month's wholesale revision), which have gone from merely laughable to full clownshow, as the following comparison between the monthly change in BLS and ADP payrolls shows. The trend is clear: the Biden admin numbers are now clearly rising even as the impartial ADP (which directly logs employment numbers at the company level and is far more accurate), shows an accelerating slowdown.

But it's more than just the Biden admin hanging its "success" on seasonal adjustments: when one digs deeper inside the jobs report, all sorts of ugly things emerge... such as the growing unprecedented divergence between the Establishment (payrolls) survey and much more accurate Household (actual employment) survey. To wit, while in January the BLS claims 275K payrolls were added, the Household survey found that the number of actually employed workers dropped for the third straight month (and 4 in the past 5), this time by 184K (from 161.152K to 160.968K).

This means that while the Payrolls series hits new all time highs every month since December 2020 (when according to the BLS the US had its last month of payrolls losses), the level of Employment has not budged in the past year. Worse, as shown in the chart below, such a gaping divergence has opened between the two series in the past 4 years, that the number of Employed workers would need to soar by 9 million (!) to catch up to what Payrolls claims is the employment situation.

There's more: shifting from a quantitative to a qualitative assessment, reveals just how ugly the composition of "new jobs" has been. Consider this: the BLS reports that in February 2024, the US had 132.9 million full-time jobs and 27.9 million part-time jobs. Well, that's great... until you look back one year and find that in February 2023 the US had 133.2 million full-time jobs, or more than it does one year later! And yes, all the job growth since then has been in part-time jobs, which have increased by 921K since February 2023 (from 27.020 million to 27.941 million).

Here is a summary of the labor composition in the past year: all the new jobs have been part-time jobs!

But wait there's even more, because now that the primary season is over and we enter the heart of election season and political talking points will be thrown around left and right, especially in the context of the immigration crisis created intentionally by the Biden administration which is hoping to import millions of new Democratic voters (maybe the US can hold the presidential election in Honduras or Guatemala, after all it is their citizens that will be illegally casting the key votes in November), what we find is that in February, the number of native-born workers tumbled again, sliding by a massive 560K to just 129.807 million. Add to this the December data, and we get a near-record 2.4 million plunge in native-born workers in just the past 3 months (only the covid crash was worse)!

The offset? A record 1.2 million foreign-born (read immigrants, both legal and illegal but mostly illegal) workers added in February!

Said otherwise, not only has all job creation in the past 6 years has been exclusively for foreign-born workers...

... but there has been zero job-creation for native born workers since June 2018!

This is a huge issue - especially at a time of an illegal alien flood at the southwest border...

... and is about to become a huge political scandal, because once the inevitable recession finally hits, there will be millions of furious unemployed Americans demanding a more accurate explanation for what happened - i.e., the illegal immigration floodgates that were opened by the Biden admin.
Which is also why Biden's handlers will do everything in their power to insure there is no official recession before November... and why after the election is over, all economic hell will finally break loose. Until then, however, expect the jobs numbers to get even more ridiculous.


Wendy’s has a new deal for daylight savings time haters


Mortgage rates fall as labor market normalizes


Racial and Ethnic Wealth Inequality in the Post‑Pandemic Era


Wealth Inequality by Age in the Post‑Pandemic Era


Shipping company files surprise Chapter 7 bankruptcy, liquidation


Interest rates, the best it gets. It’s time to deploy cash


Is the biotech market rally real? Data suggest comeback in private, public markets


February Employment Situation
Wendy’s teases new $3 offer for upcoming holiday


Economic Earthquake Ahead? The Cracks Are Spreading Fast
-

 Uncategorized2 weeks ago
All Of The Elements Are In Place For An Economic Crisis Of Staggering Proportions
-

 Uncategorized1 month ago
Cathie Wood sells a major tech stock (again)
-

 Uncategorized3 weeks ago
California Counties Could Be Forced To Pay $300 Million To Cover COVID-Era Program
-

 Uncategorized2 weeks ago
Apparel Retailer Express Moving Toward Bankruptcy
-

 Uncategorized3 weeks ago
Industrial Production Decreased 0.1% in January
-

 International2 days ago
Walmart launches clever answer to Target’s new membership program
-

 International2 days ago
EyePoint poaches medical chief from Apellis; Sandoz CFO, longtime BioNTech exec to retire
-

 Uncategorized3 weeks ago
RFK Jr: The Wuhan Cover-Up & The Rise Of The Biowarfare-Industrial Complex