Government
Payrolls Preview: The Last Report Before The Election
Payrolls Preview: The Last Report Before The Election
Share this:

While few expect major surprises from tomorrow's payrolls report, the fact that it will be the last jobs report before the Nov 3 election makes it especially important if only from a political standpoint: a blowout number will be hyped aggressively by Trump; the opposite will fall right into Biden's hands as evidence the economy is cooling rapidly.

That said, the odds may be in Trump's favor because as Goldman writes in its payrolls preview, high-frequency labor market information "indicates strong September job gains, and the second derivative improvement in the public-health situation suggests scope for a pickup in Sun Belt job growth." On the negative side, there has been a spike in recent mass layoff announcements, while the start of the school year will lower education payrolls by 200-300k, as many janitors and support staff did not return to work. Goldman also expects a roughly 50k drag to government payrolls from the wind-down of the 2020 Census.
That said, here are the consensus expectations ahead of tomorrow's number which will be released at 830am:
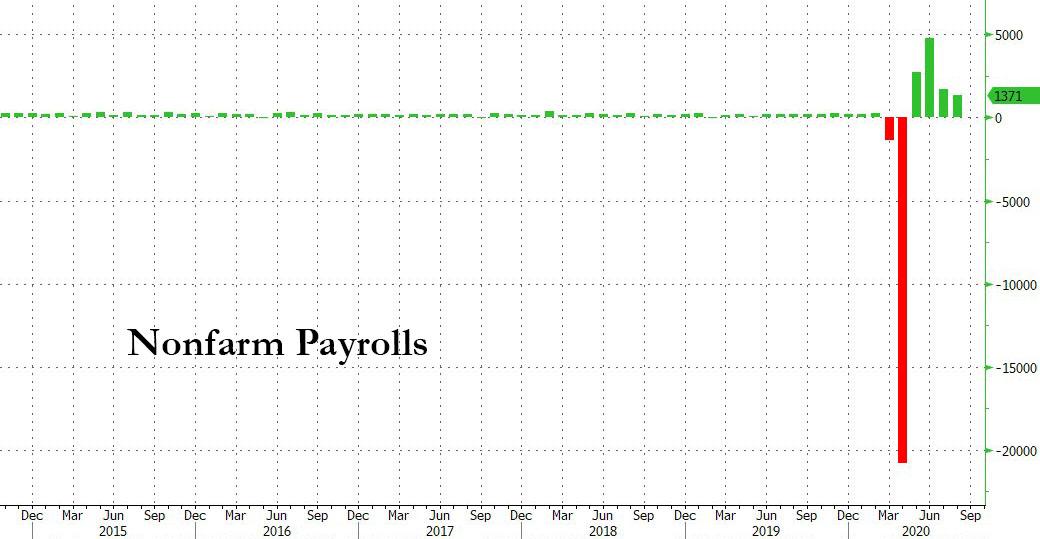
- Nonfarm Payrolls exp. 850k (range -100k to +1.800mln, prev. +1.371mln);
- Unemployment rate exp. 8.2% (range: 7.6-8.6%, prev. 8.4%);
- U6 unemployment (prev. 14.2%);
- Participation (prev. 61.7%);
- Private payrolls exp. 850k (prev. 1.027mln);
- Manufacturing payrolls exp. 35k (prev. 29k);
- Government payrolls (prev. 344k);
- Average earnings m/m exp. +0.2% (prev. +0.4%);
- Average earnings y/y exp. +4.8% (prev. +4.7%);
- Average workweek hours exp. 34.6hrs (prev. 34.6hrs).
Here are some big picture observations ahead of tomorrow's payrolls courtesy of NewsSquawk:
- The rate of Initial Jobless Claims rose in the September survey week against expectations it would fall, while Continuing Claims fell less than hoped.
- ADP’s payrolls gauge was more encouraging, rising more than expected, although it remains to be seen if it will correlate to the BLS following recent divergences.
- The Manufacturing ISM came in slightly cooler than expected as the pace of the rebound begins to plateau, which was somewhat at odds with the strong regional prints; the employment sub-component rose but it still remains beneath the 50 mark.
- Challenger Job Cuts were little changed from the August print, although have come down considerately since the record print in April.
- There has been a slew of large job cuts announced this week but those will most likely be a matter for October’s report, somewhat balanced out by the pick-up in seasonal hiring.
And some more in-depth observations:
INITIAL JOBLESS CLAIMS: Weekly Initial Jobless Claims rose to 870k from the upwardly revised 866k level in the September employment survey reference week, against expectations for a decline to 850k. Continuing Claims fell to 12.580mln from the pwardly revised 12.747mln. Pantheon Macroeconomics notes that the Initial Claims print has been flat lining now over the past four weeks following a one-time drop of 127k in the final week of August due to a change in the seasonal adjustment methodology, “Using the old seasonals, it looks as though the trend in claims has been unchanged since mid-August.” The consultancy affirms the labour market plateau against the daily small business employment data produced by Homebase, “pointing to flat payrolls in the sector in August and, more recently, a small outright decline.” The consumer-heavy US economy will struggle to continue recovering amid the roll-off of enhanced unemployment benefits, to which Pantheon doesn’t see the implementation of a “meaningful” relief bill until February given the divide in Congress; a pick-up of COVID cases only serves to cut output further. The consultancy warns, “Next week’s September payroll data likely will report a modest seasonally adjusted increase in private jobs, perhaps 500K or so, half the August gain, and October could easily see private payrolls fall.”
ADP: The September ADP report was encouraging as it continued to rise, the headline for private sector employment growth came in at 749k, topping the 650k estimate; the previous was also revised higher to 481k from 428k. The report bodes well for Friday’s BLS report. Although the relationship between the BLS and ADP release has been questionable in recent months, Pantheon highlights that ADP has substantially understated the official figures since the pandemic hit, but the error is much smaller since spring. “We can’t be sure it will narrow again in September, but that seems to be a reasonable assumption”, Pantheon posits. The consultancy looks for 950k in Friday’s September jobs report, adding the homebase employment data points to significantly weaker payrolls in October, and perhaps even the first decline since April.
MANUFACTURING SECTOR: The September ISM fell to 55.4 from 56.0, below the expected rise to 56.4. When comparing to the strong regional Fed surveys, the decline came in as somewhat of a surprise. Weighing the most was the fall in New Orders, which fell from the bumper 67.6 figure to 60.2, still a firm reading. The production component also fell to 61.0 from 63.3. Dampening the fall was the pick-up in the lagging indicators: Delivery Times, Inventories and Employment. The latter rose to 49.6 from 46.4, potentially boding well for the NFP print, although, noticeable, that figure still has not reclaimed the 50 figure. It’s also worth noting that we do not yet have the ISM Services survey to gauge the respective employment component; that is somewhat unhelpful given the US economy is predominantly services-led.
JOB CUTS: Challenger reported 118,804 job cuts in September, which was little changed from August’s 115,762, but was up 185.9% vs September 2019. However, the figure has come down significantly from April’s record 671,129, and note that prior to COVID, the highest reading was 186,350 in February 2009, although this month’s reading still sits heavily above the c. 50k average reading seen in “normal times” during the last decade. Challenger says, “We are setting new records for job cuts even though things have improved since the earliest days of the pandemic.” The report showed the heavily hit sectors such as entertainment and leisure continuing to lead in announced cuts, although there were several sectors outside those industries with large cuts such as Aerospace & Defense, as well as transportation, “We are beginning to see cuts spread to sectors outside Entertainment and Retail. Especially if another relief package fails to pass, employers are going to enter the fourth quarter hesitant to invest or spend.” The silver lining to the release was the pick up in hiring intentions to 929,860, compared to August’s 160,411, however, do note that at least a third of that is related to seasonal hiring and that hiring is heavily skewed to retailers with a strong online presence, with traditional brick and mortar retailers remaining under immense pressure
Finally, some qualitative considerations from Goldman: factors arguing for a better than expected report:
Arguing for a better-than-expected report:
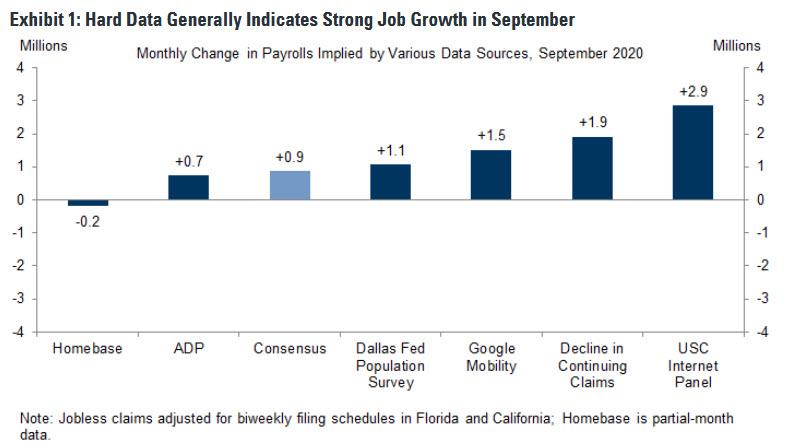
- Big Data. High frequency data on the labor market were generally strong in September (see Exhibit 1), with five of the six measures we track indicating significant job gains and four of the six consistent with a beat tomorrow of 500k or more. Additionally, the restarted Census Household Pulse survey is consistent with a 16mn decline in the level of unemployment from mid-May to mid-September (vs. -7.4mn in the official measure from mid-May to mid-August).

- Jobless claims. While still elevated, initial jobless claims declined significantly during the September payroll month (averaging 0.9mn per week vs. 1.2mn in August). Additionally, continuing claims declined by 1.9mn from survey week to survey week (after adjusting for biweekly filing schedules in Florida and California).
- Employer surveys. Business activity surveys improved on net in September, as did the employment components of our survey trackers (non-manufacturing +2.8pt to 49.1; manufacturing +2.4pt to 53.8).
- Job availability. The Conference Board labor differential—the difference between the percent of respondents saying jobs are plentiful and those saying jobs are hard to get—rose into expansionary territory (+2.9 in September from -2.2 in August and +2.2 in July).
- ADP. Private sector employment in the ADP report rose by 749k in September, somewhat above consensus. We viewed the ADP report as incrementally positive news but broadly similar to expectations.
- Census hiring. Census temporary workers are set to boost nonfarm job growth by 255k in August, as additional field staff were hired to conduct interviews.
- Employer surveys. Business activity surveys improved on net in August, as did the employment components of our survey trackers (non-manufacturing +3.0pt to 46.3; manufacturing +2.6pt to 51.4).
- Job cuts. Announced layoffs reported by Challenger, Gray & Christmas fell 65% in August to 116k after rising 68% in July and falling 43% in June (mom, sa by GS). They remain 114% above their August 2019 levels.
Arguing for a weaker-than-expected report:
- Education seasonality. We expect a seasonal drag in education categories related to the coronacrisis to lower September job growth by roughly 200-300k (public + private). Some of the janitors and other school staff who normally return to work in September did not this year due to virtual reopenings in much of the country. Reflecting this, we expect education payrolls to rise by less than the BLS seasonal factors anticipate, resulting in a sizeable drop in reported job growth in the sector. At the same time, the level of education employment is already considerably below its typical summer bottom (11.9mn vs. roughly 12.5mn in a normal year), which we expect to limit the drag to only a few hundred thousand. The inability to obtain childcare is also likely to weigh on job creation at the margin, though its effect may already be mostly reflected in the August payroll levels (given the cancellation of some in-person summer camps and an earlier reduction in childcare provider availability).
- September seasonality. We also note that payrolls have exhibited a tendency toward weak September first prints, with a miss versus consensus in 8 of the last 10 years. However, the magnitude of the potential bias is small (between -30k and -50k) relative to the underlying inflections in the data this year.
- Census hiring. Census temporary workers are set to lower nonfarm job growth by around 50k in September, as training and field operations began to wind down.
- Job cuts. Announced layoffs reported by Challenger, Gray & Christmas rose 5.6% in September to 127k after falling 61% in August and rising 56% in July (mom, sa by GS). They remain 191% above their September 2019 levels.
Neutral/mixed factors:
- Second wave. The US experienced a dramatic resurgence of coronavirus during the second half of June—particularly in the Sun Belt states—and by the July Fourth holiday, nearly two-thirds of the country had paused or reversed their reopening plans. However, job growth remained firm in July and August despite a pause in the Sun Belt leisure and hospitality recovery (see Exhibit 2). With restrictions generally stable or easing over the last month, we note scope for a pickup in job growth in some segments. Illustratively, a 50% reversal of the late-summer leisure deceleration in the Sun Belt would boost monthly job growth by 320k. On the other hand, weaker demand for back-to-school apparel may have limited hiring in the retail sector (relative to a normal September).

And speaking of Goldman, this is what the vampire squid expects tomorrow:
- 1.1mn nonfarm payrolls rose, above consensus of +0.875mn; private payrolls up 1.2mn vs consensus is +0.9mn.
- Unemployment rate declined by three tenths to 8.1%, vs 8.2% consensus, a forecast reflecting another strong rise in household employment partially offset by higher labor force participation.
- Average hourly earnings rose 0.1% month-over-month, boosting the year-on-year rate by a tenth to 4.8%
Source: NewsSquawk, Goldman Sachs
Government
“I Can’t Even Save”: Americans Are Getting Absolutely Crushed Under Enormous Debt Load
"I Can’t Even Save": Americans Are Getting Absolutely Crushed Under Enormous Debt Load
While Joe Biden insists that Americans are doing great…
Share this:


While Joe Biden insists that Americans are doing great - suggesting in his State of the Union Address last week that "our economy is the envy of the world," Americans are being absolutely crushed by inflation (which the Biden admin blames on 'shrinkflation' and 'corporate greed'), and of course - crippling debt.
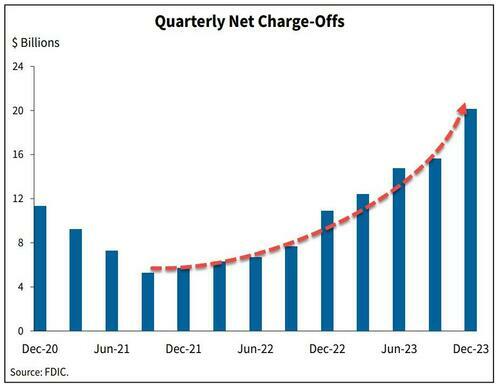
The signs are obvious. Last week we noted that banks' charge-offs are accelerating, and are now above pre-pandemic levels.
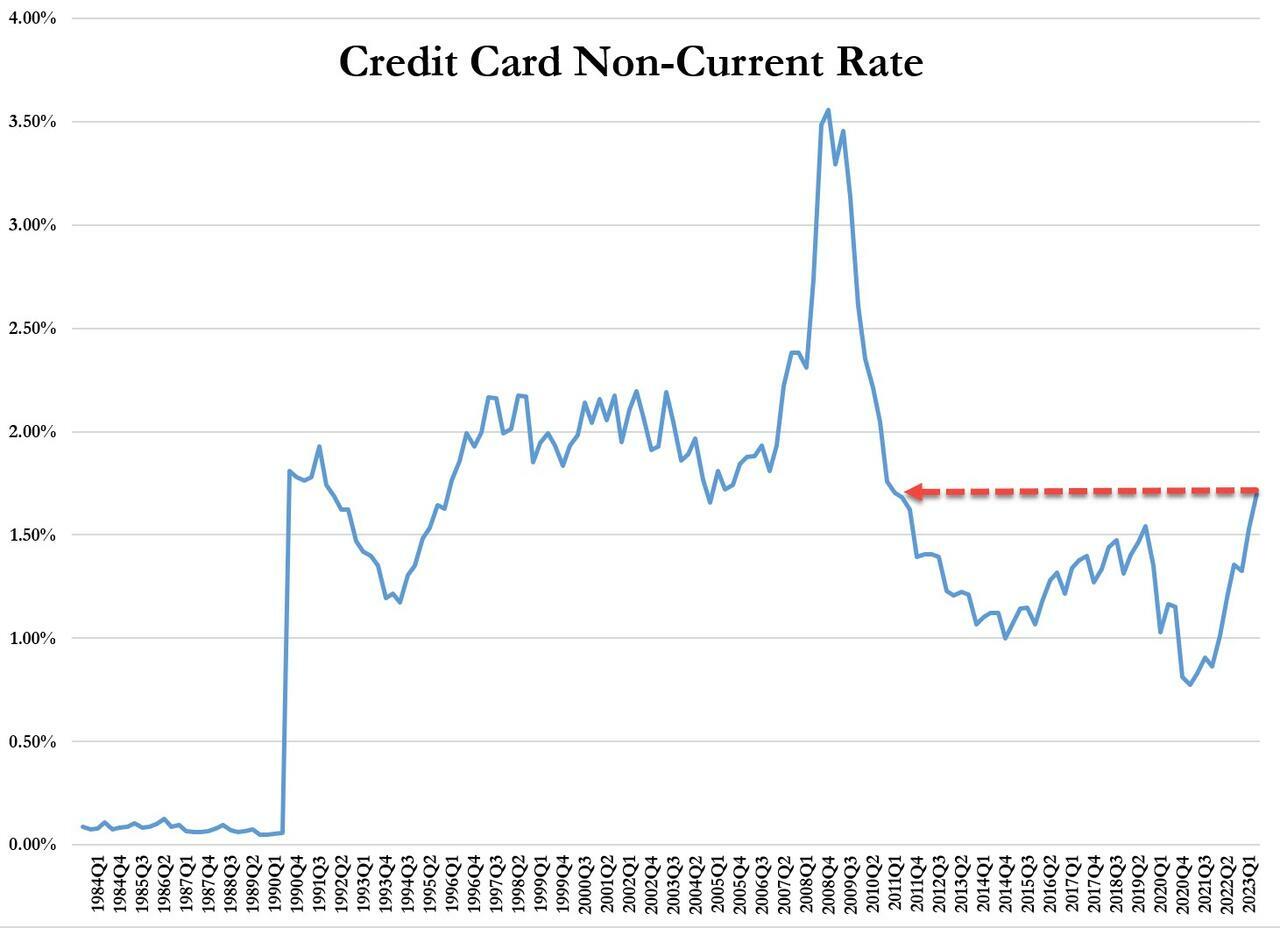
...and leading this increase are credit card loans - with delinquencies that haven't been this high since Q3 2011.
On top of that, while credit cards and nonfarm, nonresidential commercial real estate loans drove the quarterly increase in the noncurrent rate, residential mortgages drove the quarterly increase in the share of loans 30-89 days past due.
And while Biden and crew can spin all they want, an average of polls from RealClear Politics shows that just 40% of people approve of Biden's handling of the economy.
Crushed
On Friday, Bloomberg dug deeper into the effects of Biden's "envious" economy on Americans - specifically, how massive debt loads (credit cards and auto loans especially) are absolutely crushing people.
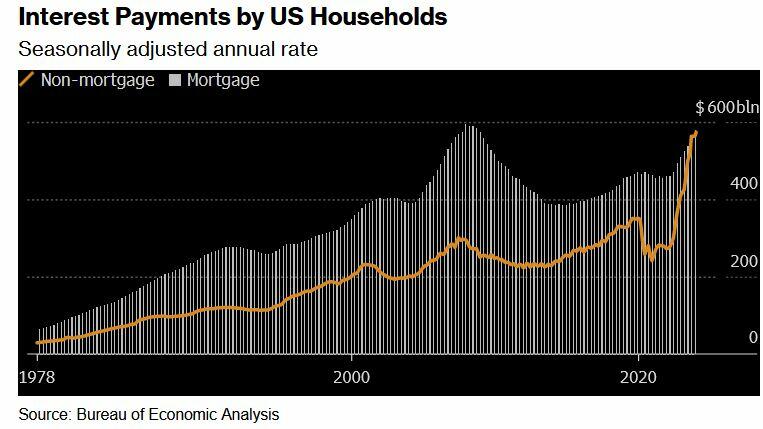
Two years after the Federal Reserve began hiking interest rates to tame prices, delinquency rates on credit cards and auto loans are the highest in more than a decade. For the first time on record, interest payments on those and other non-mortgage debts are as big a financial burden for US households as mortgage interest payments.
According to the report, this presents a difficult reality for millions of consumers who drive the US economy - "The era of high borrowing costs — however necessary to slow price increases — has a sting of its own that many families may feel for years to come, especially the ones that haven’t locked in cheap home loans."
The Fed, meanwhile, doesn't appear poised to cut rates until later this year.
According to a February paper from IMF and Harvard, the recent high cost of borrowing - something which isn't reflected in inflation figures, is at the heart of lackluster consumer sentiment despite inflation having moderated and a job market which has recovered (thanks to job gains almost entirely enjoyed by immigrants).
In short, the debt burden has made life under President Biden a constant struggle throughout America.
"I’m making the most money I've ever made, and I’m still living paycheck to paycheck," 40-year-old Denver resident Nikki Cimino told Bloomberg. Cimino is carrying a monthly mortgage of $1,650, and has $4,000 in credit card debt following a 2020 divorce.

"There's this wild disconnect between what people are experiencing and what economists are experiencing."
CBS: Do you attribute the inflation crisis to the pandemic or Biden?
— RNC Research (@RNCResearch) March 15, 2024
WISCONSIN VOTER: "It's been YEARS now since the pandemic — I'm not buying that anymore. At first I did; I'm not buying that anymore because yogurt is STILL going up in price!" pic.twitter.com/apahb65scB
What's more, according to Wells Fargo, families have taken on debt at a comparatively fast rate - no doubt to sustain the same lifestyle as low rates and pandemic-era stimmies provided. In fact, it only took four years for households to set a record new debt level after paying down borrowings in 2021 when interest rates were near zero.
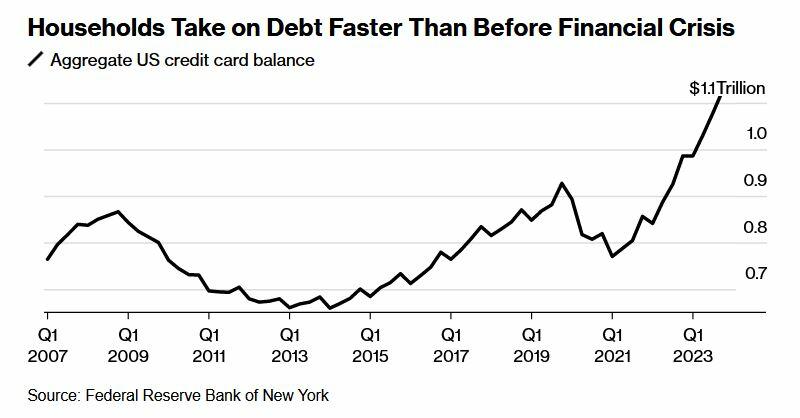
Meanwhile, that increased debt load is exacerbated by credit card interest rates that have climbed to a record 22%, according to the Fed.
[P]art of the reason some Americans were able to take on a substantial load of non-mortgage debt is because they’d locked in home loans at ultra-low rates, leaving room on their balance sheets for other types of borrowing. The effective rate of interest on US mortgage debt was just 3.8% at the end of last year.
Yet the loans and interest payments can be a significant strain that shapes families’ spending choices. -Bloomberg
And of course, the highest-interest debt (credit cards) is hurting lower-income households the most, as tends to be the case.
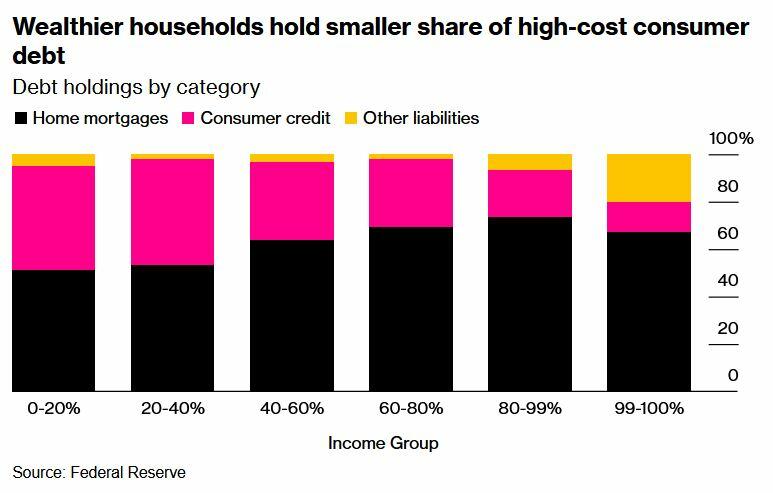
The lowest earners also understandably had the biggest increase in credit card delinquencies.

"Many consumers are levered to the hilt — maxed out on debt and barely keeping their heads above water," Allan Schweitzer, a portfolio manager at credit-focused investment firm Beach Point Capital Management told Bloomberg. "They can dog paddle, if you will, but any uptick in unemployment or worsening of the economy could drive a pretty significant spike in defaults."
"We had more money when Trump was president," said Denise Nierzwicki, 69. She and her 72-year-old husband Paul have around $20,000 in debt spread across multiple cards - all of which have interest rates above 20%.

Photographer: Jon Cherry/Bloomberg
During the pandemic, Denise lost her job and a business deal for a bar they owned in their hometown of Lexington, Kentucky. While they applied for Social Security to ease the pain, Denise is now working 50 hours a week at a restaurant. Despite this, they're barely scraping enough money together to service their debt.
The couple blames Biden for what they see as a gloomy economy and plans to vote for the Republican candidate in November. Denise routinely voted for Democrats up until about 2010, when she grew dissatisfied with Barack Obama’s economic stances, she said. Now, she supports Donald Trump because he lowered taxes and because of his policies on immigration. -Bloomberg
Meanwhile there's student loans - which are not able to be discharged in bankruptcy.
"I can't even save, I don't have a savings account," said 29-year-old in Columbus, Ohio resident Brittany Walling - who has around $80,000 in federal student loans, $20,000 in private debt from her undergraduate and graduate degrees, and $6,000 in credit card debt she accumulated over a six-month stretch in 2022 while she was unemployed.
"I just know that a lot of people are struggling, and things need to change," she told the outlet.
The only silver lining of note, according to Bloomberg, is that broad wage gains resulting in large paychecks has made it easier for people to throw money at credit card bills.
Yet, according to Wells Fargo economist Shannon Grein, "As rates rose in 2023, we avoided a slowdown due to spending that was very much tied to easy access to credit ... Now, credit has become harder to come by and more expensive."
According to Grein, the change has posed "a significant headwind to consumption."
Then there's the election
"Maybe the Fed is done hiking, but as long as rates stay on hold, you still have a passive tightening effect flowing down to the consumer and being exerted on the economy," she continued. "Those household dynamics are going to be a factor in the election this year."
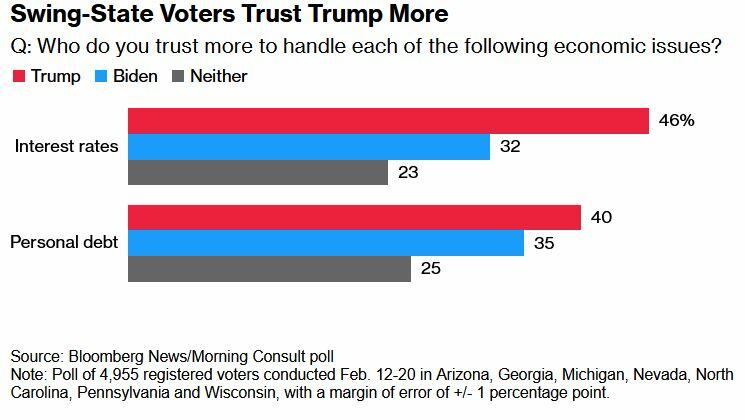
Meanwhile, swing-state voters in a February Bloomberg/Morning Consult poll said they trust Trump more than Biden on interest rates and personal debt.
Reverberations
These 'headwinds' have M3 Partners' Moshin Meghji concerned.
"Any tightening there immediately hits the top line of companies," he said, noting that for heavily indebted companies that took on debt during years of easy borrowing, "there's no easy fix."
International
Copper Soars, Iron Ore Tumbles As Goldman Says “Copper’s Time Is Now”
Copper Soars, Iron Ore Tumbles As Goldman Says "Copper’s Time Is Now"
After languishing for the past two years in a tight range despite recurring…
Share this:

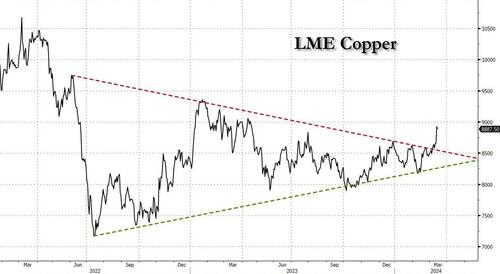
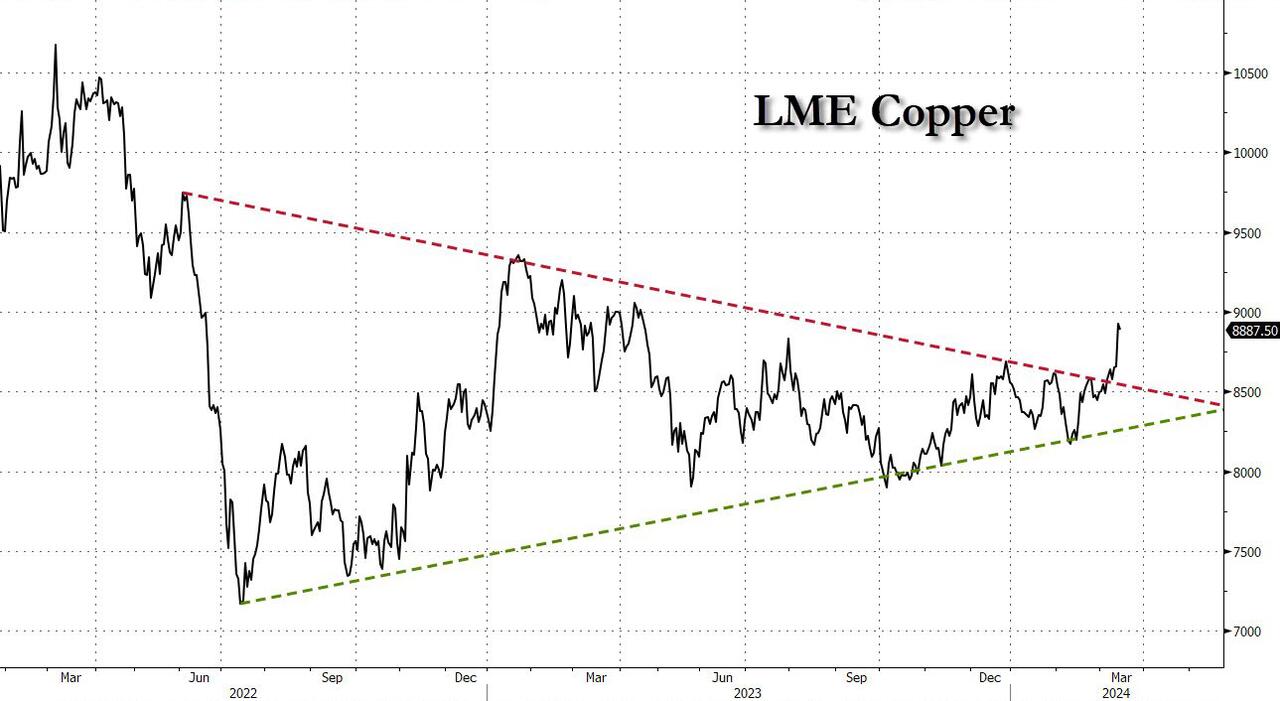
After languishing for the past two years in a tight range despite recurring speculation about declining global supply, copper has finally broken out, surging to the highest price in the past year, just shy of $9,000 a ton as supply cuts hit the market; At the same time the price of the world's "other" most important mined commodity has diverged, as iron ore has tumbled amid growing demand headwinds out of China's comatose housing sector where not even ghost cities are being built any more.
Copper surged almost 5% this week, ending a months-long spell of inertia, as investors focused on risks to supply at various global mines and smelters. As Bloomberg adds, traders also warmed to the idea that the worst of a global downturn is in the past, particularly for metals like copper that are increasingly used in electric vehicles and renewables.
Yet the commodity crash of recent years is hardly over, as signs of the headwinds in traditional industrial sectors are still all too obvious in the iron ore market, where futures fell below $100 a ton for the first time in seven months on Friday as investors bet that China’s years-long property crisis will run through 2024, keeping a lid on demand.
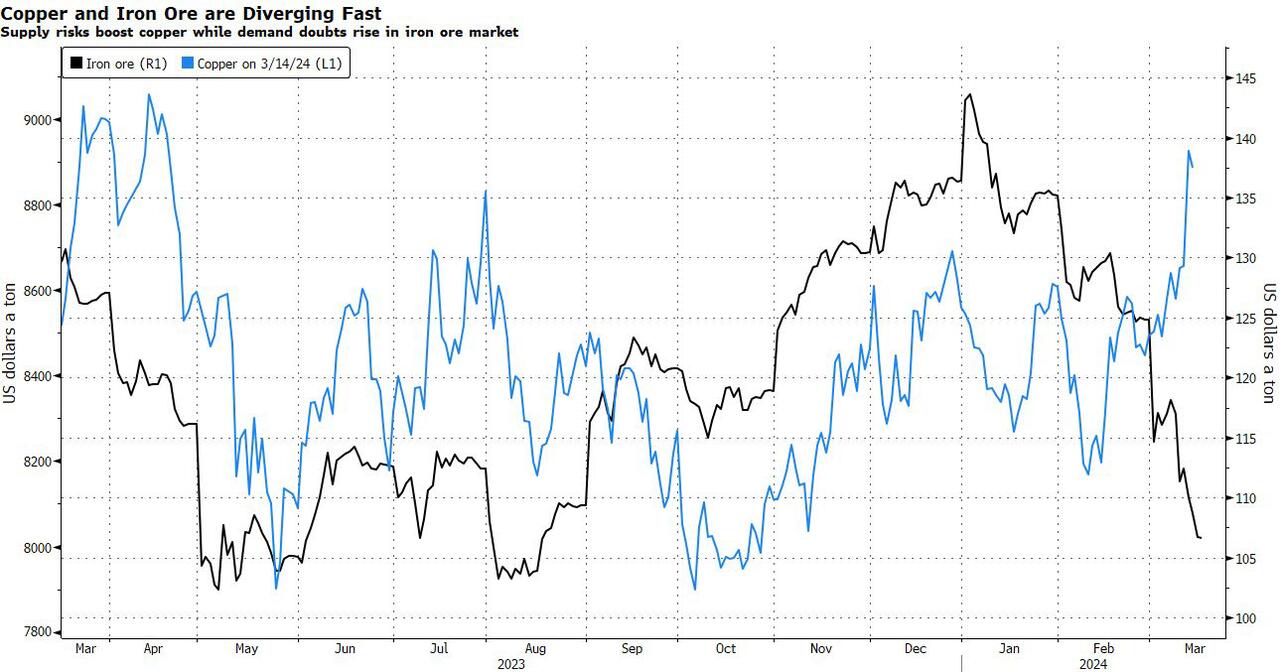
Indeed, while the mood surrounding copper has turned almost euphoric, sentiment on iron ore has soured since the conclusion of the latest National People’s Congress in Beijing, where the CCP set a 5% goal for economic growth, but offered few new measures that would boost infrastructure or other construction-intensive sectors.
As a result, the main steelmaking ingredient has shed more than 30% since early January as hopes of a meaningful revival in construction activity faded. Loss-making steel mills are buying less ore, and stockpiles are piling up at Chinese ports. The latest drop will embolden those who believe that the effects of President Xi Jinping’s property crackdown still have significant room to run, and that last year’s rally in iron ore may have been a false dawn.
Meanwhile, as Bloomberg notes, on Friday there were fresh signs that weakness in China’s industrial economy is hitting the copper market too, with stockpiles tracked by the Shanghai Futures Exchange surging to the highest level since the early days of the pandemic. The hope is that headwinds in traditional industrial areas will be offset by an ongoing surge in usage in electric vehicles and renewables.
And while industrial conditions in Europe and the US also look soft, there’s growing optimism about copper usage in India, where rising investment has helped fuel blowout growth rates of more than 8% — making it the fastest-growing major economy.
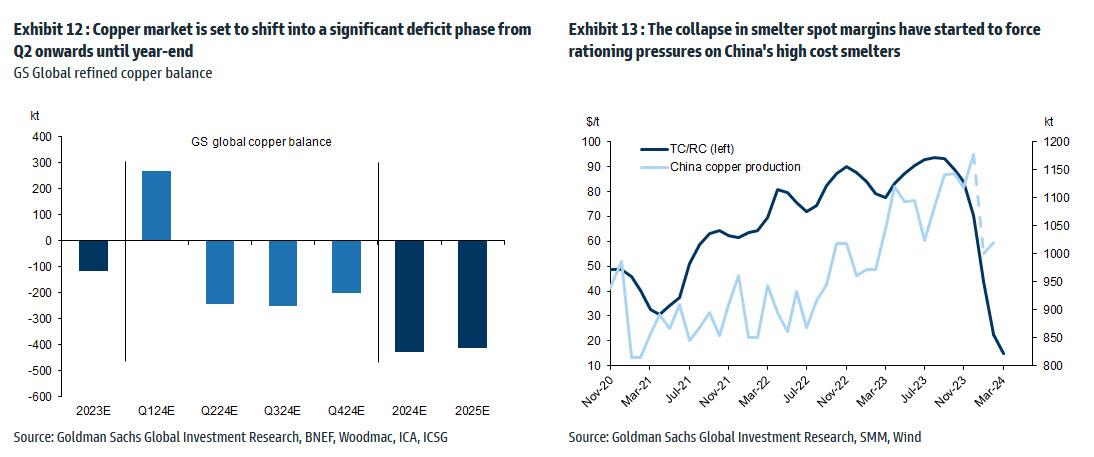
In any case, with the demand side of the equation still questionable, the main catalyst behind copper’s powerful rally is an unexpected tightening in global mine supplies, driven mainly by last year’s closure of a giant mine in Panama (discussed here), but there are also growing worries about output in Zambia, which is facing an El Niño-induced power crisis.
On Wednesday, copper prices jumped on huge volumes after smelters in China held a crisis meeting on how to cope with a sharp drop in processing fees following disruptions to supplies of mined ore. The group stopped short of coordinated production cuts, but pledged to re-arrange maintenance work, reduce runs and delay the startup of new projects. In the coming weeks investors will be watching Shanghai exchange inventories closely to gauge both the strength of demand and the extent of any capacity curtailments.
“The increase in SHFE stockpiles has been bigger than we’d anticipated, but we expect to see them coming down over the next few weeks,” Colin Hamilton, managing director for commodities research at BMO Capital Markets, said by phone. “If the pace of the inventory builds doesn’t start to slow, investors will start to question whether smelters are actually cutting and whether the impact of weak construction activity is starting to weigh more heavily on the market.”
* * *
Few have been as happy with the recent surge in copper prices as Goldman's commodity team, where copper has long been a preferred trade (even if it may have cost the former team head Jeff Currie his job due to his unbridled enthusiasm for copper in the past two years which saw many hedge fund clients suffer major losses).
As Goldman's Nicholas Snowdon writes in a note titled "Copper's time is now" (available to pro subscribers in the usual place)...

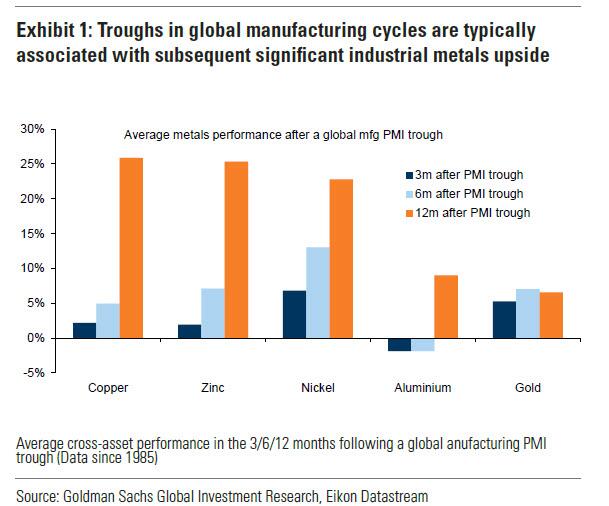
... there has been a "turn in the industrial cycle." Specifically according to the Goldman analyst, after a prolonged downturn, "incremental evidence now points to a bottoming out in the industrial cycle, with the global manufacturing PMI in expansion for the first time since September 2022." As a result, Goldman now expects copper to rise to $10,000/t by year-end and then $12,000/t by end of Q1-25.’
Here are the details:
Previous inflexions in global manufacturing cycles have been associated with subsequent sustained industrial metals upside, with copper and aluminium rising on average 25% and 9% over the next 12 months. Whilst seasonal surpluses have so far limited a tightening alignment at a micro level, we expect deficit inflexions to play out from quarter end, particularly for metals with severe supply binds. Supplemented by the influence of anticipated Fed easing ahead in a non-recessionary growth setting, another historically positive performance factor for metals, this should support further upside ahead with copper the headline act in this regard.
Goldman then turns to what it calls China's "green policy put":
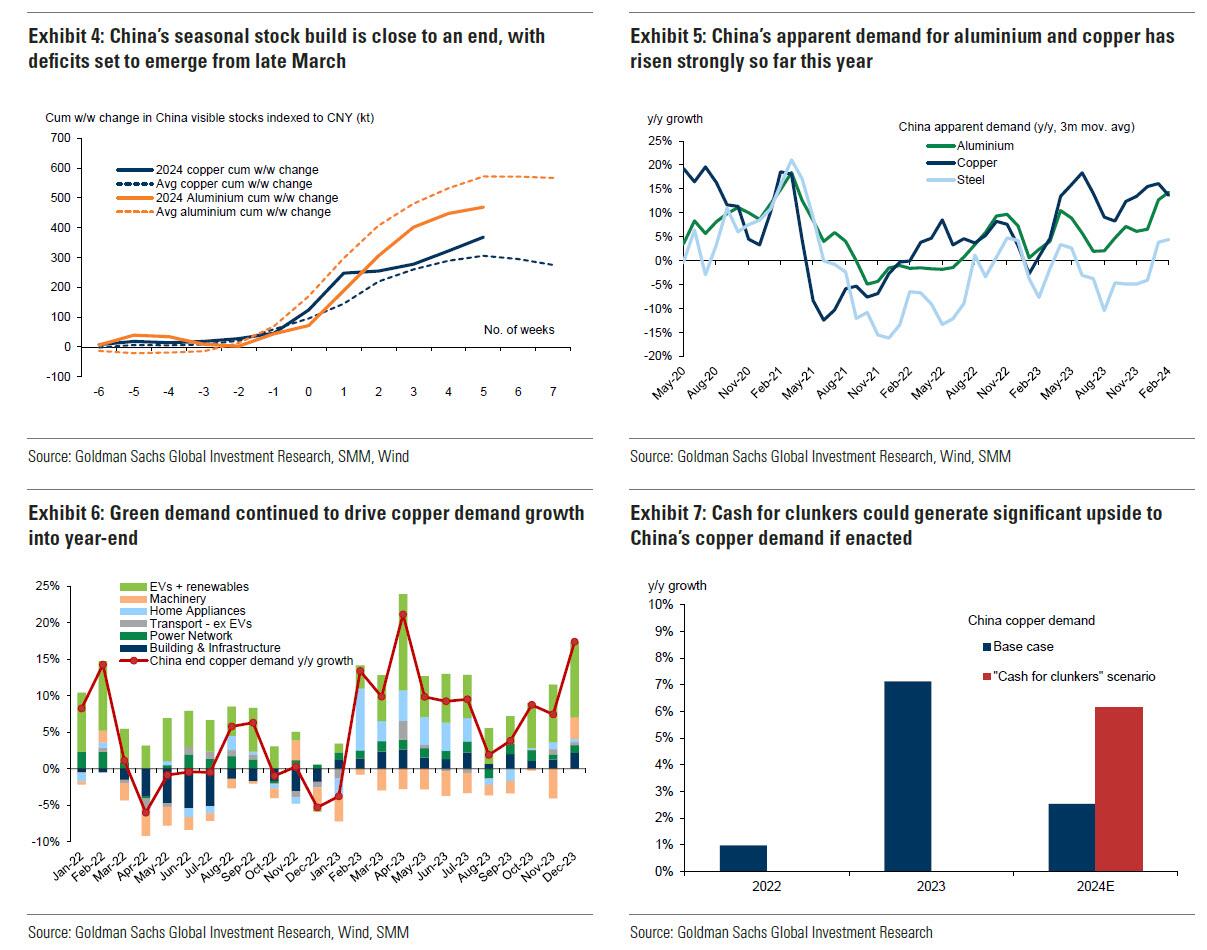
Much of the recent focus on the “Two Sessions” event centred on the lack of significant broad stimulus, and in particular the limited property support. In our view it would be wrong – just as in 2022 and 2023 – to assume that this will result in weak onshore metals demand. Beijing’s emphasis on rapid growth in the metals intensive green economy, as an offset to property declines, continues to act as a policy put for green metals demand. After last year’s strong trends, evidence year-to-date is again supportive with aluminium and copper apparent demand rising 17% and 12% y/y respectively. Moreover, the potential for a ‘cash for clunkers’ initiative could provide meaningful right tail risk to that healthy demand base case. Yet there are also clear metal losers in this divergent policy setting, with ongoing pressure on property related steel demand generating recent sharp iron ore downside.
Meanwhile, Snowdon believes that the driver behind Goldman's long-running bullish view on copper - a global supply shock - continues:
Copper’s supply shock progresses. The metal with most significant upside potential is copper, in our view. The supply shock which began with aggressive concentrate destocking and then sharp mine supply downgrades last year, has now advanced to an increasing bind on metal production, as reflected in this week's China smelter supply rationing signal. With continued positive momentum in China's copper demand, a healthy refined import trend should generate a substantial ex-China refined deficit this year. With LME stocks having halved from Q4 peak, China’s imminent seasonal demand inflection should accelerate a path into extreme tightness by H2. Structural supply underinvestment, best reflected in peak mine supply we expect next year, implies that demand destruction will need to be the persistent solver on scarcity, an effect requiring substantially higher pricing than current, in our view. In this context, we maintain our view that the copper price will surge into next year (GSe 2025 $15,000/t average), expecting copper to rise to $10,000/t by year-end and then $12,000/t by end of Q1-25’
Another reason why Goldman is doubling down on its bullish copper outlook: gold.
The sharp rally in gold price since the beginning of March has ended the period of consolidation that had been present since late December. Whilst the initial catalyst for the break higher came from a (gold) supportive turn in US data and real rates, the move has been significantly amplified by short term systematic buying, which suggests less sticky upside. In this context, we expect gold to consolidate for now, with our economists near term view on rates and the dollar suggesting limited near-term catalysts for further upside momentum. Yet, a substantive retracement lower will also likely be limited by resilience in physical buying channels. Nonetheless, in the midterm we continue to hold a constructive view on gold underpinned by persistent strength in EM demand as well as eventual Fed easing, which should crucially reactivate the largely for now dormant ETF buying channel. In this context, we increase our average gold price forecast for 2024 from $2,090/toz to $2,180/toz, targeting a move to $2,300/toz by year-end.
Much more in the full Goldman note available to pro subs.
Government
Moderna turns the spotlight on long Covid with new initiatives
Moderna’s latest Covid effort addresses the often-overlooked chronic condition of long Covid — and encourages vaccination to reduce risks. A digital…
Share this:


Moderna’s latest Covid effort addresses the often-overlooked chronic condition of long Covid — and encourages vaccination to reduce risks. A digital campaign debuted Friday along with a co-sponsored event in Detroit offering free CT scans, which will also be used in ongoing long Covid research.
In a new video, a young woman describes her three-year battle with long Covid, which includes losing her job, coping with multiple debilitating symptoms and dealing with the negative effects on her family. She ends by saying, “The only way to prevent long Covid is to not get Covid” along with an on-screen message about where to find Covid-19 vaccines through the vaccines.gov website.
“Last season we saw people would get a flu shot, but they didn’t always get a Covid shot,” said Moderna’s Chief Brand Officer Kate Cronin. “People should get their flu shot, but they should also get their Covid shot. There’s no risk of long flu, but there is the risk of long-term effects of Covid.”
It’s Moderna’s “first effort to really sound the alarm,” she said, and the debut coincides with the second annual Long Covid Awareness Day.
An estimated 17.6 million Americans are living with long Covid, according to the latest CDC data. About four million of them are out of work because of the condition, resulting in an estimated $170 billion in lost wages.
While HHS anted up $45 million in grants last year to expand long Covid support initiatives along with public health campaigns, the condition is still often ignored and underfunded.
“It’s not just about the initial infection of Covid, but also if you get it multiple times, your risks goes up significantly,” Cronin said. “It’s important that people understand that.”
grants covid-19 cdc hhs

Sylvester researchers, collaborators call for greater investment in bereavement care


For-profit nursing homes are cutting corners on safety and draining resources with financial shenanigans − especially at midsize chains that dodge public scrutiny


“I Can’t Even Save”: Americans Are Getting Absolutely Crushed Under Enormous Debt Load


Problems After COVID-19 Vaccination More Prevalent Among Naturally Immune: Study


Moderna turns the spotlight on long Covid with new initiatives


Copper Soars, Iron Ore Tumbles As Goldman Says “Copper’s Time Is Now”


Trump nearly derailed democracy once − here’s what to watch out for in reelection campaign


‘Excess Mortality Skyrocketed’: Tucker Carlson and Dr. Pierre Kory Unpack ‘Criminal’ COVID Response


Looking Back At COVID’s Authoritarian Regimes


Five Aerospace Investments to Buy as Wars Worsen Copy
-

 Uncategorized3 weeks ago
All Of The Elements Are In Place For An Economic Crisis Of Staggering Proportions
-

 International1 week ago
EyePoint poaches medical chief from Apellis; Sandoz CFO, longtime BioNTech exec to retire
-

 Uncategorized4 weeks ago
California Counties Could Be Forced To Pay $300 Million To Cover COVID-Era Program
-

 Uncategorized3 weeks ago
Apparel Retailer Express Moving Toward Bankruptcy
-

 Uncategorized4 weeks ago
Industrial Production Decreased 0.1% in January
-

 International1 week ago
Walmart launches clever answer to Target’s new membership program
-

 Spread & Containment3 days ago
IFM’s Hat Trick and Reflections On Option-To-Buy M&A
-

 Uncategorized4 weeks ago
RFK Jr: The Wuhan Cover-Up & The Rise Of The Biowarfare-Industrial Complex