The below is an excerpt from a recent edition of Bitcoin Magazine Pro, Bitcoin Magazine's premium markets newsletter. To be among the first to receive these insights and other on-chain bitcoin market analysis straight to your inbox, subscribe now.
If Recession, Then Not Inflation
Last week, I wrote about the Fed Funds Futures curve, concluding rate cuts will likely start in the middle of next year, giving bitcoin plenty of room to rally through the halving season. That analysis is based on the high probability that a recession is coming, which does not match with the common belief that inflation is heating back up. Today, I want to discuss a couple common paradoxes to clear up that disconnect.
US 10-Year Treasury is Blowing Up
The rise in the US 10-year Treasury yield has been awe-inspiring, breaking to 16-year highs. To many people, this is a harbinger of a monetary doomsday feedback loop.
Higher yields mean higher interest payments for the government, a weaker economy, higher inflation, more money printing, and even higher yields. The key ingredient of that feedback loop is more money printing. If the economy can increase the money supply, a recession will be avoided, but will instead trade-off for higher inflation and yields. Without an increase in private credit creation, the feedback loop collapses in on itself and moves toward recession and deflation.
Here we have our first widely-believed paradox, that we can be heading into a severe recession and going to suffer an inflationary doom loop at the same time. In reality, these are mutually exclusive outcomes in the modern economy.
Yields fall in recessions and deflation becomes the primary concern, especially in the post-Great Financial Crisis (GFC) era where the increased debt burden outweighs the productivity of new debt. Either we are headed for recession or yields and inflation are going to run hot.
It is hard to find someone who doesn’t see major signs of recession. People are tapped out and most analysts see the elusive soft-landing as a best case scenario. Recession is a pretty safe bet. Therefore, we have to expect rates to peak soon and start coming down. We cannot be sure when, but before the Fed pivots or an official recession is declared.
Above, the 10Y peaked in 2018, long before a rate cut from the Fed or a declared recession. Either private credit creation rises dramatically to support higher yields and CPI or market yields will turn, leading the Fed’s policy lower into recession.
Oil and Inflation
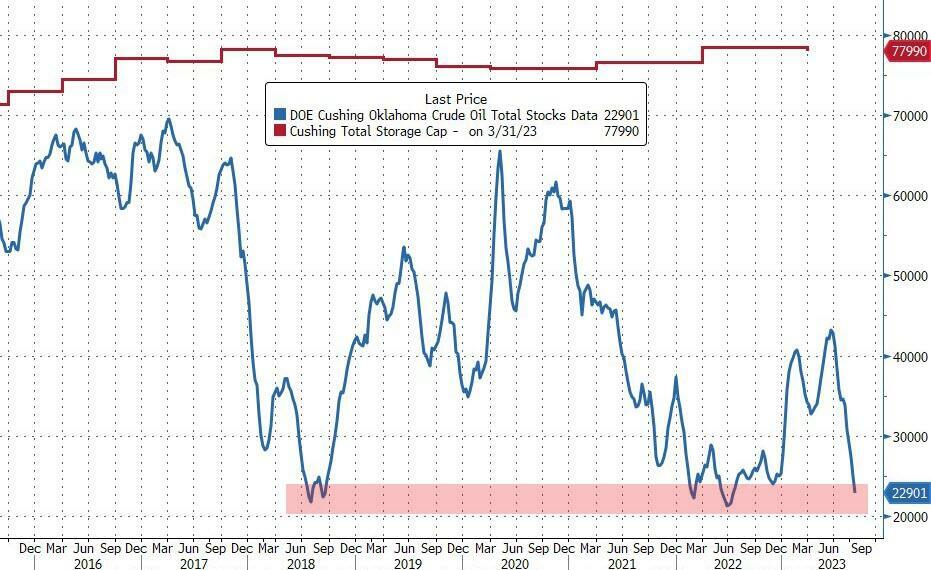
Many cite the cost-push effect of the rising oil price as a cause for inflation to re-accelerate. This morning, I saw this chart in an article from Zerohedge, “Oil Can Push Higher As Cushing Stockpiles Collapse,” and it beautifully exemplifies the prevailing confusion. Do inventory levels at Cushing, OK matter at all to the price of oil?
Above, I lined up WTI oil futures for the same period as the Cushing inventory chart and highlighted the prices at the LOWS in inventory: July 2018, June 2022, and today. Would you say those are at tops or bottoms?
This is our second paradox of the day, rising oil prices can cause recessions and inflation at the same time in our modern economy. In reality, it is not a causal relationship. Low inventory levels do not equal tight supply. Both inventory levels and price are symptoms of more basic supply and demand in the real economy.
Low inventories and high oil prices mean demand has been outstripping supply. Those high oil prices, in turn, cause demand destruction forcing demand to fall, allowing prices to fall and inventory to build. This is very clear on the chart and is the dominant dynamic unless it is met with increased levels of private credit creation.
Gasoline futures are also breaking lower. Again, I highlight the Cushing lows which are followed immediately by falling prices. The exact opposite of the prevailing wisdom. Does this look like cost-push inflation from oil is headed our way? No, it looks like demand is declining into recession.
To round out today’s coverage, let’s take a look at stocks and Bitcoin. It is true, during an official recession stocks typically go down. However, the year leading up to a recession is usually bullish. Bitcoin has only experienced one recession, but right now, we expect it to behave like risk assets.
Our forecast is for an approaching recession starting in the second half of 2024 or even later. That would mean this current sell-off in stocks (that happens to be corresponding with the seasonal crunch at the end of Q3), and lackadaisical performance of bitcoin, have a year to reverse and rally.
This is the final paradox of the day, an approaching recession is good for risk assets. The year leading into recessions are characterized by falling Treasury yields, falling economic demand, and hence falling CPI. That is why so many PhD economists at the Fed are tricked into not seeing the recession coming.
This is positive for stocks and bitcoin because of asset price inflation, or the rise in the price of assets coupled with a stagnant economy. In the lead-up to recession, lenders become weary of the economy and narrow access to credit. As credit tightens into recession, rates fall and only the most creditworthy and trusted borrowers maintain access to new credit. The largest stocks will benefit, while Mom-and-Pop businesses are starved for credit.
If recession is approaching, we should therefore expect stocks and bitcoin to rise in the medium term, only to fall when recession is imminent. A near-term reversal in stocks is supported by the percent of S&P 500 stocks above their 50-day moving averages. When it is below 20%, it corresponds to bottoms.
A recession is coming which precludes higher for longer CPI inflation and yields. However, it is still a long way off and in the interim, we should expect stocks and bitcoin to rise as yields, oil and CPI decline.
BUFFALO, NY- March 11, 2024 – Impact Journals publishes scholarly journals in the biomedical sciences with a focus on all areas of cancer and aging research. Aging is one of the most prominent journals published by Impact Journals.
Credit: Impact Journals
BUFFALO, NY- March 11, 2024 – Impact Journals publishes scholarly journals in the biomedical sciences with a focus on all areas of cancer and aging research. Aging is one of the most prominent journals published by Impact Journals.
Impact Journals will be participating as an exhibitor at the American Association for Cancer Research (AACR) Annual Meeting 2024 from April 5-10 at the San Diego Convention Center in San Diego, California. This year, the AACR meeting theme is “Inspiring Science • Fueling Progress • Revolutionizing Care.”
Visit booth #4159 at the AACR Annual Meeting 2024 to connect with members of the Agingteam.
About Aging-US:
Agingpublishes research papers in all fields of aging research including but not limited, aging from yeast to mammals, cellular senescence, age-related diseases such as cancer and Alzheimer’s diseases and their prevention and treatment, anti-aging strategies and drug development and especially the role of signal transduction pathways such as mTOR in aging and potential approaches to modulate these signaling pathways to extend lifespan. The journal aims to promote treatment of age-related diseases by slowing down aging, validation of anti-aging drugs by treating age-related diseases, prevention of cancer by inhibiting aging. Cancer and COVID-19 are age-related diseases.
Agingis indexed and archived byPubMed/Medline (abbreviated as “Aging (Albany NY)”), PubMed Central, Web of Science: Science Citation Index Expanded (abbreviated as “Aging‐US” and listed in the Cell Biology and Geriatrics & Gerontology categories), Scopus (abbreviated as “Aging” and listed in the Cell Biology and Aging categories), Biological Abstracts, BIOSIS Previews, EMBASE, META (Chan Zuckerberg Initiative) (2018-2022), and Dimensions (Digital Science).
Please visit our website at www.Aging-US.com and connect with us:
NY Fed Finds Medium, Long-Term Inflation Expectations Jump Amid Surge In Stock Market Optimism
One month after the inflation outlook tracked by the NY Fed Consumer Survey extended their late 2023 slide, with 3Y inflation expectations in January sliding to a record low 2.4% (from 2.6% in December), even as 1 and 5Y inflation forecasts remained flat, moments ago the NY Fed reported that in February there was a sharp rebound in longer-term inflation expectations, rising to 2.7% from 2.4% at the three-year ahead horizon, and jumping to 2.9% from 2.5% at the five-year ahead horizon, while the 1Y inflation outlook was flat for the 3rd month in a row, stuck at 3.0%.
The increases in both the three-year ahead and five-year ahead measures were most pronounced for respondents with at most high school degrees (in other words, the "really smart folks" are expecting deflation soon). The survey’s measure of disagreement across respondents (the difference between the 75th and 25th percentile of inflation expectations) decreased at all horizons, while the median inflation uncertainty—or the uncertainty expressed regarding future inflation outcomes—declined at the one- and three-year ahead horizons and remained unchanged at the five-year ahead horizon.
Going down the survey, we find that the median year-ahead expected price changes increased by 0.1 percentage point to 4.3% for gas; decreased by 1.8 percentage points to 6.8% for the cost of medical care (its lowest reading since September 2020); decreased by 0.1 percentage point to 5.8% for the cost of a college education; and surprisingly decreased by 0.3 percentage point for rent to 6.1% (its lowest reading since December 2020), and remained flat for food at 4.9%.
We find the rent expectations surprising because it is happening just asking rents are rising across the country.
At the same time as consumers erroneously saw sharply lower rents, median home price growth expectations remained unchanged for the fifth consecutive month at 3.0%.
Turning to the labor market, the survey found that the average perceived likelihood of voluntary and involuntary job separations increased, while the perceived likelihood of finding a job (in the event of a job loss) declined. "The mean probability of leaving one’s job voluntarily in the next 12 months also increased, by 1.8 percentage points to 19.5%."
Mean unemployment expectations - or the mean probability that the U.S. unemployment rate will be higher one year from now - decreased by 1.1 percentage points to 36.1%, the lowest reading since February 2022. Additionally, the median one-year-ahead expected earnings growth was unchanged at 2.8%, remaining slightly below its 12-month trailing average of 2.9%.
Turning to household finance, we find the following:
The median expected growth in household income remained unchanged at 3.1%. The series has been moving within a narrow range of 2.9% to 3.3% since January 2023, and remains above the February 2020 pre-pandemic level of 2.7%.
Median household spending growth expectations increased by 0.2 percentage point to 5.2%. The increase was driven by respondents with a high school degree or less.
Median year-ahead expected growth in government debt increased to 9.3% from 8.9%.
The mean perceived probability that the average interest rate on saving accounts will be higher in 12 months increased by 0.6 percentage point to 26.1%, remaining below its 12-month trailing average of 30%.
Perceptions about households’ current financial situations deteriorated somewhat with fewer respondents reporting being better off than a year ago. Year-ahead expectations also deteriorated marginally with a smaller share of respondents expecting to be better off and a slightly larger share of respondents expecting to be worse off a year from now.
The mean perceived probability that U.S. stock prices will be higher 12 months from now increased by 1.4 percentage point to 38.9%.
At the same time, perceptions and expectations about credit access turned less optimistic: "Perceptions of credit access compared to a year ago deteriorated with a larger share of respondents reporting tighter conditions and a smaller share reporting looser conditions compared to a year ago."
Also, a smaller percentage of consumers, 11.45% vs 12.14% in prior month, expect to not be able to make minimum debt payment over the next three months
Last, and perhaps most humorous, is the now traditional cognitive dissonance one observes with these polls, because at a time when long-term inflation expectations jumped, which clearly suggests that financial conditions will need to be tightened, the number of respondents expecting higher stock prices one year from today jumped to the highest since November 2021... which incidentally is just when the market topped out during the last cycle before suffering a painful bear market.
Homes listed for sale in early June sell for $7,700 more
New Zillow research suggests the spring home shopping season may see a second wave this summer if mortgage rates fall
The post Homes listed for sale in…
A Zillow analysis of 2023 home sales finds homes listed in the first two weeks of June sold for 2.3% more.
The best time to list a home for sale is a month later than it was in 2019, likely driven by mortgage rates.
The best time to list can be as early as the second half of February in San Francisco, and as late as the first half of July in New York and Philadelphia.
Spring home sellers looking to maximize their sale price may want to wait it out and list their home for sale in the first half of June. A new Zillow® analysis of 2023 sales found that homes listed in the first two weeks of June sold for 2.3% more, a $7,700 boost on a typical U.S. home.
The best time to list consistently had been early May in the years leading up to the pandemic. The shift to June suggests mortgage rates are strongly influencing demand on top of the usual seasonality that brings buyers to the market in the spring. This home-shopping season is poised to follow a similar pattern as that in 2023, with the potential for a second wave if the Federal Reserve lowers interest rates midyear or later.
The 2.3% sale price premium registered last June followed the first spring in more than 15 years with mortgage rates over 6% on a 30-year fixed-rate loan. The high rates put home buyers on the back foot, and as rates continued upward through May, they were still reassessing and less likely to bid boldly. In June, however, rates pulled back a little from 6.79% to 6.67%, which likely presented an opportunity for determined buyers heading into summer. More buyers understood their market position and could afford to transact, boosting competition and sale prices.
The old logic was that sellers could earn a premium by listing in late spring, when search activity hit its peak. Now, with persistently low inventory, mortgage rate fluctuations make their own seasonality. First-time home buyers who are on the edge of qualifying for a home loan may dip in and out of the market, depending on what’s happening with rates. It is almost certain the Federal Reserve will push back any interest-rate cuts to mid-2024 at the earliest. If mortgage rates follow, that could bring another surge of buyers later this year.
Mortgage rates have been impacting affordability and sale prices since they began rising rapidly two years ago. In 2022, sellers nationwide saw the highest sale premium when they listed their home in late March, right before rates barreled past 5% and continued climbing.
Zillow’s research finds the best time to list can vary widely by metropolitan area. In 2023, it was as early as the second half of February in San Francisco, and as late as the first half of July in New York. Thirty of the top 35 largest metro areas saw for-sale listings command the highest sale prices between May and early July last year.
Zillow also found a wide range in the sale price premiums associated with homes listed during those peak periods. At the hottest time of the year in San Jose, homes sold for 5.5% more, a $88,000 boost on a typical home. Meanwhile, homes in San Antonio sold for 1.9% more during that same time period.
We use cookies on our website to give you the most relevant experience by remembering your preferences and repeat visits. By clicking “Accept”, you consent to the use of ALL the cookies.
This website uses cookies to improve your experience while you navigate through the website. Out of these, the cookies that are categorized as necessary are stored on your browser as they are essential for the working of basic functionalities of the website. We also use third-party cookies that help us analyze and understand how you use this website. These cookies will be stored in your browser only with your consent. You also have the option to opt-out of these cookies. But opting out of some of these cookies may affect your browsing experience.
Necessary cookies are absolutely essential for the website to function properly. These cookies ensure basic functionalities and security features of the website, anonymously.
Cookie
Duration
Description
cookielawinfo-checbox-analytics
11 months
This cookie is set by GDPR Cookie Consent plugin. The cookie is used to store the user consent for the cookies in the category "Analytics".
cookielawinfo-checbox-functional
11 months
The cookie is set by GDPR cookie consent to record the user consent for the cookies in the category "Functional".
cookielawinfo-checbox-others
11 months
This cookie is set by GDPR Cookie Consent plugin. The cookie is used to store the user consent for the cookies in the category "Other.
cookielawinfo-checkbox-necessary
11 months
This cookie is set by GDPR Cookie Consent plugin. The cookies is used to store the user consent for the cookies in the category "Necessary".
cookielawinfo-checkbox-performance
11 months
This cookie is set by GDPR Cookie Consent plugin. The cookie is used to store the user consent for the cookies in the category "Performance".
viewed_cookie_policy
11 months
The cookie is set by the GDPR Cookie Consent plugin and is used to store whether or not user has consented to the use of cookies. It does not store any personal data.
Functional cookies help to perform certain functionalities like sharing the content of the website on social media platforms, collect feedbacks, and other third-party features.
Performance cookies are used to understand and analyze the key performance indexes of the website which helps in delivering a better user experience for the visitors.
Analytical cookies are used to understand how visitors interact with the website. These cookies help provide information on metrics the number of visitors, bounce rate, traffic source, etc.
Advertisement cookies are used to provide visitors with relevant ads and marketing campaigns. These cookies track visitors across websites and collect information to provide customized ads.


