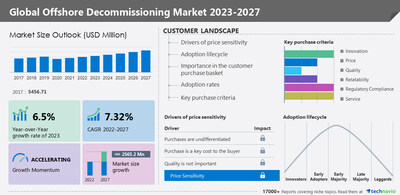
NEW YORK, Feb. 7, 2023 /PRNewswire/ -- The offshore decommissioning market is fragmented due to the presence of numerous international and regional players. The Key players adopt multiple strategies to gain a competitive advantage over other players. Such strategies include M&A, joint ventures, contracts, and agreements, as well as partnerships that help them succeed in the global offshore decommissioning market. The Offshore decommissioning market size is forecast to grow by USD 2,565.2 million estimated to grow at a CAGR of 7.32% from 2022 to 2027, according to Technavio. Request Latest PDF Sample Report
Offshore decommissioning market 2022-2026: Scope
The offshore decommissioning market report covers the following areas:
The offshore decommissioning market report provides critical information and factual data, with a qualitative and quantitative study of the market based on market drivers and limitations as well as future prospects.
Why buy?
- Add credibility to the strategy
- Analyzes competitor's offerings
- Get a holistic view of the market
Grow your profit margin with Technavio - Buy the report
Offshore decommissioning market 2022-2026: Segmentation
The market growth in the Shallow water segment will be significant during the forecast period. Traditionally, shallow water was classified as being between 300 and 400 feet (91 and 121 meters) deep, but presently, anything less than 1000 feet (305 meters) is considered shallow water. Jackup rigs, submersibles, and drill barges are used in the shallow water portion. Such factors will increase segment growth during the forecast period.
- Service Outlook (USD Million, 2017 - 2027)
- Well-plugging and abandonment
- Platform removal
- Permitting and regulatory compliance
- Platform preparation
- Others
- Geography
- North America
- Europe
- The UK
- Germany
- France
- Rest of Europe
- APAC
- South America
- Middle East and Africa
- Saudi Arabia
- South Africa
- Rest of the Middle East & Africa
Europe will account for 55% of the market growth during the forecast period. Several oil and gas fields are likely to be decommissioned during the forecast period. The vendors in the region are awarded contracts for decommissioning oil and gas fields. For instance, in June 2020, AF Gruppen was awarded a decommissioning contract by Shell UK Ltd for dismantling and recycling the Curlew floating, production, storage, and offloading unit, which operated in the North Sea. Such an increase in the number of contracts for offshore decommissioning activities will drive the growth of the market in the region during the forecast period.
Offshore decommissioning market 2022-2026: Vendor Analysis
Able UK Ltd., AF Gruppen Norge AS, Aker Solutions ASA, Baker Hughes Co., DeepOcean Group Holding BV, DNV Group AS, Halliburton Co., Heerema International Group, John Wood Group PLC, Oceaneering International Inc., Perenco, Petrofac Ltd., Ramboll Group AS, Royal Boskalis Westminster N.V., SAIPEM SpA, Schlumberger Ltd., Subsea 7 SA, TechnipFMC plc, Weatherford International Plc, and Allseas Group SA.
Request a PDF Sample Now
What are the key data covered in the Offshore decommissioning market report?
- CAGR of the market during the forecast period 2023-2027
- Detailed information on factors that will assist offshore decommissioning market growth during the next five years
- Estimation of the offshore decommissioning market size and its contribution to the parent market
- Predictions on upcoming trends and changes in consumer behavior
- The growth of the offshore decommissioning market
- Analysis of the market's competitive landscape and detailed information on vendors
- Comprehensive details of factors that will challenge the growth of offshore decommissioning market, vendors
Subscribe to our "Basic Plan" billed annually at USD 5000 that enables you to download 5 reports and view 100 reports every month
Related Reports:
- The offshore drilling rigs market is estimated to grow at a CAGR of 3.16% between 2022 and 2027. The size of the market is forecast to increase by USD 2,821.26 million. The rising investments in the upstream oil and gas sector are notably driving the market growth, although factors such as uncertainty associated with low crude oil prices may impede the market growth.
- The offshore oil and gas pipeline market is estimated to grow at a CAGR of 5.3% between 2022 and 2027. The size of the market is forecast to increase by USD 3,754.62 million. The economic benefits of offshore pipelines over other oil and gas transportation modes are notably driving the offshore oil and gas pipeline market growth, although factors such as fluctuations in global crude oil and natural gas prices may impede the market growth.
Offshore Decommissioning Market Scope
|
Report Coverage
| Details
|
Page number
| 175
|
Base year
| 2022
|
Historic period
| 2017-2021
|
Forecast period
| 2023-2027
|
Growth momentum & CAGR
| Accelerate at a CAGR of 7.32%
|
Market growth 2023-2027
| USD 2,565.2 million
|
Market structure
| Fragmented
|
YoY growth 2022-2023(%)
| 6.5
|
Regional analysis
| Europe, North America, APAC, South America, and Middle East and Africa
|
Performing market contribution
| Europe at 55%
|
Key countries
| US, China, UK, Germany, and Denmark
|
Competitive landscape
| Leading Vendors, Market Positioning of Vendors, Competitive Strategies, and Industry Risks
|
Key companies profiled
| Able UK Ltd., AF Gruppen Norge AS, Aker Solutions ASA, Baker Hughes Co., DeepOcean Group Holding BV, DNV Group AS, Halliburton Co., Heerema International Group, John Wood Group PLC, Oceaneering International Inc., Perenco, Petrofac Ltd., Ramboll Group AS, Royal Boskalis Westminster N.V., SAIPEM SpA, Schlumberger Ltd., Subsea 7 SA, TechnipFMC plc, Weatherford International Plc, and Allseas Group SA
|
Market dynamics
| Parent market analysis, Market growth inducers and obstacles, Fast-growing and slow-growing segment analysis, COVID-19 impact and recovery analysis and future consumer dynamics, Market condition analysis for the forecast period.
|
Customization purview
| If our report has not included the data that you are looking for, you can reach out to our analysts and get segments customized.
|
Table of contents:
1 Executive Summary
- 1.1 Market overview
- Exhibit 01: Executive Summary – Chart on Market Overview
- Exhibit 02: Executive Summary – Data Table on Market Overview
- Exhibit 03: Executive Summary – Chart on Global Market Characteristics
- Exhibit 04: Executive Summary – Chart on Market by Geography
- Exhibit 05: Executive Summary – Chart on Market Segmentation by Type
- Exhibit 06: Executive Summary – Chart on Market Segmentation by Service
- Exhibit 07: Executive Summary – Chart on Incremental Growth
- Exhibit 08: Executive Summary – Data Table on Incremental Growth
- Exhibit 09: Executive Summary – Chart on Vendor Market Positioning
2 Market Landscape
- 2.1 Market ecosystem
- Exhibit 10: Parent market
- Exhibit 11: Market Characteristics
3 Market Sizing
- 3.1 Market definition
- Exhibit 12: Offerings of vendors included in the market definition
- 3.2 Market segment analysis
- Exhibit 13: Market segments
- 3.4 Market outlook: Forecast for 2022-2027
- Exhibit 14: Chart on Global - Market size and forecast 2022-2027 ($ million)
- Exhibit 15: Data Table on Global - Market size and forecast 2022-2027 ($ million)
- Exhibit 16: Chart on Global Market: Year-over-year growth 2022-2027 (%)
- Exhibit 17: Data Table on Global Market: Year-over-year growth 2022-2027 (%)
4 Historic Market Size
- 4.1 Global offshore decommissioning market 2017 - 2021
- Exhibit 18: Historic Market Size – Data Table on Global offshore decommissioning market 2017 - 2021 ($ million)
- 4.2 Type Segment Analysis 2017 - 2021
- Exhibit 19: Historic Market Size – Type Segment 2017 - 2021 ($ million)
- 4.3 Service Segment Analysis 2017 - 2021
- Exhibit 20: Historic Market Size – Service Segment 2017 - 2021 ($ million)
- 4.4 Geography Segment Analysis 2017 - 2021
- Exhibit 21: Historic Market Size – Geography Segment 2017 - 2021 ($ million)
- 4.5 Country Segment Analysis 2017 - 2021
- Exhibit 22: Historic Market Size – Country Segment 2017 - 2021 ($ million)
5 Five Forces Analysis
- 5.1 Five forces summary
- Exhibit 23: Five forces analysis - Comparison between 2022 and 2027
- 5.2 Bargaining power of buyers
- Exhibit 24: Chart on Bargaining power of buyers – Impact of key factors 2022 and 2027
- 5.3 Bargaining power of suppliers
- Exhibit 25: Bargaining power of suppliers – Impact of key factors in 2022 and 2027
- 5.4 Threat of new entrants
- Exhibit 26: Threat of new entrants – Impact of key factors in 2022 and 2027
- 5.5 Threat of substitutes
- Exhibit 27: Threat of substitutes – Impact of key factors in 2022 and 2027
- 5.6 Threat of rivalry
- Exhibit 28: Threat of rivalry – Impact of key factors in 2022 and 2027
- 5.7 Market condition
- Exhibit 29: Chart on Market condition - Five forces 2022 and 2027
6 Market Segmentation by Type
- 6.1 Market segments
- Exhibit 30: Chart on Type - Market share 2022-2027 (%)
- Exhibit 31: Data Table on Type - Market share 2022-2027 (%)
- 6.2 Comparison by Type
- Exhibit 32: Chart on Comparison by Type
- Exhibit 33: Data Table on Comparison by Type
- 6.3 Shallow water - Market size and forecast 2022-2027
- Exhibit 34: Chart on Shallow water - Market size and forecast 2022-2027 ($ million)
- Exhibit 35: Data Table on Shallow water - Market size and forecast 2022-2027 ($ million)
- Exhibit 36: Chart on Shallow water - Year-over-year growth 2022-2027 (%)
- Exhibit 37: Data Table on Shallow water - Year-over-year growth 2022-2027 (%)
- 6.4 Deepwater - Market size and forecast 2022-2027
- Exhibit 38: Chart on Deepwater - Market size and forecast 2022-2027 ($ million)
- Exhibit 39: Data Table on Deepwater - Market size and forecast 2022-2027 ($ million)
- Exhibit 40: Chart on Deepwater - Year-over-year growth 2022-2027 (%)
- Exhibit 41: Data Table on Deepwater - Year-over-year growth 2022-2027 (%)
- 6.5 Market opportunity by Type
- Exhibit 42: Market opportunity by Type ($ million)
7 Market Segmentation by Service
- 7.1 Market segments
- Exhibit 43: Chart on Service - Market share 2022-2027 (%)
- Exhibit 44: Data Table on Service - Market share 2022-2027 (%)
- 7.2 Comparison by Service
- Exhibit 45: Chart on Comparison by Service
- Exhibit 46: Data Table on Comparison by Service
- 7.3 Well plugging and abandonment - Market size and forecast 2022-2027
- Exhibit 47: Chart on Well plugging and abandonment - Market size and forecast 2022-2027 ($ million)
- Exhibit 48: Data Table on Well plugging and abandonment - Market size and forecast 2022-2027 ($ million)
- Exhibit 49: Chart on Well plugging and abandonment - Year-over-year growth 2022-2027 (%)
- Exhibit 50: Data Table on Well plugging and abandonment - Year-over-year growth 2022-2027 (%)
- 7.4 Platform removal - Market size and forecast 2022-2027
- Exhibit 51: Chart on Platform removal - Market size and forecast 2022-2027 ($ million)
- Exhibit 52: Data Table on Platform removal - Market size and forecast 2022-2027 ($ million)
- Exhibit 53: Chart on Platform removal - Year-over-year growth 2022-2027 (%)
- Exhibit 54: Data Table on Platform removal - Year-over-year growth 2022-2027 (%)
- 7.5 Permitting and regulatory compliance - Market size and forecast 2022-2027
- Exhibit 55: Chart on Permitting and regulatory compliance - Market size and forecast 2022-2027 ($ million)
- Exhibit 56: Data Table on Permitting and regulatory compliance - Market size and forecast 2022-2027 ($ million)
- Exhibit 57: Chart on Permitting and regulatory compliance - Year-over-year growth 2022-2027 (%)
- Exhibit 58: Data Table on Permitting and regulatory compliance - Year-over-year growth 2022-2027 (%)
- 7.6 Platform preparation - Market size and forecast 2022-2027
- Exhibit 59: Chart on Platform preparation - Market size and forecast 2022-2027 ($ million)
- Exhibit 60: Data Table on Platform preparation - Market size and forecast 2022-2027 ($ million)
- Exhibit 61: Chart on Platform preparation - Year-over-year growth 2022-2027 (%)
- Exhibit 62: Data Table on Platform preparation - Year-over-year growth 2022-2027 (%)
- 7.7 Others - Market size and forecast 2022-2027
- Exhibit 63: Chart on Others - Market size and forecast 2022-2027 ($ million)
- Exhibit 64: Data Table on Others - Market size and forecast 2022-2027 ($ million)
- Exhibit 65: Chart on Others - Year-over-year growth 2022-2027 (%)
- Exhibit 66: Data Table on Others - Year-over-year growth 2022-2027 (%)
- 7.8 Market opportunity by Service
- Exhibit 67: Market opportunity by Service ($ million)
8 Customer Landscape
- 8.1 Customer landscape overview
- Exhibit 68: Analysis of price sensitivity, lifecycle, customer purchase basket, adoption rates, and purchase criteria
9 Geographic Landscape
- 9.1 Geographic segmentation
- Exhibit 69: Chart on Market share by geography 2022-2027 (%)
- Exhibit 70: Data Table on Market share by geography 2022-2027 (%)
- 9.2 Geographic comparison
- Exhibit 71: Chart on Geographic comparison
- Exhibit 72: Data Table on Geographic comparison
- 9.3 Europe - Market size and forecast 2022-2027
- Exhibit 73: Chart on Europe - Market size and forecast 2022-2027 ($ million)
- Exhibit 74: Data Table on Europe - Market size and forecast 2022-2027 ($ million)
- Exhibit 75: Chart on Europe - Year-over-year growth 2022-2027 (%)
- Exhibit 76: Data Table on Europe - Year-over-year growth 2022-2027 (%)
- 9.4 North America - Market size and forecast 2022-2027
- Exhibit 77: Chart on North America - Market size and forecast 2022-2027 ($ million)
- Exhibit 78: Data Table on North America - Market size and forecast 2022-2027 ($ million)
- Exhibit 79: Chart on North America - Year-over-year growth 2022-2027 (%)
- Exhibit 80: Data Table on North America - Year-over-year growth 2022-2027 (%)
- 9.5 APAC - Market size and forecast 2022-2027
- Exhibit 81: Chart on APAC - Market size and forecast 2022-2027 ($ million)
- Exhibit 82: Data Table on APAC - Market size and forecast 2022-2027 ($ million)
- Exhibit 83: Chart on APAC - Year-over-year growth 2022-2027 (%)
- Exhibit 84: Data Table on APAC - Year-over-year growth 2022-2027 (%)
- 9.6 South America - Market size and forecast 2022-2027
- Exhibit 85: Chart on South America - Market size and forecast 2022-2027 ($ million)
- Exhibit 86: Data Table on South America - Market size and forecast 2022-2027 ($ million)
- Exhibit 87: Chart on South America - Year-over-year growth 2022-2027 (%)
- Exhibit 88: Data Table on South America - Year-over-year growth 2022-2027 (%)
- 9.7 Middle East and Africa - Market size and forecast 2022-2027
- Exhibit 89: Chart on Middle East and Africa - Market size and forecast 2022-2027 ($ million)
- Exhibit 90: Data Table on Middle East and Africa - Market size and forecast 2022-2027 ($ million)
- Exhibit 91: Chart on Middle East and Africa - Year-over-year growth 2022-2027 (%)
- Exhibit 92: Data Table on Middle East and Africa - Year-over-year growth 2022-2027 (%)
- 9.8 US - Market size and forecast 2022-2027
- Exhibit 93: Chart on US - Market size and forecast 2022-2027 ($ million)
- Exhibit 94: Data Table on US - Market size and forecast 2022-2027 ($ million)
- Exhibit 95: Chart on US - Year-over-year growth 2022-2027 (%)
- Exhibit 96: Data Table on US - Year-over-year growth 2022-2027 (%)
- 9.9 UK - Market size and forecast 2022-2027
- Exhibit 97: Chart on UK - Market size and forecast 2022-2027 ($ million)
- Exhibit 98: Data Table on UK - Market size and forecast 2022-2027 ($ million)
- Exhibit 99: Chart on UK - Year-over-year growth 2022-2027 (%)
- Exhibit 100: Data Table on UK - Year-over-year growth 2022-2027 (%)
- 9.10 Germany - Market size and forecast 2022-2027
- Exhibit 101: Chart on Germany - Market size and forecast 2022-2027 ($ million)
- Exhibit 102: Data Table on Germany - Market size and forecast 2022-2027 ($ million)
- Exhibit 103: Chart on Germany - Year-over-year growth 2022-2027 (%)
- Exhibit 104: Data Table on Germany - Year-over-year growth 2022-2027 (%)
- 9.11 Denmark - Market size and forecast 2022-2027
- Exhibit 105: Chart on Denmark - Market size and forecast 2022-2027 ($ million)
- Exhibit 106: Data Table on Denmark - Market size and forecast 2022-2027 ($ million)
- Exhibit 107: Chart on Denmark - Year-over-year growth 2022-2027 (%)
- Exhibit 108: Data Table on Denmark - Year-over-year growth 2022-2027 (%)
- 9.12 China - Market size and forecast 2022-2027
- Exhibit 109: Chart on China - Market size and forecast 2022-2027 ($ million)
- Exhibit 110: Data Table on China - Market size and forecast 2022-2027 ($ million)
- Exhibit 111: Chart on China - Year-over-year growth 2022-2027 (%)
- Exhibit 112: Data Table on China - Year-over-year growth 2022-2027 (%)
- 9.13 Market opportunity by geography
- Exhibit 113: Market opportunity by geography ($ million)
10 Drivers, Challenges, and Trends
- 10.3 Impact of drivers and challenges
- Exhibit 114: Impact of drivers and challenges in 2022 and 2027
11 Vendor Landscape
- 11.2 Vendor landscape
- Exhibit 115: Overview on Criticality of inputs and Factors of differentiation
- 11.3 Landscape disruption
- Exhibit 116: Overview on factors of disruption
- 11.4 Industry risks
- Exhibit 117: Impact of key risks on business
12 Vendor Analysis
- 12.1 Vendors covered
- Exhibit 118: Vendors covered
- 12.2 Market positioning of vendors
- Exhibit 119: Matrix on vendor position and classification
- 12.3 AF Gruppen Norge AS
- Exhibit 120: AF Gruppen Norge AS - Overview
- Exhibit 121: AF Gruppen Norge AS - Business segments
- Exhibit 122: AF Gruppen Norge AS - Key offerings
- Exhibit 123: AF Gruppen Norge AS - Segment focus
- 12.4 Aker Solutions ASA
- Exhibit 124: Aker Solutions ASA - Overview
- Exhibit 125: Aker Solutions ASA - Business segments
- Exhibit 126: Aker Solutions ASA - Key news
- Exhibit 127: Aker Solutions ASA - Key offerings
- Exhibit 128: Aker Solutions ASA - Segment focus
- 12.5 Baker Hughes Co.
- Exhibit 129: Baker Hughes Co. - Overview
- Exhibit 130: Baker Hughes Co. - Business segments
- Exhibit 131: Baker Hughes Co. - Key news
- Exhibit 132: Baker Hughes Co. - Key offerings
- Exhibit 133: Baker Hughes Co. - Segment focus
- 12.6 DeepOcean Group Holding BV
- Exhibit 134: DeepOcean Group Holding BV - Overview
- Exhibit 135: DeepOcean Group Holding BV - Product / Service
- Exhibit 136: DeepOcean Group Holding BV - Key offerings
- 12.7 Halliburton Co.
- Exhibit 137: Halliburton Co. - Overview
- Exhibit 138: Halliburton Co. - Business segments
- Exhibit 139: Halliburton Co. - Key news
- Exhibit 140: Halliburton Co. - Key offerings
- Exhibit 141: Halliburton Co. - Segment focus
- 12.8 Heerema International Group
- Exhibit 142: Heerema International Group - Overview
- Exhibit 143: Heerema International Group - Product / Service
- Exhibit 144: Heerema International Group - Key offerings
- 12.9 John Wood Group PLC
- Exhibit 145: John Wood Group PLC - Overview
- Exhibit 146: John Wood Group PLC - Business segments
- Exhibit 147: John Wood Group PLC - Key offerings
- Exhibit 148: John Wood Group PLC - Segment focus
- 12.10 Oceaneering International Inc.
- Exhibit 149: Oceaneering International Inc. - Overview
- Exhibit 150: Oceaneering International Inc. - Business segments
- Exhibit 151: Oceaneering International Inc. - Key offerings
- Exhibit 152: Oceaneering International Inc. - Segment focus
- 12.11 Petrofac Ltd.
- Exhibit 153: Petrofac Ltd. - Overview
- Exhibit 154: Petrofac Ltd. - Business segments
- Exhibit 155: Petrofac Ltd. - Key offerings
- Exhibit 156: Petrofac Ltd. - Segment focus
- 12.12 Ramboll Group AS
- Exhibit 157: Ramboll Group AS - Overview
- Exhibit 158: Ramboll Group AS - Business segments
- Exhibit 159: Ramboll Group AS - Key offerings
- Exhibit 160: Ramboll Group AS - Segment focus
- 12.13 Royal Boskalis Westminster N.V.
- Exhibit 161: Royal Boskalis Westminster N.V. - Overview
- Exhibit 162: Royal Boskalis Westminster N.V. - Business segments
- Exhibit 163: Royal Boskalis Westminster N.V. - Key offerings
- Exhibit 164: Royal Boskalis Westminster N.V. - Segment focus
- 12.14 Schlumberger Ltd.
- Exhibit 165: Schlumberger Ltd. - Overview
- Exhibit 166: Schlumberger Ltd. - Business segments
- Exhibit 167: Schlumberger Ltd. - Key news
- Exhibit 168: Schlumberger Ltd. - Key offerings
- Exhibit 169: Schlumberger Ltd. - Segment focus
- 12.15 Subsea 7 SA
- Exhibit 170: Subsea 7 SA - Overview
- Exhibit 171: Subsea 7 SA - Business segments
- Exhibit 172: Subsea 7 SA - Key offerings
- Exhibit 173: Subsea 7 SA - Segment focus
- 12.16 TechnipFMC plc
- Exhibit 174: TechnipFMC plc - Overview
- Exhibit 175: TechnipFMC plc - Business segments
- Exhibit 176: TechnipFMC plc - Key news
- Exhibit 177: TechnipFMC plc - Key offerings
- Exhibit 178: TechnipFMC plc - Segment focus
- 12.17 Weatherford International Plc
- Exhibit 179: Weatherford International Plc - Overview
- Exhibit 180: Weatherford International Plc - Business segments
- Exhibit 181: Weatherford International Plc - Key news
- Exhibit 182: Weatherford International Plc - Key offerings
- Exhibit 183: Weatherford International Plc - Segment focus
13 Appendix
- 13.2 Inclusions and exclusions checklist
- Exhibit 184: Inclusions checklist
- Exhibit 185: Exclusions checklist
- 13.3 Currency conversion rates for US$
- Exhibit 186: Currency conversion rates for US$
- 13.4 Research methodology
- Exhibit 187: Research methodology
- Exhibit 188: Validation techniques employed for market sizing
- Exhibit 189: Information sources
- 13.5 List of abbreviations
- Exhibit 190: List of abbreviations
About Us
Technavio is a leading global technology research and advisory company. Their research and analysis focus on emerging market trends and provide actionable insights to help businesses identify market opportunities and develop effective strategies to optimize their market positions. With over 500 specialized analysts, Technavio's report library consists of more than 17,000 reports and counting, covering 800 technologies, spanning across 50 countries. Their client base consists of enterprises of all sizes, including more than 100 Fortune 500 companies. This growing client base relies on Technavio's comprehensive coverage, extensive research, and actionable market insights to identify opportunities in existing and potential markets and assess their competitive positions within changing market scenarios.
Contact
Technavio Research
Jesse Maida
Media & Marketing Executive
US: +1 844 364 1100
UK: +44 203 893 3200
Email: media@technavio.com
Website: www.technavio.com/
View original content to download multimedia:https://www.prnewswire.com/news-releases/offshore-decommissioning-market-size-to-grow-by-usd-2-565-2-million-growth-opportunities-led-by-dnv-group-as-and-able-uk-ltd---technavio-301739152.html
SOURCE Technavio


