Connect with us

Uncategorized

NYU researchers rush to capture human interactions with surfaces likely to carry COVID-19

NYU researchers rush to capture human interactions with surfaces likely to carry COVID-19

Published

on

Team from NYU Tandon School of Engineering and School of Global Health will share information gathered from New York City medical and transit locations with epidemiologists seeking to model the spread of the coronavirus throughout the world

IMAGE

Credit: NYU Tandon: Aidan Falter

BROOKLYN, New York, Wednesday, April 1, 2020 – New York University researchers are in the field capturing highly detailed three-dimensional data on human movements and behaviors — particularly around medical facilities, public transportation systems, and essential services — to document the complex landscape of “surface vectors” and thus opportunities for COVID-19 transmission.

Working under a National Science Foundation Rapid Response Research (RAPID) grant for proposals with severe urgency, the team from the NYU Tandon School of Engineering and the NYU School of Global Health is advancing epidemiological analysis beyond the two-dimensional concept that has been in use since 1854, when John Snow first mapped cholera cases to identify specific contaminated wells as the infection sources of a severe local outbreak in London.

Rapid, repeated documentation and mapping of current conditions around medical and transport facilities will make it possible to investigate the implementation of social distancing regulations and predict patterns of exposure and transmission moving forward, explained the professors. The lead investigator for the project is Debra Laefer, a professor of civil and urban engineering at NYU Tandon who also serves as a professor of urban informatics and director of citizen science at its Center for Urban Science and Progress (CUSP), and the co-leader for the project is Thomas Kirchner, director of the NYU mobile health lab and an assistant professor of social and behavioral sciences at the School of Global Public Health.

This first-of-a-kind study will also lay the groundwork to build machine learning models to speed the analysis of how a virus spreads in urban areas — not just in New York, but across the United States and beyond. For instance, the project is pioneering a new way of thinking and documenting transmission locations. This type of documentation and modeling could easily be applied to airports, grocery stores, and playgrounds — anywhere large groups of people come, touch things, and leave.

“There have been numerous prominent, documented examples of diseases spreading through three dimensions, including Legionnaires’ disease through water systems and avian flu through ventilation passages,” Laefer explained. “Our researchers are personally observing patients and hospital personnel as they exit medical facilities, to see what they touch and where they go. The data we gather will be the basis for generating 3D surface vectors to inform critical new disease transmission models that can radically improve public health decision-making, intervention, and risk communication — which obviously need to be as expeditious and effective as possible, particularly in situations like a global pandemic.”

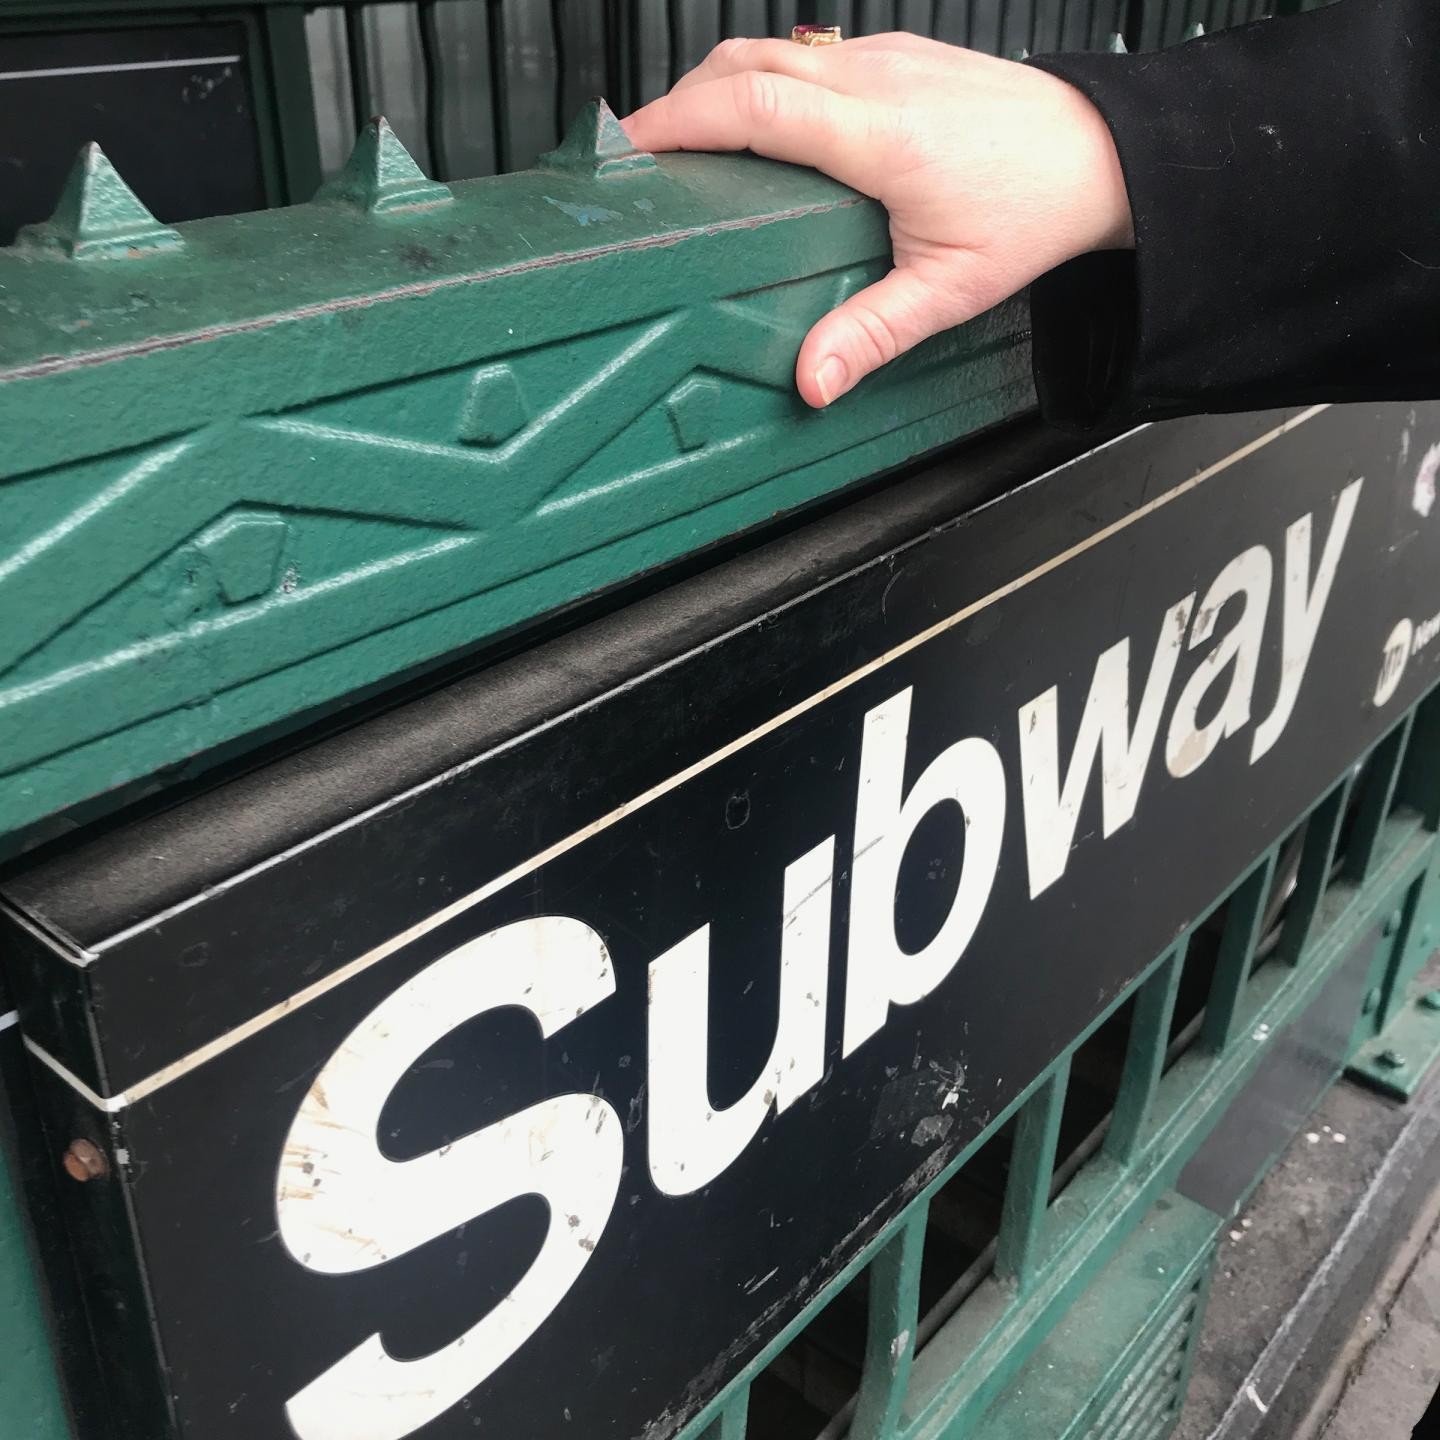
The researchers are compiling 500 hours of individual geo-spatial interactions with the built environment, including the New York City subway system, to pinpoint the probable locations of potential contamination and the likelihood of those locations being points of disease transmission. Such hyper-local data is essential for containing and eradicating COVID-19, as well as future threats. They call the project DETER, for Developing Epidemiology mechanisms in Three-dimensions to Enhance Response.

“We intend to make our data available widely to the community for probabilistic modeling and optimization of municipal containment and mitigation efforts,” said Kirchner. “Thanks to NSF RAPID funding, we will be able to document the implementation of restrictions from New York Governor Andrew Cuomo’s PAUSE executive order and then observe over time any resurgence of the virus after an expected summer lull, as now predicted by both the U.S. military and the World Health Organization.”

About the New York University Tandon School of Engineering

The NYU Tandon School of Engineering dates to 1854, the founding date for both the New York University School of Civil Engineering and Architecture and the Brooklyn Collegiate and Polytechnic Institute (widely known as Brooklyn Poly). A January 2014 merger created a comprehensive school of education and research in engineering and applied sciences, rooted in a tradition of invention and entrepreneurship and dedicated to furthering technology in service to society. In addition to its main location in Brooklyn, NYU Tandon collaborates with other schools within NYU, one of the country’s foremost private research universities, and is closely connected to engineering programs at NYU Abu Dhabi and NYU Shanghai. It operates Future Labs focused on start-up businesses in downtown Manhattan and Brooklyn and an award-winning online graduate program. For more information, visit engineering.nyu.edu.

About the Center for Urban Science and Progress

CUSP is a university-wide center whose research and education programs are focused on urban informatics. Using NYC as its lab, and building from its home in the NYU Tandon School of Engineering, it integrates and applies NYU strengths in the natural, data, and social sciences to understand and improve cities throughout the world. CUSP offers a one-year MS degree in Applied Urban Science & Informatics. For more news and information on CUSP, please visit cusp.nyu.edu.

About the NYU School of Global Public Health

At the NYU School of Global Public Health (NYU GPH), we are preparing the next generation of public health pioneers with the critical thinking skills, acumen, and entrepreneurial approaches necessary to reinvent the public health paradigm. Devoted to employing a nontraditional, interdisciplinary model, NYU GPH aims to improve health worldwide through a unique blend of global public health studies, research, and practice. The School is located in the heart of New York City and extends to NYU’s global network on six continents. Innovation is at the core of our ambitious approach, thinking and teaching. For more, visit: publichealth.nyu.edu.

Media Contact
Kathleen Hamilton
kathleen.hamilton@nyu.edu

Original Source

https://engineering.nyu.edu/news/nyu-researchers-rush-capture-human-interactions-3d-data-surfaces-likely-carry-covid-19

Read More

Continue Reading

Uncategorized

Aging at AACR Annual Meeting 2024

BUFFALO, NY- March 11, 2024 – Impact Journals publishes scholarly journals in the biomedical sciences with a focus on all areas of cancer and aging…

Published

on

BUFFALO, NY- March 11, 2024 – Impact Journals publishes scholarly journals in the biomedical sciences with a focus on all areas of cancer and aging research. Aging is one of the most prominent journals published by Impact Journals

Credit: Impact Journals

BUFFALO, NY- March 11, 2024 – Impact Journals publishes scholarly journals in the biomedical sciences with a focus on all areas of cancer and aging research. Aging is one of the most prominent journals published by Impact Journals

Impact Journals will be participating as an exhibitor at the American Association for Cancer Research (AACR) Annual Meeting 2024 from April 5-10 at the San Diego Convention Center in San Diego, California. This year, the AACR meeting theme is “Inspiring Science • Fueling Progress • Revolutionizing Care.”

Visit booth #4159 at the AACR Annual Meeting 2024 to connect with members of the Aging team.

About Aging-US:

Aging publishes research papers in all fields of aging research including but not limited, aging from yeast to mammals, cellular senescence, age-related diseases such as cancer and Alzheimer’s diseases and their prevention and treatment, anti-aging strategies and drug development and especially the role of signal transduction pathways such as mTOR in aging and potential approaches to modulate these signaling pathways to extend lifespan. The journal aims to promote treatment of age-related diseases by slowing down aging, validation of anti-aging drugs by treating age-related diseases, prevention of cancer by inhibiting aging. Cancer and COVID-19 are age-related diseases.

Aging is indexed and archived by PubMed/Medline (abbreviated as “Aging (Albany NY)”), PubMed CentralWeb of Science: Science Citation Index Expanded (abbreviated as “Aging‐US” and listed in the Cell Biology and Geriatrics & Gerontology categories), Scopus (abbreviated as “Aging” and listed in the Cell Biology and Aging categories), Biological Abstracts, BIOSIS Previews, EMBASE, META (Chan Zuckerberg Initiative) (2018-2022), and Dimensions (Digital Science).

Please visit our website at www.Aging-US.com​​ and connect with us:

  • Aging X
  • Aging Facebook
  • Aging Instagram
  • Aging YouTube
  • Aging LinkedIn
  • Aging SoundCloud
  • Aging Pinterest
  • Aging Reddit

Click here to subscribe to Aging publication updates.

For media inquiries, please contact media@impactjournals.com.


Read More

Continue Reading

Uncategorized

NY Fed Finds Medium, Long-Term Inflation Expectations Jump Amid Surge In Stock Market Optimism

NY Fed Finds Medium, Long-Term Inflation Expectations Jump Amid Surge In Stock Market Optimism

One month after the inflation outlook tracked…

Published

on

NY Fed Finds Medium, Long-Term Inflation Expectations Jump Amid Surge In Stock Market Optimism

One month after the inflation outlook tracked by the NY Fed Consumer Survey extended their late 2023 slide, with 3Y inflation expectations in January sliding to a record low 2.4% (from 2.6% in December), even as 1 and 5Y inflation forecasts remained flat, moments ago the NY Fed reported that in February there was a sharp rebound in longer-term inflation expectations, rising to 2.7% from 2.4% at the three-year ahead horizon, and jumping to 2.9% from 2.5% at the five-year ahead horizon, while the 1Y inflation outlook was flat for the 3rd month in a row, stuck at 3.0%. 

The increases in both the three-year ahead and five-year ahead measures were most pronounced for respondents with at most high school degrees (in other words, the "really smart folks" are expecting deflation soon). The survey’s measure of disagreement across respondents (the difference between the 75th and 25th percentile of inflation expectations) decreased at all horizons, while the median inflation uncertainty—or the uncertainty expressed regarding future inflation outcomes—declined at the one- and three-year ahead horizons and remained unchanged at the five-year ahead horizon.

Going down the survey, we find that the median year-ahead expected price changes increased by 0.1 percentage point to 4.3% for gas; decreased by 1.8 percentage points to 6.8% for the cost of medical care (its lowest reading since September 2020); decreased by 0.1 percentage point to 5.8% for the cost of a college education; and surprisingly decreased by 0.3 percentage point for rent to 6.1% (its lowest reading since December 2020), and remained flat for food at 4.9%.

We find the rent expectations surprising because it is happening just asking rents are rising across the country.

At the same time as consumers erroneously saw sharply lower rents, median home price growth expectations remained unchanged for the fifth consecutive month at 3.0%.

Turning to the labor market, the survey found that the average perceived likelihood of voluntary and involuntary job separations increased, while the perceived likelihood of finding a job (in the event of a job loss) declined. "The mean probability of leaving one’s job voluntarily in the next 12 months also increased, by 1.8 percentage points to 19.5%."

Mean unemployment expectations - or the mean probability that the U.S. unemployment rate will be higher one year from now - decreased by 1.1 percentage points to 36.1%, the lowest reading since February 2022. Additionally, the median one-year-ahead expected earnings growth was unchanged at 2.8%, remaining slightly below its 12-month trailing average of 2.9%.

Turning to household finance, we find the following:

  • The median expected growth in household income remained unchanged at 3.1%. The series has been moving within a narrow range of 2.9% to 3.3% since January 2023, and remains above the February 2020 pre-pandemic level of 2.7%.
  • Median household spending growth expectations increased by 0.2 percentage point to 5.2%. The increase was driven by respondents with a high school degree or less.
  • Median year-ahead expected growth in government debt increased to 9.3% from 8.9%.
  • The mean perceived probability that the average interest rate on saving accounts will be higher in 12 months increased by 0.6 percentage point to 26.1%, remaining below its 12-month trailing average of 30%.
  • Perceptions about households’ current financial situations deteriorated somewhat with fewer respondents reporting being better off than a year ago. Year-ahead expectations also deteriorated marginally with a smaller share of respondents expecting to be better off and a slightly larger share of respondents expecting to be worse off a year from now.
  • The mean perceived probability that U.S. stock prices will be higher 12 months from now increased by 1.4 percentage point to 38.9%.
  • At the same time, perceptions and expectations about credit access turned less optimistic: "Perceptions of credit access compared to a year ago deteriorated with a larger share of respondents reporting tighter conditions and a smaller share reporting looser conditions compared to a year ago."

Also, a smaller percentage of consumers, 11.45% vs 12.14% in prior month, expect to not be able to make minimum debt payment over the next three months

Last, and perhaps most humorous, is the now traditional cognitive dissonance one observes with these polls, because at a time when long-term inflation expectations jumped, which clearly suggests that financial conditions will need to be tightened, the number of respondents expecting higher stock prices one year from today jumped to the highest since November 2021... which incidentally is just when the market topped out during the last cycle before suffering a painful bear market.

Tyler Durden Mon, 03/11/2024 - 12:40

Read More

Continue Reading

Uncategorized

Homes listed for sale in early June sell for $7,700 more

New Zillow research suggests the spring home shopping season may see a second wave this summer if mortgage rates fall
The post Homes listed for sale in…

Published

on

  • A Zillow analysis of 2023 home sales finds homes listed in the first two weeks of June sold for 2.3% more. 
  • The best time to list a home for sale is a month later than it was in 2019, likely driven by mortgage rates.
  • The best time to list can be as early as the second half of February in San Francisco, and as late as the first half of July in New York and Philadelphia. 

Spring home sellers looking to maximize their sale price may want to wait it out and list their home for sale in the first half of June. A new Zillow® analysis of 2023 sales found that homes listed in the first two weeks of June sold for 2.3% more, a $7,700 boost on a typical U.S. home.  

The best time to list consistently had been early May in the years leading up to the pandemic. The shift to June suggests mortgage rates are strongly influencing demand on top of the usual seasonality that brings buyers to the market in the spring. This home-shopping season is poised to follow a similar pattern as that in 2023, with the potential for a second wave if the Federal Reserve lowers interest rates midyear or later. 

The 2.3% sale price premium registered last June followed the first spring in more than 15 years with mortgage rates over 6% on a 30-year fixed-rate loan. The high rates put home buyers on the back foot, and as rates continued upward through May, they were still reassessing and less likely to bid boldly. In June, however, rates pulled back a little from 6.79% to 6.67%, which likely presented an opportunity for determined buyers heading into summer. More buyers understood their market position and could afford to transact, boosting competition and sale prices.

The old logic was that sellers could earn a premium by listing in late spring, when search activity hit its peak. Now, with persistently low inventory, mortgage rate fluctuations make their own seasonality. First-time home buyers who are on the edge of qualifying for a home loan may dip in and out of the market, depending on what’s happening with rates. It is almost certain the Federal Reserve will push back any interest-rate cuts to mid-2024 at the earliest. If mortgage rates follow, that could bring another surge of buyers later this year.

Mortgage rates have been impacting affordability and sale prices since they began rising rapidly two years ago. In 2022, sellers nationwide saw the highest sale premium when they listed their home in late March, right before rates barreled past 5% and continued climbing. 

Zillow’s research finds the best time to list can vary widely by metropolitan area. In 2023, it was as early as the second half of February in San Francisco, and as late as the first half of July in New York. Thirty of the top 35 largest metro areas saw for-sale listings command the highest sale prices between May and early July last year. 

Zillow also found a wide range in the sale price premiums associated with homes listed during those peak periods. At the hottest time of the year in San Jose, homes sold for 5.5% more, a $88,000 boost on a typical home. Meanwhile, homes in San Antonio sold for 1.9% more during that same time period.  


Metropolitan Area Best Time to List Price Premium Dollar Boost
United States First half of June 2.3% $7,700
New York, NY First half of July 2.4% $15,500
Los Angeles, CA First half of May 4.1% $39,300
Chicago, IL First half of June 2.8% $8,800
Dallas, TX First half of June 2.5% $9,200
Houston, TX Second half of April 2.0% $6,200
Washington, DC Second half of June 2.2% $12,700
Philadelphia, PA First half of July 2.4% $8,200
Miami, FL First half of June 2.3% $12,900
Atlanta, GA Second half of June 2.3% $8,700
Boston, MA Second half of May 3.5% $23,600
Phoenix, AZ First half of June 3.2% $14,700
San Francisco, CA Second half of February 4.2% $50,300
Riverside, CA First half of May 2.7% $15,600
Detroit, MI First half of July 3.3% $7,900
Seattle, WA First half of June 4.3% $31,500
Minneapolis, MN Second half of May 3.7% $13,400
San Diego, CA Second half of April 3.1% $29,600
Tampa, FL Second half of June 2.1% $8,000
Denver, CO Second half of May 2.9% $16,900
Baltimore, MD First half of July 2.2% $8,200
St. Louis, MO First half of June 2.9% $7,000
Orlando, FL First half of June 2.2% $8,700
Charlotte, NC Second half of May 3.0% $11,000
San Antonio, TX First half of June 1.9% $5,400
Portland, OR Second half of April 2.6% $14,300
Sacramento, CA First half of June 3.2% $17,900
Pittsburgh, PA Second half of June 2.3% $4,700
Cincinnati, OH Second half of April 2.7% $7,500
Austin, TX Second half of May 2.8% $12,600
Las Vegas, NV First half of June 3.4% $14,600
Kansas City, MO Second half of May 2.5% $7,300
Columbus, OH Second half of June 3.3% $10,400
Indianapolis, IN First half of July 3.0% $8,100
Cleveland, OH First half of July  3.4% $7,400
San Jose, CA First half of June 5.5% $88,400


The post Homes listed for sale in early June sell for $7,700 more appeared first on Zillow Research.

Read More

Continue Reading

Trending