Connect with us

Uncategorized

nTIDE October 2022 Jobs Report: Strong labor market for people with disabilities – here to stay?

East Hanover, NJ – November 4, 2022 – Employment remains at historic highs for people with disabilities, but whether these gains will persist is a…

Published

on

East Hanover, NJ – November 4, 2022 – Employment remains at historic highs for people with disabilities, but whether these gains will persist is a topic of today’s National Trends in Disability Employment – Monthly Update (nTIDE), issued by Kessler Foundation and the University of New Hampshire’s Institute on Disability (UNH-IOD). The COVID-19 pandemic prompted a marked increase in flexible business practices that benefit workers with disabilities, and a new survey indicates that many of these changes are likely to be here to stay.

Credit: Kessler Foundation

East Hanover, NJ – November 4, 2022 – Employment remains at historic highs for people with disabilities, but whether these gains will persist is a topic of today’s National Trends in Disability Employment – Monthly Update (nTIDE), issued by Kessler Foundation and the University of New Hampshire’s Institute on Disability (UNH-IOD). The COVID-19 pandemic prompted a marked increase in flexible business practices that benefit workers with disabilities, and a new survey indicates that many of these changes are likely to be here to stay.

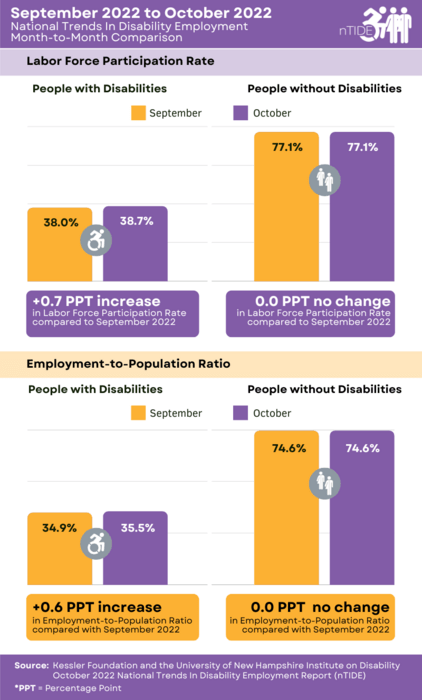
Month-to-Month nTIDE Numbers (comparing September 2022 to October 2022)

Based on data from the U.S. Bureau of Labor Statistics (BLS) Jobs Report released today, the employment-to-population ratio for people with disabilities (ages 16-64) increased from 34.9 percent in September to 35.5 percent in October (up 1.7 percent or 0.6 percentage points). For people without disabilities (ages 16-64), the employment-to-population ratio remained the same at 74.6 percent in September and October. The employment-to-population ratio, a key indicator, reflects the percentage of people who are working relative to the total population (the number of people working divided by the number of people in the total population multiplied by 100).

“The employment-to-population ratio for people with disabilities not only increased but remains steadily above historic highs. This contrasts with the lag we have seen for their counterparts without disabilities, whose ratio is just reaching its pre-pandemic levels,” said John O’Neill, PhD, director of the Center for Employment and Disability Research at Kessler Foundation. “Efforts to combat inflation continue, however, with this week’s major rate hike the latest in a series by the Federal Reserve,” he cautioned. “While these moves may dampen the future labor market, there are other positive factors for people with disabilities who are striving to work.”

Findings were similar for October’s labor force participation rate. For people with disabilities (ages 16-64), the labor force participation rate increased from 38.0 percent in September to 38.7 percent in October (up 1.8 percent or 0.7 percentage points). For people without disabilities (ages 16-64), the labor force participation rate remained the same, 77.1 percent in September and October. The labor force participation rate is the percentage of the population that is working, not working, and on temporary layoff, or not working and actively looking for work.

“The employment gains we’re seeing among people with disabilities are very encouraging,” remarked Andrew Houtenville, PhD, professor of economics and the research director of the UNH-IOD. “These may lead to long-term improvements in the workplace integration of people with disabilities,” explained Dr. Houtenville. “From our latest employment and disability survey, we’ve seen that supervisors indicate these positive changes are here to stay.”

Read more about the 2022 National Employment & Disability Survey: Effects of COVID-19 Pandemic Supervisor Perspectives. This new survey compares the workplaces of 2017 and 2022, revealing gains in recruiting, hiring, accommodating, and retaining employees with disabilities

Year-to-Year nTIDE Numbers (Comparing October 2021 to October 2022)

The employment-to-population ratio for working-age people with disabilities (ages 16-64) increased from 33.2 percent in October 2021, to 35.5 percent in October 2022 (up 6.9 percent or 2.3 percentage points). For working-age people without disabilities (ages 16-64), the employment-to-population ratio also increased from 73.5 percent in October 2021 to 74.6 percent in October 2022 (up 1.5 percent or 1.1 percentage points).

Similarly, for people with disabilities (ages 16-64), the labor force participation rate increased from 36.8 percent in October 2021 to 38.7 percent in October 2022 (up 5.2 percent or 1.9 percentage points). For people without disabilities (ages 16-64), the labor force participation rate also increased from 76.6 percent in October 2021 to 77.1 percent in October 2022 (up 0.7 percent or 0.5 percentage points).

In October 2022 among workers ages 16-64, the 5,883,000 workers with disabilities represented 4.0 percent of the total 148,031,000 workers in the U.S.

Ask Questions about Disability and Employment

Each nTIDE release is followed by an nTIDE Lunch & Learn online webinar. This live broadcast, hosted via Zoom Webinar, offers attendees Q&A on the latest nTIDE findings, provides news and updates from the field, as well as invited panelists to discuss current disability-related findings and events. On November 4, 2022 at 12:00 pm Eastern, Jhillika Kumar, founder and CEO of Mentra, the world’s largest neurodiversity employment network, joins Drs. Houtenville and O’Neill, and Denise Rozell, Policy Strategist at Association of University Centers on Disabilities (AUCD). Join our Lunch & Learns live or visit the nTIDE archives at: ResearchonDisability.org/nTIDE.

NOTE: The statistics in the nTIDE are based on Bureau of Labor Statistics numbers but are not identical. They are customized by UNH to combine the statistics for men and women of working age (16 to 64). nTIDE is funded, in part, by grants from the National Institute on Disability, Independent Living and Rehabilitation Research (NIDILRR) (90RT5037) and Kessler Foundation.

About the Institute on Disability at the University of New Hampshire

The Institute on Disability (IOD) at the University of New Hampshire (UNH) was established in 1987 to provide a university-based focus for the improvement of knowledge, policies, and practices related to the lives of persons with disabilities and their families. For information on the NIDILRR-funded Research and Training Center on Disability Statistics, visit ResearchOnDisability.org.

About Kessler Foundation

Kessler Foundation, a major nonprofit organization in the field of disability, is a global leader in rehabilitation research that seeks to improve cognition, mobility, and long-term outcomes – including employment – for people with neurological disabilities caused by diseases and injuries of the brain and spinal cord. Kessler Foundation leads the nation in funding innovative programs that expand opportunities for employment for people with disabilities. For more information, visit KesslerFoundation.org.

Stay Connected with Kessler Foundation

Twitter | Facebook | YouTube | Instagram | iTunes & SoundCloud

To interview an expert, contact:

Deborah Hauss, DHauss@kesslerfoundation.org;

Carolann Murphy, CMurphy@KesslerFoundation.org.


Read More

Continue Reading

Uncategorized

Aging at AACR Annual Meeting 2024

BUFFALO, NY- March 11, 2024 – Impact Journals publishes scholarly journals in the biomedical sciences with a focus on all areas of cancer and aging…

Published

on

BUFFALO, NY- March 11, 2024 – Impact Journals publishes scholarly journals in the biomedical sciences with a focus on all areas of cancer and aging research. Aging is one of the most prominent journals published by Impact Journals

Credit: Impact Journals

BUFFALO, NY- March 11, 2024 – Impact Journals publishes scholarly journals in the biomedical sciences with a focus on all areas of cancer and aging research. Aging is one of the most prominent journals published by Impact Journals

Impact Journals will be participating as an exhibitor at the American Association for Cancer Research (AACR) Annual Meeting 2024 from April 5-10 at the San Diego Convention Center in San Diego, California. This year, the AACR meeting theme is “Inspiring Science • Fueling Progress • Revolutionizing Care.”

Visit booth #4159 at the AACR Annual Meeting 2024 to connect with members of the Aging team.

About Aging-US:

Aging publishes research papers in all fields of aging research including but not limited, aging from yeast to mammals, cellular senescence, age-related diseases such as cancer and Alzheimer’s diseases and their prevention and treatment, anti-aging strategies and drug development and especially the role of signal transduction pathways such as mTOR in aging and potential approaches to modulate these signaling pathways to extend lifespan. The journal aims to promote treatment of age-related diseases by slowing down aging, validation of anti-aging drugs by treating age-related diseases, prevention of cancer by inhibiting aging. Cancer and COVID-19 are age-related diseases.

Aging is indexed and archived by PubMed/Medline (abbreviated as “Aging (Albany NY)”), PubMed CentralWeb of Science: Science Citation Index Expanded (abbreviated as “Aging‐US” and listed in the Cell Biology and Geriatrics & Gerontology categories), Scopus (abbreviated as “Aging” and listed in the Cell Biology and Aging categories), Biological Abstracts, BIOSIS Previews, EMBASE, META (Chan Zuckerberg Initiative) (2018-2022), and Dimensions (Digital Science).

Please visit our website at www.Aging-US.com​​ and connect with us:

  • Aging X
  • Aging Facebook
  • Aging Instagram
  • Aging YouTube
  • Aging LinkedIn
  • Aging SoundCloud
  • Aging Pinterest
  • Aging Reddit

Click here to subscribe to Aging publication updates.

For media inquiries, please contact media@impactjournals.com.


Read More

Continue Reading

Uncategorized

NY Fed Finds Medium, Long-Term Inflation Expectations Jump Amid Surge In Stock Market Optimism

NY Fed Finds Medium, Long-Term Inflation Expectations Jump Amid Surge In Stock Market Optimism

One month after the inflation outlook tracked…

Published

on

NY Fed Finds Medium, Long-Term Inflation Expectations Jump Amid Surge In Stock Market Optimism

One month after the inflation outlook tracked by the NY Fed Consumer Survey extended their late 2023 slide, with 3Y inflation expectations in January sliding to a record low 2.4% (from 2.6% in December), even as 1 and 5Y inflation forecasts remained flat, moments ago the NY Fed reported that in February there was a sharp rebound in longer-term inflation expectations, rising to 2.7% from 2.4% at the three-year ahead horizon, and jumping to 2.9% from 2.5% at the five-year ahead horizon, while the 1Y inflation outlook was flat for the 3rd month in a row, stuck at 3.0%. 

The increases in both the three-year ahead and five-year ahead measures were most pronounced for respondents with at most high school degrees (in other words, the "really smart folks" are expecting deflation soon). The survey’s measure of disagreement across respondents (the difference between the 75th and 25th percentile of inflation expectations) decreased at all horizons, while the median inflation uncertainty—or the uncertainty expressed regarding future inflation outcomes—declined at the one- and three-year ahead horizons and remained unchanged at the five-year ahead horizon.

Going down the survey, we find that the median year-ahead expected price changes increased by 0.1 percentage point to 4.3% for gas; decreased by 1.8 percentage points to 6.8% for the cost of medical care (its lowest reading since September 2020); decreased by 0.1 percentage point to 5.8% for the cost of a college education; and surprisingly decreased by 0.3 percentage point for rent to 6.1% (its lowest reading since December 2020), and remained flat for food at 4.9%.

We find the rent expectations surprising because it is happening just asking rents are rising across the country.

At the same time as consumers erroneously saw sharply lower rents, median home price growth expectations remained unchanged for the fifth consecutive month at 3.0%.

Turning to the labor market, the survey found that the average perceived likelihood of voluntary and involuntary job separations increased, while the perceived likelihood of finding a job (in the event of a job loss) declined. "The mean probability of leaving one’s job voluntarily in the next 12 months also increased, by 1.8 percentage points to 19.5%."

Mean unemployment expectations - or the mean probability that the U.S. unemployment rate will be higher one year from now - decreased by 1.1 percentage points to 36.1%, the lowest reading since February 2022. Additionally, the median one-year-ahead expected earnings growth was unchanged at 2.8%, remaining slightly below its 12-month trailing average of 2.9%.

Turning to household finance, we find the following:

  • The median expected growth in household income remained unchanged at 3.1%. The series has been moving within a narrow range of 2.9% to 3.3% since January 2023, and remains above the February 2020 pre-pandemic level of 2.7%.
  • Median household spending growth expectations increased by 0.2 percentage point to 5.2%. The increase was driven by respondents with a high school degree or less.
  • Median year-ahead expected growth in government debt increased to 9.3% from 8.9%.
  • The mean perceived probability that the average interest rate on saving accounts will be higher in 12 months increased by 0.6 percentage point to 26.1%, remaining below its 12-month trailing average of 30%.
  • Perceptions about households’ current financial situations deteriorated somewhat with fewer respondents reporting being better off than a year ago. Year-ahead expectations also deteriorated marginally with a smaller share of respondents expecting to be better off and a slightly larger share of respondents expecting to be worse off a year from now.
  • The mean perceived probability that U.S. stock prices will be higher 12 months from now increased by 1.4 percentage point to 38.9%.
  • At the same time, perceptions and expectations about credit access turned less optimistic: "Perceptions of credit access compared to a year ago deteriorated with a larger share of respondents reporting tighter conditions and a smaller share reporting looser conditions compared to a year ago."

Also, a smaller percentage of consumers, 11.45% vs 12.14% in prior month, expect to not be able to make minimum debt payment over the next three months

Last, and perhaps most humorous, is the now traditional cognitive dissonance one observes with these polls, because at a time when long-term inflation expectations jumped, which clearly suggests that financial conditions will need to be tightened, the number of respondents expecting higher stock prices one year from today jumped to the highest since November 2021... which incidentally is just when the market topped out during the last cycle before suffering a painful bear market.

Tyler Durden Mon, 03/11/2024 - 12:40

Read More

Continue Reading

Uncategorized

Homes listed for sale in early June sell for $7,700 more

New Zillow research suggests the spring home shopping season may see a second wave this summer if mortgage rates fall
The post Homes listed for sale in…

Published

on

  • A Zillow analysis of 2023 home sales finds homes listed in the first two weeks of June sold for 2.3% more. 
  • The best time to list a home for sale is a month later than it was in 2019, likely driven by mortgage rates.
  • The best time to list can be as early as the second half of February in San Francisco, and as late as the first half of July in New York and Philadelphia. 

Spring home sellers looking to maximize their sale price may want to wait it out and list their home for sale in the first half of June. A new Zillow® analysis of 2023 sales found that homes listed in the first two weeks of June sold for 2.3% more, a $7,700 boost on a typical U.S. home.  

The best time to list consistently had been early May in the years leading up to the pandemic. The shift to June suggests mortgage rates are strongly influencing demand on top of the usual seasonality that brings buyers to the market in the spring. This home-shopping season is poised to follow a similar pattern as that in 2023, with the potential for a second wave if the Federal Reserve lowers interest rates midyear or later. 

The 2.3% sale price premium registered last June followed the first spring in more than 15 years with mortgage rates over 6% on a 30-year fixed-rate loan. The high rates put home buyers on the back foot, and as rates continued upward through May, they were still reassessing and less likely to bid boldly. In June, however, rates pulled back a little from 6.79% to 6.67%, which likely presented an opportunity for determined buyers heading into summer. More buyers understood their market position and could afford to transact, boosting competition and sale prices.

The old logic was that sellers could earn a premium by listing in late spring, when search activity hit its peak. Now, with persistently low inventory, mortgage rate fluctuations make their own seasonality. First-time home buyers who are on the edge of qualifying for a home loan may dip in and out of the market, depending on what’s happening with rates. It is almost certain the Federal Reserve will push back any interest-rate cuts to mid-2024 at the earliest. If mortgage rates follow, that could bring another surge of buyers later this year.

Mortgage rates have been impacting affordability and sale prices since they began rising rapidly two years ago. In 2022, sellers nationwide saw the highest sale premium when they listed their home in late March, right before rates barreled past 5% and continued climbing. 

Zillow’s research finds the best time to list can vary widely by metropolitan area. In 2023, it was as early as the second half of February in San Francisco, and as late as the first half of July in New York. Thirty of the top 35 largest metro areas saw for-sale listings command the highest sale prices between May and early July last year. 

Zillow also found a wide range in the sale price premiums associated with homes listed during those peak periods. At the hottest time of the year in San Jose, homes sold for 5.5% more, a $88,000 boost on a typical home. Meanwhile, homes in San Antonio sold for 1.9% more during that same time period.  


Metropolitan Area Best Time to List Price Premium Dollar Boost
United States First half of June 2.3% $7,700
New York, NY First half of July 2.4% $15,500
Los Angeles, CA First half of May 4.1% $39,300
Chicago, IL First half of June 2.8% $8,800
Dallas, TX First half of June 2.5% $9,200
Houston, TX Second half of April 2.0% $6,200
Washington, DC Second half of June 2.2% $12,700
Philadelphia, PA First half of July 2.4% $8,200
Miami, FL First half of June 2.3% $12,900
Atlanta, GA Second half of June 2.3% $8,700
Boston, MA Second half of May 3.5% $23,600
Phoenix, AZ First half of June 3.2% $14,700
San Francisco, CA Second half of February 4.2% $50,300
Riverside, CA First half of May 2.7% $15,600
Detroit, MI First half of July 3.3% $7,900
Seattle, WA First half of June 4.3% $31,500
Minneapolis, MN Second half of May 3.7% $13,400
San Diego, CA Second half of April 3.1% $29,600
Tampa, FL Second half of June 2.1% $8,000
Denver, CO Second half of May 2.9% $16,900
Baltimore, MD First half of July 2.2% $8,200
St. Louis, MO First half of June 2.9% $7,000
Orlando, FL First half of June 2.2% $8,700
Charlotte, NC Second half of May 3.0% $11,000
San Antonio, TX First half of June 1.9% $5,400
Portland, OR Second half of April 2.6% $14,300
Sacramento, CA First half of June 3.2% $17,900
Pittsburgh, PA Second half of June 2.3% $4,700
Cincinnati, OH Second half of April 2.7% $7,500
Austin, TX Second half of May 2.8% $12,600
Las Vegas, NV First half of June 3.4% $14,600
Kansas City, MO Second half of May 2.5% $7,300
Columbus, OH Second half of June 3.3% $10,400
Indianapolis, IN First half of July 3.0% $8,100
Cleveland, OH First half of July  3.4% $7,400
San Jose, CA First half of June 5.5% $88,400


The post Homes listed for sale in early June sell for $7,700 more appeared first on Zillow Research.

Read More

Continue Reading

Trending