
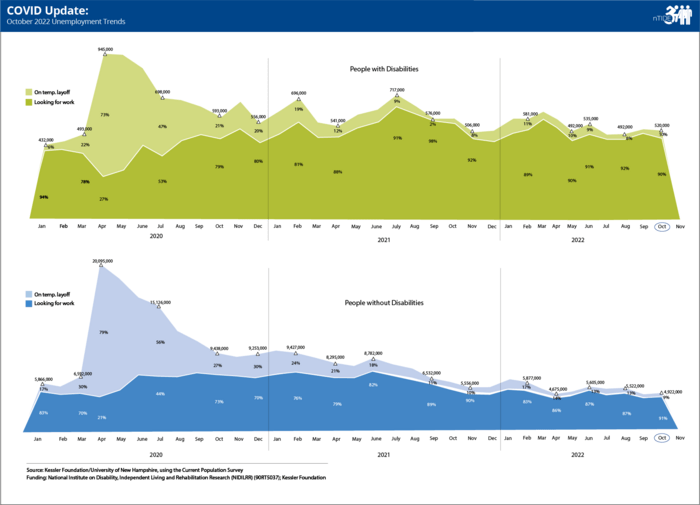
East Hanover, NJ. November 18, 2022. There was little change in unemployment in October for people with and without disabilities, according to today’s National Trends in Disability Employment (nTIDE) COVID Update. The overall jobs picture remained steady, as reported in the nTIDE October Job Report released earlier this month.
“In our November 4 nTIDE, we reported the ongoing strength of the labor market for people with disabilities, but questioned how long this would last given the current economic climate,” said Andrew Houtenville, PhD, professor of economics at the University of Hampshire (UNH) and research director of the UNH Institute on Disability. “Looking closely at the unemployment graphics today, we see very small increases in furloughs for both people with and without disabilities. While these changes are slight, they are noteworthy in the context of the ongoing efforts of the Federal Reserve to control inflation.”
“We are seeing the beginnings of major layoffs in the tech sector, which could be a sign of more to come if recession continues to remain a concern,” Dr. Houtenville added, referring to news from large companies such as Meta and Twitter. “This could be an early sign of an impact on unemployment, especially if we start to see layoffs in other sectors,” he said.
Field Notes − News from Job Path NYC
As economic recovery continues in New York City, businesses are adapting to the effects of the pandemic on the workplace. While workers with disabilities are being welcomed back to their jobs, the nature of many positions is changing, according to nTIDE co-author John O’Neill, PhD, director of the Center for Employment and Disability Employment Research at Kessler Foundation. Dr. O’Neill also serves on the board of Job Path NYC, a nonprofit that provides customized employment services for people with intellectual and developmental disabilities.
“As offices reopen, the boom in pandemic-related jobs has declined. The need for extra cleaning services has evaporated, for example, as well as the need for COVID screening services. Today, many offices are transitioning to hybrid work, so employers and job developers are adapting customized positions to accommodate this new model,” he explained. “Other job settings are also adapting their position requirements, which means new niches for customized employment, but requires more time to set up the supports for returning workers.”
Plans for Deeper Dive in 2023
Monitoring the National Trends in Disability Employment helps us track the impact of economic shifts on people with disabilities. As the impact of the COVID-19 pandemic continues to wane, the impact of inflation continues to rise. In 2023, the nTIDE team plans to transition the COVID Update to a ‘deeper dive’ into the Bureau of Labor Statistics data for people with disabilities.
Register now for our upcoming nTIDE webinars scheduled for December 2, 2022, and January 6, 2023: nTIDE Lunch & Learn Webinar Series | Center for Research on Disability .
Note: The December 23, 2022, webinar has been cancelled.
ICYMI: Learn about the new survey produced by the nTIDE team, the 2022 Kessler Foundation National Employment & Disability Survey: Effects of COVID-19 Pandemic on Supervisor Perspectives
About nTIDE Updates
National Trends in Disability Employment (nTIDE), is a joint project of Kessler Foundation and the University of New Hampshire (UNH) Institute on Disability, co-authored by Andrew Houtenville, PhD, from the UNH Institute on Disability and John O’Neill, PhD, of Kessler Foundation. The nTIDE team closely monitors the job numbers, issuing semi-monthly nTIDE reports, as the labor market continues to reflect the many challenges of the pandemic. Since 2013, a monthly nTIDE has been issued in conjunction with the first Friday Jobs Report issued by the Bureau of Labor Statistics. In April 2020, restrictions on economic activity in the U.S. due to the COVID-19 pandemic precipitated an unprecedented rise in furloughs and people looking for work, prompting the addition of this mid-month nTIDE COVID Update. The mid-month nTIDE follows two key unemployment indicators – furloughs, or temporary layoffs, and the number of people looking for work, comparing trends for people with and without disabilities.
Funding: Kessler Foundation and the National Institute on Disability, Independent Living and Rehabilitation Research (NIDILRR) (90RT5037).
About the Institute on Disability at the University of New Hampshire
The Institute on Disability (IOD) at the University of New Hampshire (UNH) was established in 1987 to provide a coherent university-based focus for the improvement of knowledge, policies, and practices related to the lives of persons with disabilities and their families. For information on the NIDILRR-funded Employment Policy and Measurement Rehabilitation Research and Training Center, visit ResearchonDisability.org.
About Kessler Foundation
Kessler Foundation, a major nonprofit organization in the field of disability, is a global leader in rehabilitation research that seeks to improve cognition, mobility, and long-term outcomes – including employment – for people with neurological disabilities caused by diseases and injuries of the brain and spinal cord. Kessler Foundation leads the nation in funding innovative programs that expand opportunities for employment for people with disabilities. For more information, visit KesslerFoundation.org.
Twitter | Facebook | YouTube | Instagram | iTunes & SoundCloud
Interested in interviewing an expert on nTIDE or our new survey? Contact Deb Hauss: Dhauss@kesslerfoundation.org; Carolann Murphy: cmurphy@kesslerfoundation.org


