Fifteen years after the NFL was born, the league held its inaugural player draft on Feb. 8, 1936 in Philadelphia. There were no scouts, no players, no agents, no media, no concerts.
Salaries were so meager that the first No. 1 overall pick — Heisman Trophy winner Jay Berwanger — chose to become a foam rubber salesman in Chicago rather than a pro football player. By the late 1970s, the thought of televising the Draft was still deemed “nothing short of preposterous,” according to Sports Illustrated.
Today it seems obvious that every major league draft needs to be televised in all its unpredictable glory: like all live events or reality shows, anything can happen.
This Thursday night, over 10 million viewers will tune in for the start of what is now a three-day media spectacle. ESPN will cover the draft for the 44th straight year — with 35 hours of programming — and will have 55 cameras and eight production trucks on the ground in Kansas City. NFL Network will offer more than 75 hours of original coverage beginning Sunday.
Hundreds of thousands of fans will attend the festival-like atmosphere, and at the center of it all is Mel Kiper Jr., ESPN’s senior draft analyst, who’ll work his 40th event.
“It’s the mystery and the anticipation and the buildup of all this,” Kiper tells Front Office Sports. “I always say it’s like Christmas morning: You got all these presents, and you don’t know what they are. You don’t know what’s under the tree.”
Fanbases are tuned in to front offices tensely making selections that could make or break their franchise. Players and their families are anxiously awaiting a life-changing moment.
How did the NFL draft’s TV takeover happen? Call it a happy accident for the NFL and its 32 teams.
Pioneering The Draft Show
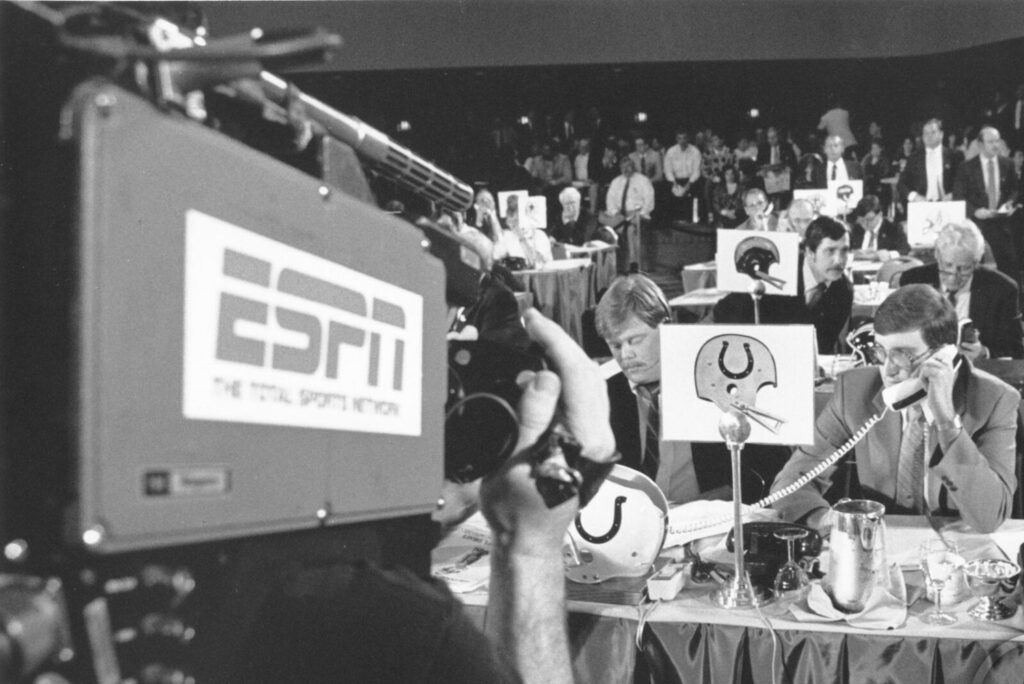
An ESPN camera films the Indianapolis table at the 1990 NFL Draft. Credit: ESPN
The event has taken on a life of its own, but as Kiper says, “ESPN built the Draft.”
In 1979, a six-month-old startup channel called the Entertainment and Sports Programming Network was desperate for content, so it threw a Hail Mary.
ESPN asked the NFL: Can we show the 1980 NFL Draft?
NFL owners opposed it. Even Pete Rozelle, the league’s media-savvy commissioner, was skeptical. Why would anybody watch a bunch of old guys in short-sleeve dress shirts mill about a smoke-filled hotel ballroom?
Because it’s the NFL, countered ESPN.
The audacious proposal finally won over Rozelle. On April 29, 1980, ESPN televised the Draft for the first time to 4 million homes. Kiper joined ESPN’s coverage in 1984, and the Draft was off and running as a bona fide media property.
Eventually, the Draft moved from hotel ballrooms to the bright lights of New York City’s Radio City Music Hall. The sight of raucous fans booing commissioner Roger Goodell and their team’s draft picks has become part of the media circus.
By 2010, the event was a three-day extravaganza — and became so massive that to maximize eyeballs, the NFL moved first- and second-round coverage to prime-time TV.
Disney nearing complete advertising sellout for coverage of 2023 NFL Draft.
April 21, 2023
The league moved the Draft out of New York for the first time in 2015, and the roadshow has since made stops in Chicago, Philadelphia, Dallas, Nashville, Cleveland, Las Vegas, and Kansas City.
Even the COVID-19 pandemic couldn’t stop Draft coverage. In 2020, the league televised a “virtual” Draft, with Goodell reading off picks from the basement of his home in Bronxville, New York (That year’s 1st Round averaged a record 15.6 million viewers).
“We don’t usually like to brag about things,” says ESPN vice president of production Seth Markman. “But this is one event that we feel like we created, we’ve innovated along the way, and we’ve been in lockstep with the NFL every year on how to make this bigger and better.”
In 2006, the first competition arrived: The league’s own NFL Network began televising the Draft with anchor Rich Eisen and is now in its 17th straight year of wall-to-wall coverage. After Fox Sports picked up coverage rights in 2018, ESPN parent Disney boxed it out a year later by pitching a college football-centric version on ABC.
The strategy worked. This year, ESPN and ABC will present their own versions of the Draft for the fifth year in a row, and Fox is still out in the cold.
“It’s one of the few events that I would say is in the DNA of ESPN,” says Markman. “A few years back, Fox was involved as well, and I’ll be honest with you, it pissed people off here. It was one of the few things that we were like, ‘No, no, no, no, we do the NFL Drafts. That’s our event.’”
Capturing The Great Reveal
Johnny Manziel makes his signature money gesture as he walks across the stage at the 2014 NFL Draft. Credit: Brad Penner-USA TODAY Sports
ESPN and ABC have produced over 600 edited video packages for the 2023 Draft, plus over 400 graphics packages. They will have cameras at about 30 remote live shots, nine watch parties, and in all 32 NFL team draft rooms.
Ultimately, reality TV is only as good as the drama unfolding — and capturing it in real time is paramount.
Who can forget the will-he-or-won’t-he suspense over whether Dallas Cowboys owner Jerry Jones would pick the mercurial Johnny Manziel in 2014? Or the crestfallen look on Aaron Rodgers’ face during his freefall from supposed No. 1 pick to No. 24 in 2005?
And even when it’s obvious which player a team is taking at No. 1, people want to see the actual moment the lives of players, families, and franchises change forever — whether it’s a phone call, a walk across the podium, or the first post-selection interview.
“The draft represents hope,” says Markman.
And unlike the Super Bowl, “All 32 teams are interested and all fan bases are interested, and everybody’s excited. So when we do draft shows, we can see how interested fans are and how insatiable their appetite is for draft content. And it’s because it involves everybody.
“When we cover the Super Bowl at ESPN, we put a lot of effort into that obviously, but it’s not one of our highest-rated weeks.”
The football Woodstock easily trumps Draft telecasts for rival leagues. Last year’s Round 1 of the NFL Draft averaged 10.03 million views, more than double the 3.98 million average for Round 1 of the NBA Draft.
The fact that fans have the chance to “play GM for the day” adds to the event’s appeal, said Phil Simms of CBS Sports.
Phil Simms sounds off on new podcast with son and Tom Brady.
April 18, 2023
“I’ve got to admit: I’m right in there with the crowd on TV. I always watch it. It’s great,” said Simms, who’ll host his own virtual watch party for Hang Media on Thursday night. “I can’t wait to see where these quarterbacks go. So they got me.”
Like millions of other fans, the Super Bowl XXI MVP will be glued to his TV screen for Round 1 on Thursday night, Rounds 2-3 on Friday night, and even Rounds 4-7 on Saturday afternoon.
Between ESPN, ABC, and NFLN, many viewers have their favorite Draft coverage. Others toggle back-and-forth between networks, depending on who’s talking on their TV screen.
Simms faithfully watches ESPN every year for one reason: He can’t get enough of Kiper, the draft guru who has inspired a generation of analysts.
“I want to hear Mel Kiper. I’m not going there to hear eight other guys,” said Simms. “I want to hear Mel Kiper’s take — because this is what he does year-round.”
You won’t see any passes or tackles in Kansas City, and the only contact will be the occasional Roger Goodell hug for incoming rookies.
But by 8 p.m. ET, it won’t matter. Carolina will go on the clock, and the Draft will once again take over TV.
Over the last few years, digital currencies and gold have become decent barometers of speculative investor appetite. Such isn’t surprising given the evolution…
Over the last few years, digital currencies and gold have become decent barometers of speculative investor appetite. Such isn’t surprising given the evolution of the market into a “casino” following the pandemic, where retail traders have increased their speculative appetites.
“Such is unsurprising, given that retail investors often fall victim to the psychological behavior of the “fear of missing out.” The chart below shows the “dumb money index” versus the S&P 500. Once again, retail investors are very long equities relative to the institutional players ascribed to being the “smart money.””
“The difference between “smart” and “dumb money” investors shows that, more often than not, the “dumb money” invests near market tops and sells near market bottoms.”
That enthusiasm has increased sharply since last November as stocks surged in hopes that the Federal Reserve would cut interest rates. As noted by Sentiment Trader:
“Over the past 18 weeks, the straight-up rally has moved us to an interesting juncture in the Sentiment Cycle. For the past few weeks, the S&P 500 has demonstrated a high positive correlation to the ‘Enthusiasm’ part of the cycle and a highly negative correlation to the ‘Panic’ phase.”
That frenzy to chase the markets, driven by the psychological bias of the “fear of missing out,” has permeated the entirety of the market. As noted in “This Is Nuts:”
“Since then, the entire market has surged higher following last week’s earnings report from Nvidia (NVDA). The reason I say “this is nuts” is the assumption that all companies were going to grow earnings and revenue at Nvidia’s rate. There is little doubt about Nvidia’s earnings and revenue growth rates. However, to maintain that growth pace indefinitely, particularly at 32x price-to-sales, means others like AMD and Intel must lose market share.”
Of course, it is not just a speculative frenzy in the markets for stocks, specifically anything related to “artificial intelligence,” but that exuberance has spilled over into gold and cryptocurrencies.
Birds Of A Feather
There are a couple of ways to measure exuberance in the assets. While sentiment measures examine the broad market, technical indicators can reflect exuberance on individual asset levels. However, before we get to our charts, we need a brief explanation of statistics, specifically, standard deviation.
“Like a rubber band that has been stretched too far – it must be relaxed in order to be stretched again. This is exactly the same for stock prices that are anchored to their moving averages. Trends that get overextended in one direction, or another, always return to their long-term average. Even during a strong uptrend or strong downtrend, prices often move back (revert) to a long-term moving average.”
The idea of “stretching the rubber band” can be measured in several ways, but I will limit our discussion this week to Standard Deviation and measuring deviation with “Bollinger Bands.”
“Standard Deviation” is defined as:
“A measure of the dispersion of a set of data from its mean. The more spread apart the data, the higher the deviation. Standard deviation is calculated as the square root of the variance.”
In plain English,this meansthat the further away from the average that an event occurs, the more unlikely it becomes. As shown below, out of 1000 occurrences, only three will fall outside the area of 3 standard deviations. 95.4% of the time, events will occur within two standard deviations.
A second measure of “exuberance” is “relative strength.”
“In technical analysis, the relative strength index (RSI) is a momentum indicator that measures the magnitude of recent price changes to evaluate overbought or oversold conditions in the price of a stock or other asset. The RSI is displayed as an oscillator (a line graph that moves between two extremes) and can read from 0 to 100.
Traditional interpretation and usage of the RSI are that values of 70 or above indicate that a security is becoming overbought or overvalued and may be primed for a trend reversal or corrective pullback in price. An RSI reading of 30 or below indicates an oversold or undervalued condition.” – Investopedia
With those two measures, let’s look at Nvidia (NVDA), the poster child of speculative momentum trading in the markets. Nvidia trades more than 3 standard deviations above its moving average, and its RSI is 81. The last time this occurred was in July of 2023 when Nvidia consolidated and corrected prices through November.
Interestingly, gold also trades well into 3 standard deviation territory with an RSI reading of 75. Given that gold is supposed to be a “safe haven” or “risk off” asset, it is instead getting swept up in the current market exuberance.
The same is seen with digital currencies. Given the recent approval of spot, Bitcoin exchange-traded funds (ETFs), the panic bid to buy Bitcoin has pushed the price well into 3 standard deviation territory with an RSI of 73.
In other words, the stock market frenzy to “buy anything that is going up” has spread from just a handful of stocks related to artificial intelligence to gold and digital currencies.
It’s All Relative
We can see the correlation between stock market exuberance and gold and digital currency, which has risen since 2015 but accelerated following the post-pandemic, stimulus-fueled market frenzy. Since the market, gold and cryptocurrencies, or Bitcoin for our purposes, have disparate prices, we have rebased the performance to 100 in 2015.
Gold was supposed to be an inflation hedge. Yet, in 2022, gold prices fell as the market declined and inflation surged to 9%. However, as inflation has fallen and the stock market surged, so has gold. Notably, since 2015, gold and the market have moved in a more correlated pattern, which has reduced the hedging effect of gold in portfolios. In other words, during the subsequent market decline, gold will likely track stocks lower, failing to provide its “wealth preservation” status for investors.
The same goes for cryptocurrencies. Bitcoin is substantially more volatile than gold and tends to ebb and flow with the overall market. As sentiment surges in the S&P 500, Bitcoin and other cryptocurrencies follow suit as speculative appetites increase. Unfortunately, for individuals once again piling into Bitcoin to chase rising prices, if, or when, the market corrects, the decline in cryptocurrencies will likely substantially outpace the decline in market-based equities. This is particularly the case as Wall Street can now short the spot-Bitcoin ETFs, creating additional selling pressure on Bitcoin.
Just for added measure, here is Bitcoin versus gold.
Not A Recommendation
There are many narratives surrounding the markets, digital currency, and gold. However, in today’s market, more than in previous years, all assets are getting swept up into the investor-feeding frenzy.
Sure, this time could be different. I am only making an observation and not an investment recommendation.
However, from a portfolio management perspective, it will likely pay to remain attentive to the correlated risk between asset classes. If some event causes a reversal in bullish exuberance, cash and bonds may be the only place to hide.
BUFFALO, NY- March 11, 2024 – Impact Journals publishes scholarly journals in the biomedical sciences with a focus on all areas of cancer and aging research. Aging is one of the most prominent journals published by Impact Journals.
Credit: Impact Journals
BUFFALO, NY- March 11, 2024 – Impact Journals publishes scholarly journals in the biomedical sciences with a focus on all areas of cancer and aging research. Aging is one of the most prominent journals published by Impact Journals.
Impact Journals will be participating as an exhibitor at the American Association for Cancer Research (AACR) Annual Meeting 2024 from April 5-10 at the San Diego Convention Center in San Diego, California. This year, the AACR meeting theme is “Inspiring Science • Fueling Progress • Revolutionizing Care.”
Visit booth #4159 at the AACR Annual Meeting 2024 to connect with members of the Agingteam.
About Aging-US:
Agingpublishes research papers in all fields of aging research including but not limited, aging from yeast to mammals, cellular senescence, age-related diseases such as cancer and Alzheimer’s diseases and their prevention and treatment, anti-aging strategies and drug development and especially the role of signal transduction pathways such as mTOR in aging and potential approaches to modulate these signaling pathways to extend lifespan. The journal aims to promote treatment of age-related diseases by slowing down aging, validation of anti-aging drugs by treating age-related diseases, prevention of cancer by inhibiting aging. Cancer and COVID-19 are age-related diseases.
Agingis indexed and archived byPubMed/Medline (abbreviated as “Aging (Albany NY)”), PubMed Central, Web of Science: Science Citation Index Expanded (abbreviated as “Aging‐US” and listed in the Cell Biology and Geriatrics & Gerontology categories), Scopus (abbreviated as “Aging” and listed in the Cell Biology and Aging categories), Biological Abstracts, BIOSIS Previews, EMBASE, META (Chan Zuckerberg Initiative) (2018-2022), and Dimensions (Digital Science).
Please visit our website at www.Aging-US.com and connect with us:
NY Fed Finds Medium, Long-Term Inflation Expectations Jump Amid Surge In Stock Market Optimism
One month after the inflation outlook tracked by the NY Fed Consumer Survey extended their late 2023 slide, with 3Y inflation expectations in January sliding to a record low 2.4% (from 2.6% in December), even as 1 and 5Y inflation forecasts remained flat, moments ago the NY Fed reported that in February there was a sharp rebound in longer-term inflation expectations, rising to 2.7% from 2.4% at the three-year ahead horizon, and jumping to 2.9% from 2.5% at the five-year ahead horizon, while the 1Y inflation outlook was flat for the 3rd month in a row, stuck at 3.0%.
The increases in both the three-year ahead and five-year ahead measures were most pronounced for respondents with at most high school degrees (in other words, the "really smart folks" are expecting deflation soon). The survey’s measure of disagreement across respondents (the difference between the 75th and 25th percentile of inflation expectations) decreased at all horizons, while the median inflation uncertainty—or the uncertainty expressed regarding future inflation outcomes—declined at the one- and three-year ahead horizons and remained unchanged at the five-year ahead horizon.
Going down the survey, we find that the median year-ahead expected price changes increased by 0.1 percentage point to 4.3% for gas; decreased by 1.8 percentage points to 6.8% for the cost of medical care (its lowest reading since September 2020); decreased by 0.1 percentage point to 5.8% for the cost of a college education; and surprisingly decreased by 0.3 percentage point for rent to 6.1% (its lowest reading since December 2020), and remained flat for food at 4.9%.
We find the rent expectations surprising because it is happening just asking rents are rising across the country.
At the same time as consumers erroneously saw sharply lower rents, median home price growth expectations remained unchanged for the fifth consecutive month at 3.0%.
Turning to the labor market, the survey found that the average perceived likelihood of voluntary and involuntary job separations increased, while the perceived likelihood of finding a job (in the event of a job loss) declined. "The mean probability of leaving one’s job voluntarily in the next 12 months also increased, by 1.8 percentage points to 19.5%."
Mean unemployment expectations - or the mean probability that the U.S. unemployment rate will be higher one year from now - decreased by 1.1 percentage points to 36.1%, the lowest reading since February 2022. Additionally, the median one-year-ahead expected earnings growth was unchanged at 2.8%, remaining slightly below its 12-month trailing average of 2.9%.
Turning to household finance, we find the following:
The median expected growth in household income remained unchanged at 3.1%. The series has been moving within a narrow range of 2.9% to 3.3% since January 2023, and remains above the February 2020 pre-pandemic level of 2.7%.
Median household spending growth expectations increased by 0.2 percentage point to 5.2%. The increase was driven by respondents with a high school degree or less.
Median year-ahead expected growth in government debt increased to 9.3% from 8.9%.
The mean perceived probability that the average interest rate on saving accounts will be higher in 12 months increased by 0.6 percentage point to 26.1%, remaining below its 12-month trailing average of 30%.
Perceptions about households’ current financial situations deteriorated somewhat with fewer respondents reporting being better off than a year ago. Year-ahead expectations also deteriorated marginally with a smaller share of respondents expecting to be better off and a slightly larger share of respondents expecting to be worse off a year from now.
The mean perceived probability that U.S. stock prices will be higher 12 months from now increased by 1.4 percentage point to 38.9%.
At the same time, perceptions and expectations about credit access turned less optimistic: "Perceptions of credit access compared to a year ago deteriorated with a larger share of respondents reporting tighter conditions and a smaller share reporting looser conditions compared to a year ago."
Also, a smaller percentage of consumers, 11.45% vs 12.14% in prior month, expect to not be able to make minimum debt payment over the next three months
Last, and perhaps most humorous, is the now traditional cognitive dissonance one observes with these polls, because at a time when long-term inflation expectations jumped, which clearly suggests that financial conditions will need to be tightened, the number of respondents expecting higher stock prices one year from today jumped to the highest since November 2021... which incidentally is just when the market topped out during the last cycle before suffering a painful bear market.
We use cookies on our website to give you the most relevant experience by remembering your preferences and repeat visits. By clicking “Accept”, you consent to the use of ALL the cookies.
This website uses cookies to improve your experience while you navigate through the website. Out of these, the cookies that are categorized as necessary are stored on your browser as they are essential for the working of basic functionalities of the website. We also use third-party cookies that help us analyze and understand how you use this website. These cookies will be stored in your browser only with your consent. You also have the option to opt-out of these cookies. But opting out of some of these cookies may affect your browsing experience.
Necessary cookies are absolutely essential for the website to function properly. These cookies ensure basic functionalities and security features of the website, anonymously.
Cookie
Duration
Description
cookielawinfo-checbox-analytics
11 months
This cookie is set by GDPR Cookie Consent plugin. The cookie is used to store the user consent for the cookies in the category "Analytics".
cookielawinfo-checbox-functional
11 months
The cookie is set by GDPR cookie consent to record the user consent for the cookies in the category "Functional".
cookielawinfo-checbox-others
11 months
This cookie is set by GDPR Cookie Consent plugin. The cookie is used to store the user consent for the cookies in the category "Other.
cookielawinfo-checkbox-necessary
11 months
This cookie is set by GDPR Cookie Consent plugin. The cookies is used to store the user consent for the cookies in the category "Necessary".
cookielawinfo-checkbox-performance
11 months
This cookie is set by GDPR Cookie Consent plugin. The cookie is used to store the user consent for the cookies in the category "Performance".
viewed_cookie_policy
11 months
The cookie is set by the GDPR Cookie Consent plugin and is used to store whether or not user has consented to the use of cookies. It does not store any personal data.
Functional cookies help to perform certain functionalities like sharing the content of the website on social media platforms, collect feedbacks, and other third-party features.
Performance cookies are used to understand and analyze the key performance indexes of the website which helps in delivering a better user experience for the visitors.
Analytical cookies are used to understand how visitors interact with the website. These cookies help provide information on metrics the number of visitors, bounce rate, traffic source, etc.
Advertisement cookies are used to provide visitors with relevant ads and marketing campaigns. These cookies track visitors across websites and collect information to provide customized ads.


