Uncategorized
New Tables Show Intermediate-Term Overview is Negative
We have introduced two new tables in the DecisionPoint ALERT to give an overview of trend and BIAS for the major market indexes, sectors, and industry…

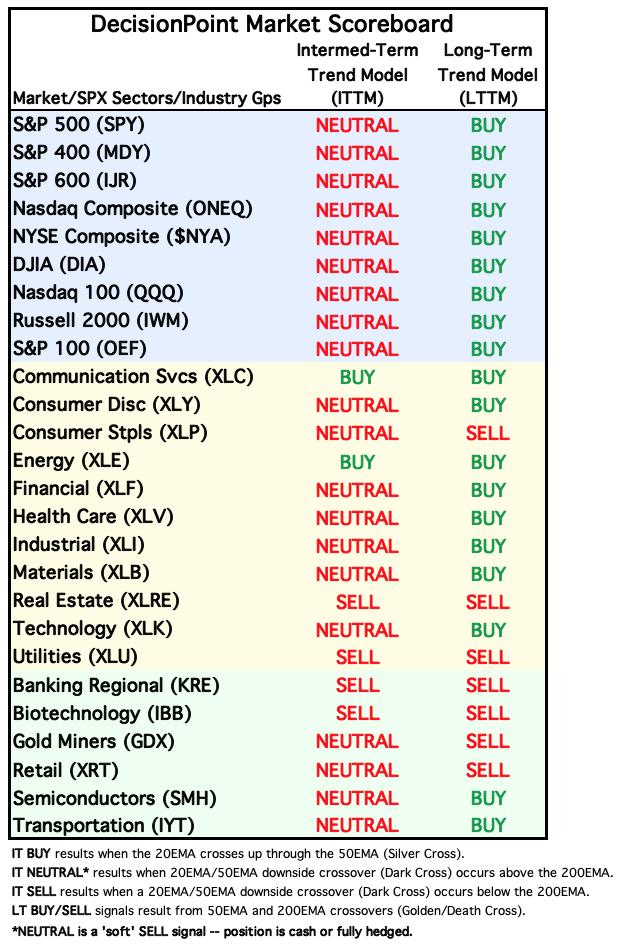
We have introduced two new tables in the DecisionPoint ALERT to give an overview of trend and BIAS for the major market indexes, sectors, and industry groups that we track. The first is our Market Scoreboard, which shows the current Intermediate-Term and Long-Term Trend Model (ITTM and LTTM) signal status. To review:
- The IT Trend Model generates a BUY Signal when the 20-day EMA crosses up through the 50-day EMA (Silver Cross).
- The IT Trend Model generates a NEUTRAL Signal when the 20-day EMA crosses down through the 50-day EMA (Dark Cross) above the 200-day EMA. This is a soft SELL Signal, going to cash or a hedge. It avoids being short in a bull market.
- The IT Trend Model generates a SELL Signal when the 20-day EMA crosses down through the 50-day EMA (Dark Cross) below the 200-day EMA.
- The LT Trend Model generates a BUY Signal when the 50-day EMA crosses up through the 200-day EMA (Golden Cross).
- The LT Trend Model generates a SELL Signal when the 50-day EMA crosses down through the 200-day EMA (Death Cross).
The current table shows that there is considerable stress in the intermediate-term; however, the long-term is still comfortably green for market and sector indexes. But we need to remember that the market indexes are cap-weighted, which means that they can be held aloft by large-cap stocks. The 11 sectors shown are composed solely of S&P 500 components, meaning that they will reflect the strength of that index. Industry groups, however, are not doing as well because they are less protected by the large-cap umbrella.
Next, let's look at how we determine the BIAS of a given index. First, the Silver Cross Index shows the percentage of stocks in an index that have a Silver Cross (20-day EMA above the 50-day EMA), and the Golden Cross Index shows the percentage of stocks in the index that have a Golden Cross (50-day EMA above the 200-day EMA). Next, we determine BIAS based upon the relationship of the Silver Cross Index to its 10-day EMA and the relationship of the Golden Cross Index to its 20-day EMA. When they are above, the BIAS is bullish. When they are below, the BIAS is bearish. See the chart below.
The following table shows the current intermediate-term and long-term BIAS of the market, sector, and industry group indexes we follow. Note that the picture is extremely bearish, but it is a very oversold condition, which will shift toward the positive in the event of a strong rally.
Conclusion: These new tables, available daily in the DecisionPoint ALERT, provide a quick overview of market trend and BIAS. They are intended to help focus attention on areas that may be of interest. They do not give action commands, but provide information flags to prompt assessment of the relevant charts.
Learn more about DecisionPoint.com:
Watch the latest episode of DecisionPoint on StockCharts TV's YouTube channel here!
Try us out for two weeks with a trial subscription!
Use coupon code: DPTRIAL2 at checkout!
Technical Analysis is a windsock, not a crystal ball. --Carl Swenlin
(c) Copyright 2023 DecisionPoint.com
Disclaimer: This blog is for educational purposes only and should not be construed as financial advice. The ideas and strategies should never be used without first assessing your own personal and financial situation, or without consulting a financial professional. Any opinions expressed herein are solely those of the author, and do not in any way represent the views or opinions of any other person or entity.
DecisionPoint is not a registered investment advisor. Investment and trading decisions are solely your responsibility. DecisionPoint newsletters, blogs or website materials should NOT be interpreted as a recommendation or solicitation to buy or sell any security or to take any specific action.
Helpful DecisionPoint Links:
DecisionPoint Alert Chart List
DecisionPoint Golden Cross/Silver Cross Index Chart List
DecisionPoint Sector Chart List
Price Momentum Oscillator (PMO)
Swenlin Trading Oscillators (STO-B and STO-V)
sp 500 stocks
Uncategorized
Bitcoin price must break $31K to avoid 2023 ‘bearish fractal’
BTC price needs to recoup some more key levels before ditching longer-term bearish risk, the latest Bitcoin analysis says.
Bitcoin…

BTC price needs to recoup some more key levels before ditching longer-term bearish risk, the latest Bitcoin analysis says.
Bitcoin (BTC) held above $30,000 at the Oct. 23 Wall Street open as analysis said BTC price strength could cancel its “bearish fractal.”

BTC price preserves majority of early upside
Data from Cointelegraph Markets Pro and TradingView followed BTC/USD as it hovered near $30,700, still up 2.5% on Oct. 23.
The largest cryptocurrency made snap gains after the Oct. 22 weekly close, stopping just shy of $31,000 in what became its highest levels since July.
Now, popular trader and analyst Rekt Capital is keen to see the $31,000 level break.
“Bitcoin has Weekly Closed above the Lower High resistance to confirm the breakout,” he commented alongside the weekly chart.

Rekt Capital argued that BTC/USD could disregard the bearish chart fractal in play throughout 2023 next. This had involved the two year-to-date highs near $32,000 forming a doubletop formation, with downside due as a result.
Specifically, Bitcoin requires a “breach” of $31,000 in order to do so.
#BTC
— Rekt Capital (@rektcapital) October 23, 2023
Is Bitcoin on the cusp of invalidating the Bearish Fractal?
Here are the Bearish Fractal Invalidation Criteria:
a) Bull Market Support Band holds as support ✅
b) Weekly Close beyond Lower High resistance ✅
c) Breach of $31k yearly highs ❌$BTC #Crypto #Bitcoin https://t.co/4H3OMiDzFB pic.twitter.com/mjoO8OF1Qs
More encouraging cues came from the True Market Deviation indicator from on-chain analytics firm Glassnode.
As noted by its lead analyst, Checkmate, on Oct. 23, the metric, also known as the Average Active Investor (AVIV) profit ratio, has crossed a key level.
Bitcoin’s True Mean Market price (TMM) — the level that BTC/USD spends exactly 50% above or below — is now below its spot price, at $29,780.
“Have we now paid our bear market dues?” Checkmate queried, describing TMM as Bitcoin’s “most accurate cost basis model.”

Institutions awaken in “Uptober"
Analyzing the potential drivers of the rally, meanwhile, James Van Straten, research and data analyst at crypto insights firm CryptoSlate, flagged the potential approval of the United States’ first Bitcoin spot-price-based exchange-traded fund (ETF).
Related: BTC price nears 2023 highs — 5 things to know in Bitcoin this week
While not yet awarded the green light, a U.S. spot ETF is being treated as an inevitability after legal battles resulted in regulators losing sway.
“The potential approval of a spot ETF for Bitcoin has spurred a significant increase in bullish inflows in the crypto market,” Van Straten wrote in an update published on Oct. 23.
He noted that Glassnode data shows inflows via over-the-counter (OTC) trading desks spiking since late September.
“In addition, the Purpose Bitcoin ETF, with its holdings of approximately 25,000 Bitcoin, has observed consistent inflow throughout the past month. Even though these inflows might not be termed as ‘large,’ they denote a positive market sentiment,” he continued.
“This uptick in inflows across various platforms indicates an optimistic market response to the potential approval of a Bitcoin ETF, bolstering the overall landscape of digital assets.”

The largest Bitcoin institutional investment vehicle, the Grayscale Bitcoin Trust (GBTC), continues to see a lower discount to the Bitcoin spot price, having already seen its smallest negative margin since December 2021.
This stood at -13.12% as of Oct. 23, per data from monitoring resource CoinGlass.

This article does not contain investment advice or recommendations. Every investment and trading move involves risk, and readers should conduct their own research when making a decision.
cryptocurrency bitcoin crypto btc etf cryptoUncategorized
California bill aims to cap crypto ATM withdrawals at $1K per day to combat scams
A new legislative investigation found some crypto ATMs charging a premium as high as 33%, while a few ATMs had limits of up to $50,000.
…


Uncategorized
An airline just launched one of the country’s longest domestic flights
The trip from New York’s JFK to Anchorage International Airport will take over seven hours.

While the title for longest commercial flight in the world will soon be taken over by the 20-hour and 10,576-mile journey between Sydney and London that Australia's Qantas Airways (QUBSF) - Get Free Report is preparing to launch in 2025, the U.S. is a big country with a number of long-haul domestic flights on its own.
Without even looking at U.S. territories overseas such as Guam or American Samoa, one can spend more than 10 hours in the air and end up only in another state. Some of the longest domestic flights in the U.S. include routes from Boston to Honolulu in Hawaii and Chicago to Alaska's Anchorage.
Related: The World's Longest Flight Is a New Route: Here's Where It Goes
In a move to bring more service from mainland U.S. to Alaska, Alaska Airlines (ALK) - Get Free Report is about to launch its longest flight yet that is subsequently also one of the longest in the country — the route from New York's JFK to Anchorage International Airport will take over seven hours and cross 3,386 miles.
Image source: Shutterstock
New flight takes travelers to 'land of midnight sun'
The route will debut on June 13, 2024 and take place daily on a Boeing 737-8 (BA) - Get Free Report. The airline recently invested in the plane with the longest capacity in its fleet to be able to serve faraway destinations on the East Coast.
More Travel:
- A new travel term is taking over the internet (and reaching airlines and hotels)
- The 10 best airline stocks to buy now
- Airlines see a new kind of traveler at the front of the plane
"We're eager to welcome guests to our great state from the city that never sleeps to the land of the midnight sun on Alaska's new nonstop flight," Jillian Simpson, president and CEO of the Alaska Travel Industry Association, said in a statement. "There's so much to do in Anchorage and in the smaller towns nearby, mapping out your itinerary might be the toughest thing you do before heading west."
The route is part of Alaska Airlines' wider efforts to expand its coverage between Alaska and the mainland U.S. On May 18, it will also launch a nonstop route between Anchorage and San Diego that will take just over six hours and span nearly 2,500 miles. While the airline serves many Californian cities, San Diego's smaller size meant that residents would have previously needed to transfer in Seattle or LA on their way to Alaska.
New routes meant to serve both burgeoning tourist interest and local demand
After adding the new flights, Alaska Airlines expects to have 63 flights a day leaving from Anchorage during the summer of 2024. This is designed to meet the burgeoning traveler interest in the state as well as serve Alaskans who are separated from large American cities by geography.
"Alaskans like to get out," the airline said in announcing the new routes. "Sometimes that might mean hitting all the must-sees in New York City or taking surf lessons in SoCal. We'll make it more convenient for our guests to get there from Anchorage, as well as lots of other places."
For those who are able to make travel plans this far in advance, both the New York and San Diego flights to Anchorage are already available for booking on Alaska Airlines' website. The former starts at $400 each way for mid-week departures, while flying into the state from San Diego will cost from $300.
stocks-
International5 hours ago
A further examination of the state of the economic tailwind
-
Uncategorized24 hours ago
Jeff Bezos and Bill Gates-backed billion dollar business closes
-
Uncategorized3 hours ago
California bill aims to cap crypto ATM withdrawals at $1K per day to combat scams
-
Uncategorized5 hours ago
Bitcoin ETF to trigger massive demand from institutions, EY says
-
Uncategorized23 hours ago
Bearish Triad: Stock Market Indexes and Market Breadth Test Important Support Level; VIX Above 20
-
Uncategorized3 hours ago
Bitcoin price must break $31K to avoid 2023 ‘bearish fractal’
-
Uncategorized3 hours ago
An airline just launched one of the country’s longest domestic flights
-
International3 hours ago
Stock Market Today: Stocks turn higher as Treasury yields retreat; big tech earnings up next