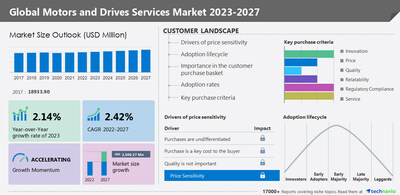
NEW YORK, Feb. 7, 2023 /PRNewswire/ -- According to Technavio, the global motors and drives services market size is estimated to grow by USD 2,500.27 million from 2022 to 2027. The market is estimated to grow at a CAGR of 2.42%. Moreover, the growth momentum will accelerate. APAC will account for 45% of the market's growth during the forecast period. The report provides a comprehensive analysis of growth opportunities at regional levels, new product launches, the latest trends, and the post-pandemic recovery of the global market. For more on the market, request a sample report
Motors and drives services market - Five forces
The global motors and drives services market is fragmented, and the five forces analysis covers–
- Bargaining power of buyers
- The threat of new entrants
- Threat of rivalry
- Bargaining power of suppliers
- Threat of substitutes
- For an interpretation of Porter's five forces model – Buy the report!
Motors and drives services market – Customer landscape
The report includes the market's adoption lifecycle, from the innovator's stage to the laggard's stage. It focuses on adoption rates in different regions based on penetration. Furthermore, the report also includes key purchase criteria and drivers of price sensitivity to help companies evaluate and develop their growth strategies.
Motors and drives services market - Segmentation assessment
Segment overview
Technavio has segmented the market based on product (motors and drives) and end-user (process industry and discrete industry).
- The motors segment will account for a significant share of the market's growth during the forecast period. The use of motors in industries such as automotive, construction, agriculture, and pulp and paper has increased. Vendors offer a wide range of services. For instance, ABB Ltd offers a wide range of services to maximize performance, uptime, and efficiency. These factors are expected to drive the growth of the motors segment during the forecast period.
Geography overview
Based on geography, the global motors and drives services market is segmented into APAC, Europe, North America, South America, and Middle East and Africa. The report provides actionable insights and estimates the contribution of all regions to the growth of the global motors and drives services market.
- APAC is estimated to account for 45% of the growth of the global market during the forecast period. The growth of the market in the region is attributed to factors such as a large number of Greenfield projects and a shift from legacy systems and machinery to modern technology. China, Japan, South Korea, and India are the largest markets for drives in the region owing to their high industrial growth, rising demand for medium-voltage and low-voltage motors, and increasing investments in the power, water and wastewater treatment, and food and beverages industries
Download a sample report
Motors and drives services market – Market dynamics
Key factor driving market growth
- The increasing demand for servo motors and brushless motors is driving the market growth.
- The use of precision motors in harsh environmental conditions has increased the demand for servo motors and brushless motors across industries such as oil and gas, power, chemical and petrochemical, and pharmaceutical.
- Servo motors and brushless motors are compact with rugged stainless-steel bodies, which enables safe operation and provides a better motor size-to-speed ratio.
- Applications such as robotic arms, conveyor belts, metal-cutting machines, textiles, steel processing, and packing require high precision in rotor movement with high speed, hollow shaft, and low vibration.
- Thus, the growing use of brushless and servo motors will increase the demand for various services such as retrofit, maintenance, and installation services during the forecast period, which will fuel the market growth
Leading trends influencing the market
- The adoption of an inside sales strategy in developing countries is a key trend in the market.
- In developing countries such as India, Indonesia, Taiwan, and China, established local vendors provide components such as motors and drives at low costs.
- The high demand for motors and drives has increased the scope for large independent service providers or third-party vendors.
- Service providers and third-party vendors create innovative strategies, such as using e-commerce platforms, to attract end-users.
- Improved marketing strategies promote their services and increase their visibility.
- Such strategies are expected to support the growth of the market during the forecast period
Major challenges hindering the market growth
- High maintenance cost is challenging the market growth.
- The maintenance service cost of motors and drives is high. They require frequent lubrication, cleaning, and monitoring due to the presence of mechanical parts such as bearings, rotors or stators, belts, brushes, and motor mounts.
- Bearing failure is a major cause of motor failure and can be caused by improper lubrication, misalignment, replacement with the wrong type of bearing, high loading, and a hostile environment.
- Motors are often used in industries such as oil and gas, chemical, marine, metals and mining, and wind power generation, which are prone to hostile environments.
- However, many SMEs cannot afford the higher maintenance service costs.
- Such factors will impede the growth of the market during the forecast period.
Drivers, trends, and challenges have an impact on market dynamics, which can impact businesses. Find more insights in a sample report!
What are the key data covered in this motors and drives services market report?
- CAGR of the market during the forecast period
- Detailed information on factors that will drive the growth of the motors and drives services market between 2023 and 2027
- Precise estimation of the size of the motors and drives services market and its contribution to the parent market
- Accurate predictions about upcoming trends and changes in consumer behavior
- Growth of the motors and drives services market across APAC, Europe, North America, South America, and Middle East and Africa
- A thorough analysis of the market's competitive landscape and detailed information about vendors
- Comprehensive analysis of factors that will challenge the growth of motors and drives services market vendors
Gain instant access to 17,000+ market research reports.
Technavio's SUBSCRIPTION platform
Related Reports:
The severe duty motors market size is expected to increase by USD 602.59 million from 2021 to 2026. This report extensively covers segmentation by end-user (oil and gas industry, chemical and petrochemical industry, water and wastewater industry, metals and mining industry, and others industry) and geography (APAC, North America, Europe, Middle East and Africa, and South America).
The industrial gear motors and drives market size is expected to increase by USD 4.76 billion from 2021 to 2026, and the market's growth momentum will accelerate at a CAGR of 5.33%. This report extensively covers segmentation by end-user (material handling, food and beverages, wind power, chemicals and oil and gas, and others), type (standard geared products and precision geared products), and geography (APAC, Europe, North America, Middle East and Africa, and South America).
Motors and Drives Services Market Scope
|
Report Coverage
| Details
|
Page number
| 172
|
Base year
| 2022
|
Historic period
| 2017-2021
|
Forecast period
| 2023-2027
|
Growth momentum & CAGR
| Accelerate at a CAGR of 2.42%
|
Market growth 2023-2027
| USD 2,500.27 million
|
Market structure
| Fragmented
|
YoY growth 2022-2023 (%)
| 2.14
|
Regional analysis
| APAC, Europe, North America, South America, and Middle East and Africa
|
Performing market contribution
| APAC at 45%
|
Key countries
| US, China, Japan, Germany, and UK
|
Competitive landscape
| Leading vendors, market positioning of vendors, competitive strategies, and industry risks
|
Key companies profiled
| ABB Ltd., Altra Industrial Motion Corp., Danfoss AS, Delta Electronics Inc., Fuji Electric Co. Ltd., Integrated Power Services LLC, Lenze SE, Mitsubishi Electric Corp., Nidec Corp., OMRON Corp., Regal Rexnord Corp., Rockwell Automation Inc., SEW-EURODRIVE GmbH and Co KG, Siemens AG, TECO Electric and Machinery Co. Ltd., TOSHIBA CORP, Wolong ELectric Group, Yaskawa Electric Corp., WEG SA, and Yokogawa Electric Corp.
|
Market dynamics
| Parent market analysis, market growth inducers and obstacles, fast-growing and slow-growing segment analysis, COVID-19 impact and recovery analysis and future consumer dynamics, and market condition analysis for the forecast period.
|
Customization purview
| If our report has not included the data that you are looking for, you can reach out to our analysts and get segments customized.
|
Browse for Technavio's industrials market reports
Table of contents
1 Executive Summary
- 1.1 Market overview
- Exhibit 01: Executive Summary – Chart on Market Overview
- Exhibit 02: Executive Summary – Data Table on Market Overview
- Exhibit 03: Executive Summary – Chart on Global Market Characteristics
- Exhibit 04: Executive Summary – Chart on Market by Geography
- Exhibit 05: Executive Summary – Chart on Market Segmentation by Product
- Exhibit 06: Executive Summary – Chart on Market Segmentation by End-user
- Exhibit 07: Executive Summary – Chart on Incremental Growth
- Exhibit 08: Executive Summary – Data Table on Incremental Growth
- Exhibit 09: Executive Summary – Chart on Vendor Market Positioning
2 Market Landscape
- 2.1 Market ecosystem
- Exhibit 10: Parent market
- Exhibit 11: Market Characteristics
3 Market Sizing
- 3.1 Market definition
- Exhibit 12: Offerings of vendors included in the market definition
- 3.2 Market segment analysis
- Exhibit 13: Market segments
- 3.4 Market outlook: Forecast for 2022-2027
- Exhibit 14: Chart on Global - Market size and forecast 2022-2027 ($ million)
- Exhibit 15: Data Table on Global - Market size and forecast 2022-2027 ($ million)
- Exhibit 16: Chart on Global Market: Year-over-year growth 2022-2027 (%)
- Exhibit 17: Data Table on Global Market: Year-over-year growth 2022-2027 (%)
4 Historic Market Size
- 4.1 Global motors and drives services market 2017 - 2021
- Exhibit 18: Historic Market Size – Data Table on Global motors and drives services market 2017 - 2021 ($ million)
- 4.2 Product Segment Analysis 2017 - 2021
- Exhibit 19: Historic Market Size – Product Segment 2017 - 2021 ($ million)
- 4.3 End-user Segment Analysis 2017 - 2021
- Exhibit 20: Historic Market Size – End-user Segment 2017 - 2021 ($ million)
- 4.4 Geography Segment Analysis 2017 - 2021
- Exhibit 21: Historic Market Size – Geography Segment 2017 - 2021 ($ million)
- 4.5 Country Segment Analysis 2017 - 2021
- Exhibit 22: Historic Market Size – Country Segment 2017 - 2021 ($ million)
5 Five Forces Analysis
- 5.1 Five forces summary
- Exhibit 23: Five forces analysis - Comparison between 2022 and 2027
- 5.2 Bargaining power of buyers
- Exhibit 24: Chart on Bargaining power of buyers – Impact of key factors 2022 and 2027
- 5.3 Bargaining power of suppliers
- Exhibit 25: Bargaining power of suppliers – Impact of key factors in 2022 and 2027
- 5.4 Threat of new entrants
- Exhibit 26: Threat of new entrants – Impact of key factors in 2022 and 2027
- 5.5 Threat of substitutes
- Exhibit 27: Threat of substitutes – Impact of key factors in 2022 and 2027
- 5.6 Threat of rivalry
- Exhibit 28: Threat of rivalry – Impact of key factors in 2022 and 2027
- 5.7 Market condition
- Exhibit 29: Chart on Market condition - Five forces 2022 and 2027
6 Market Segmentation by Product
- 6.1 Market segments
- Exhibit 30: Chart on Product - Market share 2022-2027 (%)
- Exhibit 31: Data Table on Product - Market share 2022-2027 (%)
- 6.2 Comparison by Product
- Exhibit 32: Chart on Comparison by Product
- Exhibit 33: Data Table on Comparison by Product
- 6.3 Motors - Market size and forecast 2022-2027
- Exhibit 34: Chart on Motors - Market size and forecast 2022-2027 ($ million)
- Exhibit 35: Data Table on Motors - Market size and forecast 2022-2027 ($ million)
- Exhibit 36: Chart on Motors - Year-over-year growth 2022-2027 (%)
- Exhibit 37: Data Table on Motors - Year-over-year growth 2022-2027 (%)
- 6.4 Drives - Market size and forecast 2022-2027
- Exhibit 38: Chart on Drives - Market size and forecast 2022-2027 ($ million)
- Exhibit 39: Data Table on Drives - Market size and forecast 2022-2027 ($ million)
- Exhibit 40: Chart on Drives - Year-over-year growth 2022-2027 (%)
- Exhibit 41: Data Table on Drives - Year-over-year growth 2022-2027 (%)
- 6.5 Market opportunity by Product
- Exhibit 42: Market opportunity by Product ($ million)
7 Market Segmentation by End-user
- 7.1 Market segments
- Exhibit 43: Chart on End-user - Market share 2022-2027 (%)
- Exhibit 44: Data Table on End-user - Market share 2022-2027 (%)
- 7.2 Comparison by End-user
- Exhibit 45: Chart on Comparison by End-user
- Exhibit 46: Data Table on Comparison by End-user
- 7.3 Process industry - Market size and forecast 2022-2027
- Exhibit 47: Chart on Process industry - Market size and forecast 2022-2027 ($ million)
- Exhibit 48: Data Table on Process industry - Market size and forecast 2022-2027 ($ million)
- Exhibit 49: Chart on Process industry - Year-over-year growth 2022-2027 (%)
- Exhibit 50: Data Table on Process industry - Year-over-year growth 2022-2027 (%)
- 7.4 Discrete industry - Market size and forecast 2022-2027
- Exhibit 51: Chart on Discrete industry - Market size and forecast 2022-2027 ($ million)
- Exhibit 52: Data Table on Discrete industry - Market size and forecast 2022-2027 ($ million)
- Exhibit 53: Chart on Discrete industry - Year-over-year growth 2022-2027 (%)
- Exhibit 54: Data Table on Discrete industry - Year-over-year growth 2022-2027 (%)
- 7.5 Market opportunity by End-user
- Exhibit 55: Market opportunity by End-user ($ million)
8 Customer Landscape
- 8.1 Customer landscape overview
- Exhibit 56: Analysis of price sensitivity, lifecycle, customer purchase basket, adoption rates, and purchase criteria
9 Geographic Landscape
- 9.1 Geographic segmentation
- Exhibit 57: Chart on Market share by geography 2022-2027 (%)
- Exhibit 58: Data Table on Market share by geography 2022-2027 (%)
- 9.2 Geographic comparison
- Exhibit 59: Chart on Geographic comparison
- Exhibit 60: Data Table on Geographic comparison
- 9.3 APAC - Market size and forecast 2022-2027
- Exhibit 61: Chart on APAC - Market size and forecast 2022-2027 ($ million)
- Exhibit 62: Data Table on APAC - Market size and forecast 2022-2027 ($ million)
- Exhibit 63: Chart on APAC - Year-over-year growth 2022-2027 (%)
- Exhibit 64: Data Table on APAC - Year-over-year growth 2022-2027 (%)
- 9.4 Europe - Market size and forecast 2022-2027
- Exhibit 65: Chart on Europe - Market size and forecast 2022-2027 ($ million)
- Exhibit 66: Data Table on Europe - Market size and forecast 2022-2027 ($ million)
- Exhibit 67: Chart on Europe - Year-over-year growth 2022-2027 (%)
- Exhibit 68: Data Table on Europe - Year-over-year growth 2022-2027 (%)
- 9.5 North America - Market size and forecast 2022-2027
- Exhibit 69: Chart on North America - Market size and forecast 2022-2027 ($ million)
- Exhibit 70: Data Table on North America - Market size and forecast 2022-2027 ($ million)
- Exhibit 71: Chart on North America - Year-over-year growth 2022-2027 (%)
- Exhibit 72: Data Table on North America - Year-over-year growth 2022-2027 (%)
- 9.6 South America - Market size and forecast 2022-2027
- Exhibit 73: Chart on South America - Market size and forecast 2022-2027 ($ million)
- Exhibit 74: Data Table on South America - Market size and forecast 2022-2027 ($ million)
- Exhibit 75: Chart on South America - Year-over-year growth 2022-2027 (%)
- Exhibit 76: Data Table on South America - Year-over-year growth 2022-2027 (%)
- 9.7 Middle East and Africa - Market size and forecast 2022-2027
- Exhibit 77: Chart on Middle East and Africa - Market size and forecast 2022-2027 ($ million)
- Exhibit 78: Data Table on Middle East and Africa - Market size and forecast 2022-2027 ($ million)
- Exhibit 79: Chart on Middle East and Africa - Year-over-year growth 2022-2027 (%)
- Exhibit 80: Data Table on Middle East and Africa - Year-over-year growth 2022-2027 (%)
- 9.8 China - Market size and forecast 2022-2027
- Exhibit 81: Chart on China - Market size and forecast 2022-2027 ($ million)
- Exhibit 82: Data Table on China - Market size and forecast 2022-2027 ($ million)
- Exhibit 83: Chart on China - Year-over-year growth 2022-2027 (%)
- Exhibit 84: Data Table on China - Year-over-year growth 2022-2027 (%)
- 9.9 US - Market size and forecast 2022-2027
- Exhibit 85: Chart on US - Market size and forecast 2022-2027 ($ million)
- Exhibit 86: Data Table on US - Market size and forecast 2022-2027 ($ million)
- Exhibit 87: Chart on US - Year-over-year growth 2022-2027 (%)
- Exhibit 88: Data Table on US - Year-over-year growth 2022-2027 (%)
- 9.10 Germany - Market size and forecast 2022-2027
- Exhibit 89: Chart on Germany - Market size and forecast 2022-2027 ($ million)
- Exhibit 90: Data Table on Germany - Market size and forecast 2022-2027 ($ million)
- Exhibit 91: Chart on Germany - Year-over-year growth 2022-2027 (%)
- Exhibit 92: Data Table on Germany - Year-over-year growth 2022-2027 (%)
- 9.11 Japan - Market size and forecast 2022-2027
- Exhibit 93: Chart on Japan - Market size and forecast 2022-2027 ($ million)
- Exhibit 94: Data Table on Japan - Market size and forecast 2022-2027 ($ million)
- Exhibit 95: Chart on Japan - Year-over-year growth 2022-2027 (%)
- Exhibit 96: Data Table on Japan - Year-over-year growth 2022-2027 (%)
- 9.12 UK - Market size and forecast 2022-2027
- Exhibit 97: Chart on UK - Market size and forecast 2022-2027 ($ million)
- Exhibit 98: Data Table on UK - Market size and forecast 2022-2027 ($ million)
- Exhibit 99: Chart on UK - Year-over-year growth 2022-2027 (%)
- Exhibit 100: Data Table on UK - Year-over-year growth 2022-2027 (%)
- 9.13 Market opportunity by geography
- Exhibit 101: Market opportunity by geography ($ million)
10 Drivers, Challenges, and Trends
- 10.3 Impact of drivers and challenges
- Exhibit 102: Impact of drivers and challenges in 2022 and 2027
11 Vendor Landscape
- 11.2 Vendor landscape
- Exhibit 103: Overview on Criticality of inputs and Factors of differentiation
- 11.3 Landscape disruption
- Exhibit 104: Overview on factors of disruption
- 11.4 Industry risks
- Exhibit 105: Impact of key risks on business
12 Vendor Analysis
- 12.1 Vendors covered
- Exhibit 106: Vendors covered
- 12.2 Market positioning of vendors
- Exhibit 107: Matrix on vendor position and classification
- 12.3 ABB Ltd.
- Exhibit 108: ABB Ltd. - Overview
- Exhibit 109: ABB Ltd. - Business segments
- Exhibit 110: ABB Ltd. - Key news
- Exhibit 111: ABB Ltd. - Key offerings
- Exhibit 112: ABB Ltd. - Segment focus
- 12.4 Altra Industrial Motion Corp.
- Exhibit 113: Altra Industrial Motion Corp. - Overview
- Exhibit 114: Altra Industrial Motion Corp. - Business segments
- Exhibit 115: Altra Industrial Motion Corp. - Key offerings
- Exhibit 116: Altra Industrial Motion Corp. - Segment focus
- 12.5 Danfoss AS
- Exhibit 117: Danfoss AS - Overview
- Exhibit 118: Danfoss AS - Business segments
- Exhibit 119: Danfoss AS - Key news
- Exhibit 120: Danfoss AS - Key offerings
- Exhibit 121: Danfoss AS - Segment focus
- 12.6 Delta Electronics Inc.
- Exhibit 122: Delta Electronics Inc. - Overview
- Exhibit 123: Delta Electronics Inc. - Business segments
- Exhibit 124: Delta Electronics Inc. - Key offerings
- Exhibit 125: Delta Electronics Inc. - Segment focus
- 12.7 Fuji Electric Co. Ltd.
- Exhibit 126: Fuji Electric Co. Ltd. - Overview
- Exhibit 127: Fuji Electric Co. Ltd. - Business segments
- Exhibit 128: Fuji Electric Co. Ltd. - Key offerings
- Exhibit 129: Fuji Electric Co. Ltd. - Segment focus
- 12.8 Integrated Power Services LLC
- Exhibit 130: Integrated Power Services LLC - Overview
- Exhibit 131: Integrated Power Services LLC - Product / Service
- Exhibit 132: Integrated Power Services LLC - Key offerings
- 12.9 Mitsubishi Electric Corp.
- Exhibit 133: Mitsubishi Electric Corp. - Overview
- Exhibit 134: Mitsubishi Electric Corp. - Business segments
- Exhibit 135: Mitsubishi Electric Corp. - Key news
- Exhibit 136: Mitsubishi Electric Corp. - Key offerings
- Exhibit 137: Mitsubishi Electric Corp. - Segment focus
- 12.10 Nidec Corp.
- Exhibit 138: Nidec Corp. - Overview
- Exhibit 139: Nidec Corp. - Business segments
- Exhibit 140: Nidec Corp. - Key news
- Exhibit 141: Nidec Corp. - Key offerings
- Exhibit 142: Nidec Corp. - Segment focus
- 12.11 OMRON Corp.
- Exhibit 143: OMRON Corp. - Overview
- Exhibit 144: OMRON Corp. - Business segments
- Exhibit 145: OMRON Corp. - Key news
- Exhibit 146: OMRON Corp. - Key offerings
- Exhibit 147: OMRON Corp. - Segment focus
- 12.12 Regal Rexnord Corp.
- Exhibit 148: Regal Rexnord Corp. - Overview
- Exhibit 149: Regal Rexnord Corp. - Business segments
- Exhibit 150: Regal Rexnord Corp. - Key offerings
- Exhibit 151: Regal Rexnord Corp. - Segment focus
- 12.13 Rockwell Automation Inc.
- Exhibit 152: Rockwell Automation Inc. - Overview
- Exhibit 153: Rockwell Automation Inc. - Business segments
- Exhibit 154: Rockwell Automation Inc. - Key news
- Exhibit 155: Rockwell Automation Inc. - Key offerings
- Exhibit 156: Rockwell Automation Inc. - Segment focus
- 12.14 Siemens AG
- Exhibit 157: Siemens AG - Overview
- Exhibit 158: Siemens AG - Business segments
- Exhibit 159: Siemens AG - Key news
- Exhibit 160: Siemens AG - Key offerings
- Exhibit 161: Siemens AG - Segment focus
- 12.15 TECO Electric and Machinery Co. Ltd.
- Exhibit 162: TECO Electric and Machinery Co. Ltd. - Overview
- Exhibit 163: TECO Electric and Machinery Co. Ltd. - Product / Service
- Exhibit 164: TECO Electric and Machinery Co. Ltd. - Key offerings
- 12.16 TOSHIBA CORP
- Exhibit 165: TOSHIBA CORP - Overview
- Exhibit 166: TOSHIBA CORP - Business segments
- Exhibit 167: TOSHIBA CORP - Key offerings
- Exhibit 168: TOSHIBA CORP - Segment focus
- 12.17 Yaskawa Electric Corp.
- Exhibit 169: Yaskawa Electric Corp. - Overview
- Exhibit 170: Yaskawa Electric Corp. - Business segments
- Exhibit 171: Yaskawa Electric Corp. - Key offerings
- Exhibit 172: Yaskawa Electric Corp. - Segment focus
13 Appendix
- 13.2 Inclusions and exclusions checklist
- Exhibit 173: Inclusions checklist
- Exhibit 174: Exclusions checklist
- 13.3 Currency conversion rates for US$
- Exhibit 175: Currency conversion rates for US$
- 13.4 Research methodology
- Exhibit 176: Research methodology
- Exhibit 177: Validation techniques employed for market sizing
- Exhibit 178: Information sources
- 13.5 List of abbreviations
- Exhibit 179: List of abbreviations
About Us
Technavio is a leading global technology research and advisory company. Their research and analysis focus on emerging market trends and provide actionable insights to help businesses identify market opportunities and develop effective strategies to optimize their market positions. With over 500 specialized analysts, Technavio's report library consists of more than 17,000 reports and counting, covering 800 technologies, spanning across 50 countries. Their client base consists of enterprises of all sizes, including more than 100 Fortune 500 companies. This growing client base relies on Technavio's comprehensive coverage, extensive research, and actionable market insights to identify opportunities in existing and potential markets and assess their competitive positions within changing market scenarios.
Contact
Technavio Research
Jesse Maida
Media & Marketing Executive
US: +1 844 364 1100
UK: +44 203 893 3200
Email: media@technavio.com
Website: www.technavio.com/
View original content to download multimedia:https://www.prnewswire.com/news-releases/motors-and-drives-services-market-2023-2027-a-descriptive-analysis-of-five-forces-model-market-dynamics-and-segmentation---technavio-301739209.html
SOURCE Technavio


