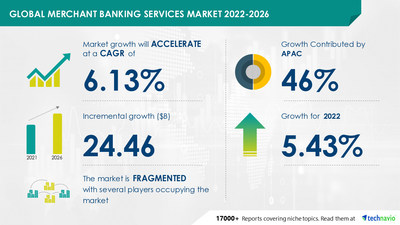
NEW YORK, Nov. 1, 2022 /PRNewswire/ -- The global merchant banking services market size is set to grow by USD 24.46 billion from 2021 to 2026, according to Technavio. In addition, the growth momentum of the market will accelerate at a CAGR of 6.13% during the forecast period. The increased adoption of M&A deals is driving the merchant banking services market growth. However, factors such as increasing data security concerns may challenge market growth.
Make confident decisions using our insights and analysis. Download FREE Sample Report
Merchant Banking Services Market End-user Outlook (Revenue, USD bn, 2021-2026)
- Business - size and forecast 2021-2026
- Individuals - size and forecast 2021-2026
Merchant Banking Services Market Geography Outlook (Revenue, USD bn, 2021-2026)
- APAC - size and forecast 2021-2026
- Europe - size and forecast 2021-2026
- North America - size and forecast 2021-2026
- South America - size and forecast 2021-2026
- Middle East and Africa - size and forecast 2021-2026
Learn about the contribution of each segment summarized in concise infographics and thorough descriptions. View a FREE PDF Sample Report
Regional Analysis
APAC will account for 46% of the market's growth during the forecast period. This growth is attributed to factors such as the growing expansion of global merchant banks in China and India. Moreover, market growth in this region will be faster than the growth of the market in other regions. China and India are the key countries for the merchant banking services market in APAC.
Market Driver and Trend
The increased adoption of M&A deals is driving market growth. Enterprises have started to outsource merchant bankers for M&A deals, with the rising number of M&A transactions and a shift toward increased risk management and cost-saving. Merchant banks offer advisory services for M&A deals and due diligence data. The inherent cost advantages associated with merchant banking services have increased their demand among large enterprises. These banks make the M&A process easier for buyers. Therefore, the rise in M&A deals will drive the growth of the market.
The growing number of unicorn startups in APAC is a trend in the market. The increasing number of startups and M&A activities is increasing steadily in countries such as China and India. China has some of the most valued global unicorns, such as ByteDance Ltd. and Ant Group CO., Ltd. Beijing, Shanghai, and Shenzhen are some of the major cities contributing to the list of the global unicorn index in APAC. The significant increase in the number of unicorn startups in APAC will propel the demand for merchant banking services in fundraising activities. Such factors are expected to create growth opportunities for vendors in the market.
Identify key trends, drivers, and challenges in the report, which will help vendors improve their strategies to stay ahead of their competitors. Buy Now for detailed information about market dynamics
Major Merchant Banking Services Companies
- Bank of America Corp.
- Canara bank Ltd.
- Citigroup Inc.
- Credit Suisse Group AG
- DBS Bank Ltd.
- Deutsche Bank AG
- ICICI Bank Ltd.
- JPMorgan Chase and Co.
- Morgan Stanley
- Punjab National Bank
- The Goldman Sachs Group Inc.
- UBS Group AG
- Wells Fargo and Co.
Get lifetime access to our Technavio Insights! Subscribe to our Basic Plan billed annually at USD 5000
Related Reports
Digital Banking Platforms Market by Type and Geography - Forecast and Analysis 2022-2026: This report extensively covers segmentation by type (retail banking and corporate banking) and geography (North America, Europe, APAC, South America, and the Middle East and Africa). 34% of the market's growth will originate from North America during the forecast period. The market share growth in the retail banking segment will be significant.
Banknote Market Growth, Size, Trends, Analysis Report by Type, Application, Region, and Segment Forecast 2021-2025: This report extensively covers segmentation by printer type (state-owned and commercial) and geography (APAC, North America, Europe, MEA, and South America). 31% of the market's growth will originate from North America during the forecast period. The market share growth by the state-owned segment will be significant.
Merchant Banking Services Market Scope
|
Report Coverage
| Details
|
Page number
| 120
|
Base year
| 2021
|
Forecast period
| 2022-2026
|
Growth momentum & CAGR
| Accelerate at a CAGR of 6.13%
|
Market growth 2022-2026
| USD 24.46 billion
|
Market structure
| Fragmented
|
YoY growth (%)
| 5.43
|
Regional analysis
| APAC, Europe, North America, South America, and Middle East and Africa
|
Performing market contribution
| APAC at 46%
|
Key consumer countries
| US, China, India, UK, and France
|
Competitive landscape
| Leading companies, competitive strategies, consumer engagement scope
|
Key companies profiled
| Bank of America Corp., Canara bank Ltd., Citigroup Inc., Credit Suisse Group AG, DBS Bank Ltd., Deutsche Bank AG, ICICI Bank Ltd., JPMorgan Chase and Co., Morgan Stanley, Punjab National Bank, The Goldman Sachs Group Inc., UBS Group AG, and Wells Fargo and Co.
|
Market dynamics
| Parent market analysis, market growth inducers and obstacles, fast-growing and slow-growing segment analysis, COVID-19 impact and recovery analysis and future consumer dynamics, and market condition analysis for the forecast period.
|
Customization purview
| If our report has not included the data that you are looking for, you can reach out to our analysts and get segments customized.
|
Browse Consumer Discretionary Market Reports
Table of Contents
1 Executive Summary
- 1.1 Market overview
- Exhibit 01: Executive Summary – Chart on Market Overview
- Exhibit 02: Executive Summary – Data Table on Market Overview
- Exhibit 03: Executive Summary – Chart on Global Market Characteristics
- Exhibit 04: Executive Summary – Chart on Market by Geography
- Exhibit 05: Executive Summary – Chart on Market Segmentation by End-user
- Exhibit 06: Executive Summary – Chart on Incremental Growth
- Exhibit 07: Executive Summary – Data Table on Incremental Growth
- Exhibit 08: Executive Summary – Chart on Vendor Market Positioning
2 Market Landscape
- 2.1 Market ecosystem
- Exhibit 09: Parent market
- Exhibit 10: Market Characteristics
3 Market Sizing
- 3.1 Market definition
- Exhibit 11: Offerings of vendors included in the market definition
- 3.2 Market segment analysis
- Exhibit 12: Market segments
- 3.4 Market outlook: Forecast for 2021-2026
- Exhibit 13: Chart on Global - Market size and forecast 2021-2026 ($ million)
- Exhibit 14: Data Table on Global - Market size and forecast 2021-2026 ($ million)
- Exhibit 15: Chart on Global Market: Year-over-year growth 2021-2026 (%)
- Exhibit 16: Data Table on Global Market: Year-over-year growth 2021-2026 (%)
4 Five Forces Analysis
- 4.1 Five forces summary
- Exhibit 17: Five forces analysis - Comparison between 2021 and 2026
- 4.2 Bargaining power of buyers
- Exhibit 18: Chart on Bargaining power of buyers – Impact of key factors 2021 and 2026
- 4.3 Bargaining power of suppliers
- Exhibit 19: Bargaining power of suppliers – Impact of key factors in 2021 and 2026
- 4.4 Threat of new entrants
- Exhibit 20: Threat of new entrants – Impact of key factors in 2021 and 2026
- 4.5 Threat of substitutes
- Exhibit 21: Threat of substitutes – Impact of key factors in 2021 and 2026
- 4.6 Threat of rivalry
- Exhibit 22: Threat of rivalry – Impact of key factors in 2021 and 2026
- 4.7 Market condition
- Exhibit 23: Chart on Market condition - Five forces 2021 and 2026
5 Market Segmentation by End-user
- 5.1 Market segments
- Exhibit 24: Chart on End-user - Market share 2021-2026 (%)
- Exhibit 25: Data Table on End-user - Market share 2021-2026 (%)
- 5.2 Comparison by End-user
- Exhibit 26: Chart on Comparison by End-user
- Exhibit 27: Data Table on Comparison by End-user
- 5.3 Business - Market size and forecast 2021-2026
- Exhibit 28: Chart on Business - Market size and forecast 2021-2026 ($ million)
- Exhibit 29: Data Table on Business - Market size and forecast 2021-2026 ($ million)
- Exhibit 30: Chart on Business - Year-over-year growth 2021-2026 (%)
- Exhibit 31: Data Table on Business - Year-over-year growth 2021-2026 (%)
- 5.4 Individuals - Market size and forecast 2021-2026
- Exhibit 32: Chart on Individuals - Market size and forecast 2021-2026 ($ million)
- Exhibit 33: Data Table on Individuals - Market size and forecast 2021-2026 ($ million)
- Exhibit 34: Chart on Individuals - Year-over-year growth 2021-2026 (%)
- Exhibit 35: Data Table on Individuals - Year-over-year growth 2021-2026 (%)
- 5.5 Market opportunity by End-user
- Exhibit 36: Market opportunity by End-user ($ million)
6 Customer Landscape
- 6.1 Customer landscape overview
- Exhibit 37: Analysis of price sensitivity, lifecycle, customer purchase basket, adoption rates, and purchase criteria
7 Geographic Landscape
- 7.1 Geographic segmentation
- Exhibit 38: Chart on Market share by geography 2021-2026 (%)
- Exhibit 39: Data Table on Market share by geography 2021-2026 (%)
- 7.2 Geographic comparison
- Exhibit 40: Chart on Geographic comparison
- Exhibit 41: Data Table on Geographic comparison
- 7.3 APAC - Market size and forecast 2021-2026
- Exhibit 42: Chart on APAC - Market size and forecast 2021-2026 ($ million)
- Exhibit 43: Data Table on APAC - Market size and forecast 2021-2026 ($ million)
- Exhibit 44: Chart on APAC - Year-over-year growth 2021-2026 (%)
- Exhibit 45: Data Table on APAC - Year-over-year growth 2021-2026 (%)
- 7.4 Europe - Market size and forecast 2021-2026
- Exhibit 46: Chart on Europe - Market size and forecast 2021-2026 ($ million)
- Exhibit 47: Data Table on Europe - Market size and forecast 2021-2026 ($ million)
- Exhibit 48: Chart on Europe - Year-over-year growth 2021-2026 (%)
- Exhibit 49: Data Table on Europe - Year-over-year growth 2021-2026 (%)
- 7.5 North America - Market size and forecast 2021-2026
- Exhibit 50: Chart on North America - Market size and forecast 2021-2026 ($ million)
- Exhibit 51: Data Table on North America - Market size and forecast 2021-2026 ($ million)
- Exhibit 52: Chart on North America - Year-over-year growth 2021-2026 (%)
- Exhibit 53: Data Table on North America - Year-over-year growth 2021-2026 (%)
- 7.6 South America - Market size and forecast 2021-2026
- Exhibit 54: Chart on South America - Market size and forecast 2021-2026 ($ million)
- Exhibit 55: Data Table on South America - Market size and forecast 2021-2026 ($ million)
- Exhibit 56: Chart on South America - Year-over-year growth 2021-2026 (%)
- Exhibit 57: Data Table on South America - Year-over-year growth 2021-2026 (%)
- 7.7 Middle East and Africa - Market size and forecast 2021-2026
- Exhibit 58: Chart on Middle East and Africa - Market size and forecast 2021-2026 ($ million)
- Exhibit 59: Data Table on Middle East and Africa - Market size and forecast 2021-2026 ($ million)
- Exhibit 60: Chart on Middle East and Africa - Year-over-year growth 2021-2026 (%)
- Exhibit 61: Data Table on Middle East and Africa - Year-over-year growth 2021-2026 (%)
- 7.8 US - Market size and forecast 2021-2026
- Exhibit 62: Chart on US - Market size and forecast 2021-2026 ($ million)
- Exhibit 63: Data Table on US - Market size and forecast 2021-2026 ($ million)
- Exhibit 64: Chart on US - Year-over-year growth 2021-2026 (%)
- Exhibit 65: Data Table on US - Year-over-year growth 2021-2026 (%)
- 7.9 China - Market size and forecast 2021-2026
- Exhibit 66: Chart on China - Market size and forecast 2021-2026 ($ million)
- Exhibit 67: Data Table on China - Market size and forecast 2021-2026 ($ million)
- Exhibit 68: Chart on China - Year-over-year growth 2021-2026 (%)
- Exhibit 69: Data Table on China - Year-over-year growth 2021-2026 (%)
- 7.10 India - Market size and forecast 2021-2026
- Exhibit 70: Chart on India - Market size and forecast 2021-2026 ($ million)
- Exhibit 71: Data Table on India - Market size and forecast 2021-2026 ($ million)
- Exhibit 72: Chart on India - Year-over-year growth 2021-2026 (%)
- Exhibit 73: Data Table on India - Year-over-year growth 2021-2026 (%)
- 7.11 UK - Market size and forecast 2021-2026
- Exhibit 74: Chart on UK - Market size and forecast 2021-2026 ($ million)
- Exhibit 75: Data Table on UK - Market size and forecast 2021-2026 ($ million)
- Exhibit 76: Chart on UK - Year-over-year growth 2021-2026 (%)
- Exhibit 77: Data Table on UK - Year-over-year growth 2021-2026 (%)
- 7.12 France - Market size and forecast 2021-2026
- Exhibit 78: Chart on France - Market size and forecast 2021-2026 ($ million)
- Exhibit 79: Data Table on France - Market size and forecast 2021-2026 ($ million)
- Exhibit 80: Chart on France - Year-over-year growth 2021-2026 (%)
- Exhibit 81: Data Table on France - Year-over-year growth 2021-2026 (%)
- 7.13 Market opportunity by geography
- Exhibit 82: Market opportunity by geography ($ million)
8 Drivers, Challenges, and Trends
- 8.3 Impact of drivers and challenges
- Exhibit 83: Impact of drivers and challenges in 2021 and 2026
9 Vendor Landscape
- 9.2 Vendor landscape
- Exhibit 84: Overview on Criticality of inputs and Factors of differentiation
- 9.3 Landscape disruption
- Exhibit 85: Overview on factors of disruption
- 9.4 Industry risks
- Exhibit 86: Impact of key risks on business
10 Vendor Analysis
- 10.1 Vendors covered
- Exhibit 87: Vendors covered
- 10.2 Market positioning of vendors
- Exhibit 88: Matrix on vendor position and classification
- 10.3 Bank of America Corp.
- Exhibit 89: Bank of America Corp. - Overview
- Exhibit 90: Bank of America Corp. - Business segments
- Exhibit 91: Bank of America Corp. - Key news
- Exhibit 92: Bank of America Corp. - Key offerings
- Exhibit 93: Bank of America Corp. - Segment focus
- 10.4 Citigroup Inc.
- Exhibit 94: Citigroup Inc. - Overview
- Exhibit 95: Citigroup Inc. - Business segments
- Exhibit 96: Citigroup Inc. - Key offerings
- Exhibit 97: Citigroup Inc. - Segment focus
- 10.5 Credit Suisse Group AG
- Exhibit 98: Credit Suisse Group AG - Overview
- Exhibit 99: Credit Suisse Group AG - Business segments
- Exhibit 100: Credit Suisse Group AG - Key offerings
- Exhibit 101: Credit Suisse Group AG - Segment focus
- 10.6 DBS Bank Ltd.
- Exhibit 102: DBS Bank Ltd. - Overview
- Exhibit 103: DBS Bank Ltd. - Business segments
- Exhibit 104: DBS Bank Ltd. - Key offerings
- Exhibit 105: DBS Bank Ltd. - Segment focus
- 10.7 Deutsche Bank AG
- Exhibit 106: Deutsche Bank AG - Overview
- Exhibit 107: Deutsche Bank AG - Business segments
- Exhibit 108: Deutsche Bank AG - Key news
- Exhibit 109: Deutsche Bank AG - Key offerings
- Exhibit 110: Deutsche Bank AG - Segment focus
- 10.8 JPMorgan Chase and Co.
- Exhibit 111: JPMorgan Chase and Co. - Overview
- Exhibit 112: JPMorgan Chase and Co. - Business segments
- Exhibit 113: JPMorgan Chase and Co. - Key offerings
- Exhibit 114: JPMorgan Chase and Co. - Segment focus
- 10.9 Morgan Stanley
- Exhibit 115: Morgan Stanley - Overview
- Exhibit 116: Morgan Stanley - Business segments
- Exhibit 117: Morgan Stanley - Key offerings
- Exhibit 118: Morgan Stanley - Segment focus
- 10.10 The Goldman Sachs Group Inc.
- Exhibit 119: The Goldman Sachs Group Inc. - Overview
- Exhibit 120: The Goldman Sachs Group Inc. - Business segments
- Exhibit 121: The Goldman Sachs Group Inc. - Key news
- Exhibit 122: The Goldman Sachs Group Inc. - Key offerings
- Exhibit 123: The Goldman Sachs Group Inc. - Segment focus
- 10.11 UBS Group AG
- Exhibit 124: UBS Group AG - Overview
- Exhibit 125: UBS Group AG - Business segments
- Exhibit 126: UBS Group AG - Key offerings
- Exhibit 127: UBS Group AG - Segment focus
- 10.12 Wells Fargo and Co.
- Exhibit 128: Wells Fargo and Co. - Overview
- Exhibit 129: Wells Fargo and Co. - Business segments
- Exhibit 130: Wells Fargo and Co. - Key offerings
- Exhibit 131: Wells Fargo and Co. - Segment focus
11 Appendix
- 11.2 Inclusions and exclusions checklist
- Exhibit 132: Inclusions checklist
- Exhibit 133: Exclusions checklist
- 11.3 Currency conversion rates for US$
- Exhibit 134: Currency conversion rates for US$
- 11.4 Research methodology
- Exhibit 135: Research methodology
- Exhibit 136: Validation techniques employed for market sizing
- Exhibit 137: Information sources
- 11.5 List of abbreviations
- Exhibit 138: List of abbreviations
About Technavio
Technavio is a leading global technology research and advisory company. Their research and analysis focus on emerging market trends and provide actionable insights to help businesses identify market opportunities and develop effective strategies to optimize their market positions.
With over 500 specialized analysts, Technavio's report library consists of more than 17,000 reports and counting, covering 800 technologies spanning across 50 countries. Their client base consists of enterprises of all sizes, including more than 100 Fortune 500 companies. This growing client base relies on Technavio's comprehensive coverage, extensive research, and actionable market insights to identify opportunities in existing and potential markets and assess their competitive positions within changing market scenarios.
Contacts
Technavio Research
Jesse Maida
Media & Marketing Executive
US: +1 844 364 1100
UK: +44 203 893 3200
Email: media@technavio.com
Website: www.technavio.com/
View original content to download multimedia:https://www.prnewswire.com/news-releases/merchant-banking-services-market-to-grow-by-usd-24-46-bn-46-of-market-growth-to-originate-from-apac---technavio-301662515.html
SOURCE Technavio


