Government
March Jobs Come In Red-Hot At 303K, Above Highest Estimate, As Unemployment Rate Drops
March Jobs Come In Red-Hot At 303K, Above Highest Estimate, As Unemployment Rate Drops
As we wrote in our preview, while big data hinted at…
Share this:

As we wrote in our preview, while big data hinted at a weaker than expected March jobs print, the relentless influx of immigrants would lead to a hotter than expected payrolls number.
Payrolls preview: big data hints at weaker number but relentless surge in immigration will likely push it hot https://t.co/D5cf9duMIM pic.twitter.com/o7KOiEaAyp
— zerohedge (@zerohedge) April 5, 2024
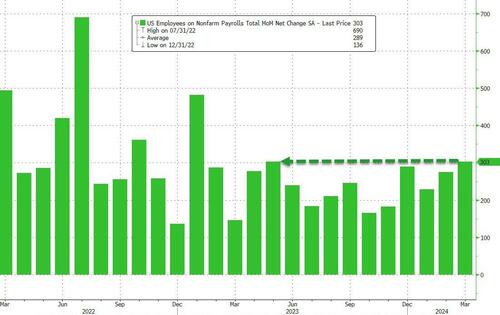
Sure enough, the illegals won again when moments ago the BLS reported that in March, the US added a whopping 303K jobs, tied for the highest since Jan 2023!
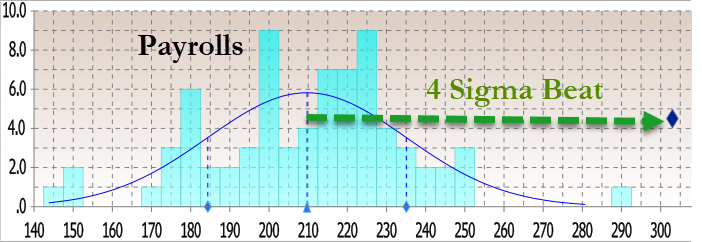
The number was not only hotter than last month's (downward, of course) revised number of 270K (was 275K) but was above the highest Wall Street estimate of 290K (from Jobdig, Inc) and as shown below this was the latest multiple-sigma beat to expectations, this month coming in at 4x.
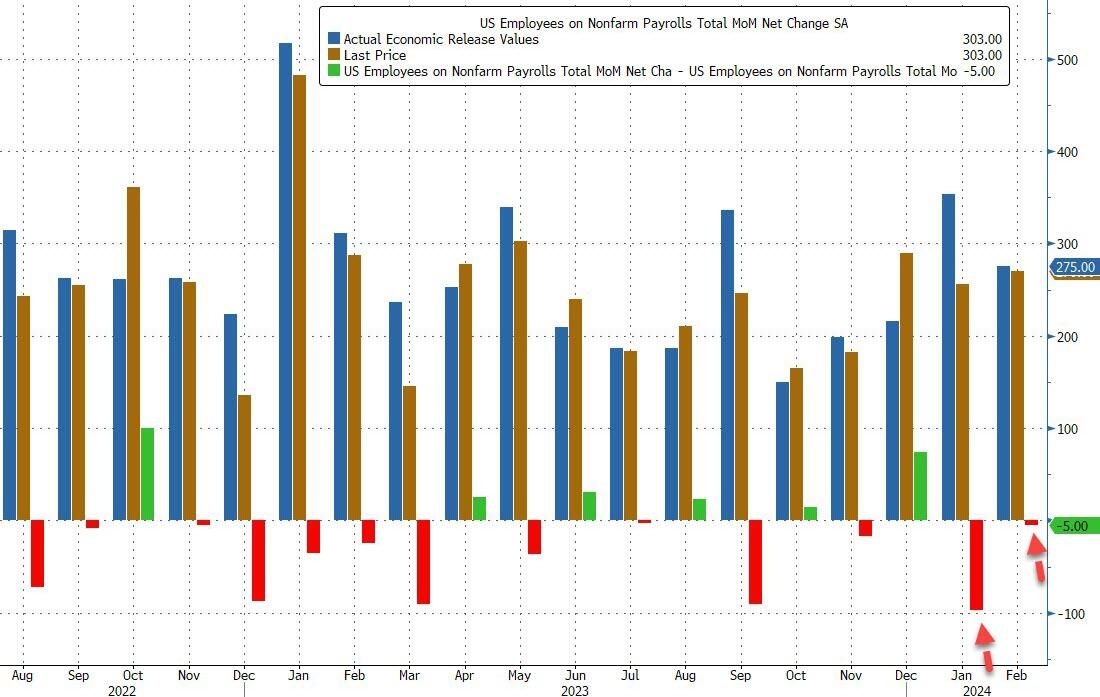
The March number, which will be revised substantially lower next month, follows two downward revisions, follows a 5,000 downward revision to the February number from +275,000 to +270,000, and a 27,000 upward revision to January from +229,000 to +256,000.
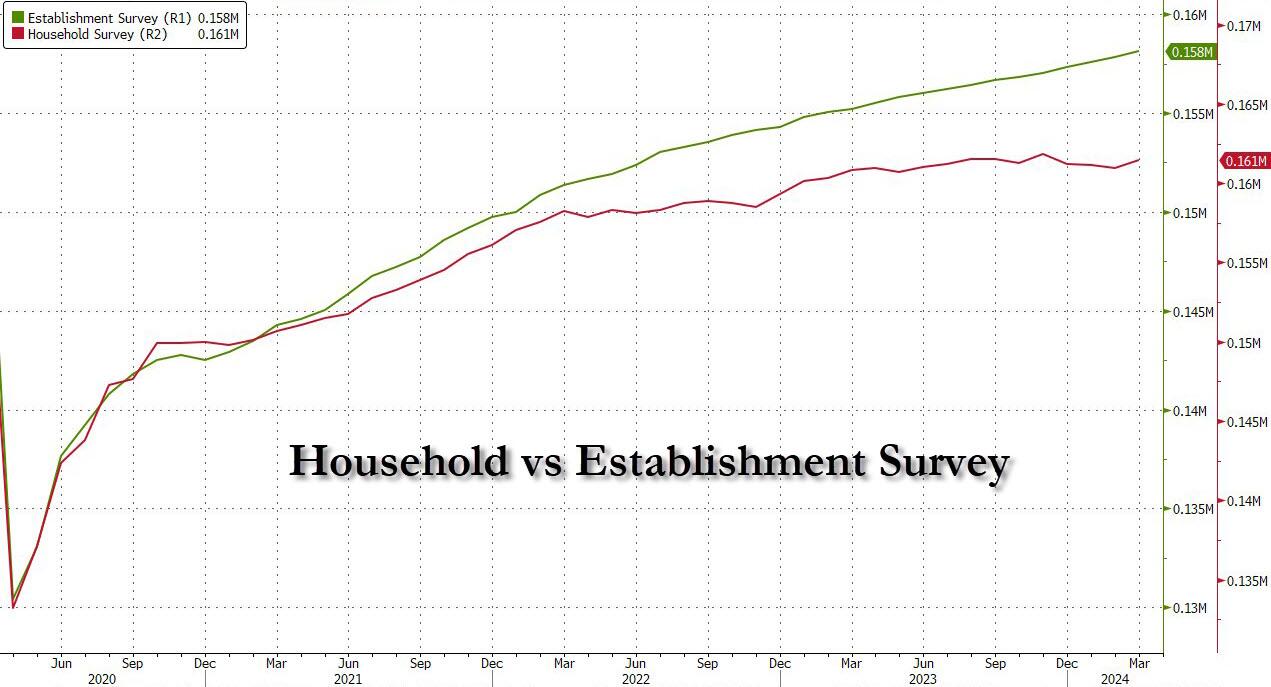
What is perhaps more notable is that after several months of declines in the Household survey, in March the number of people actually employed finally rebounded rising by 498K, to 161.466 million from 160.968 million. Still, as shown below, the data series has a lot of catching up to do.
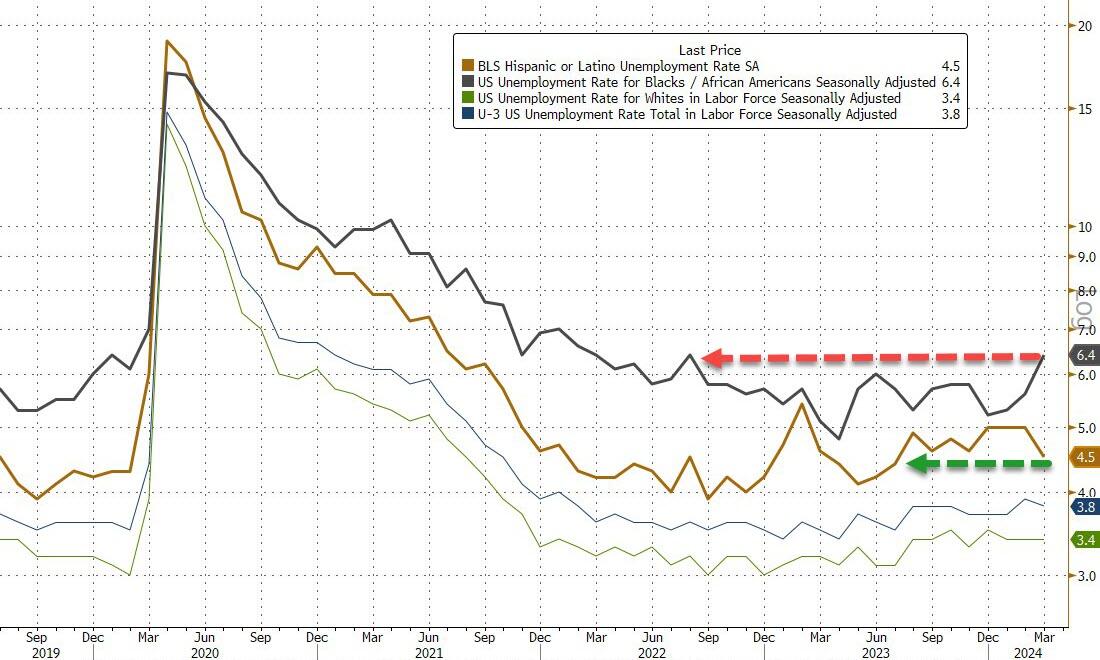
Turning our attention to the unemployment rate, it unexpectedly dipped again, dropping to 3.8%, from 3.9%, in line with estimates, as the number of unemployed workers dipped modestly from 6.458 million to 6.429 million while the number of employed workers rose by almost half a million workers; the unemployment rate for Blacks (6.4 percent) increased in March to the highest level in almost two years, while the rates for Asians (2.5 percent) and Hispanics (4.5 percent) decreased. The jobless rates for adult men (3.3 percent), adult women (3.6 percent), teenagers (12.6 percent), and Whites (3.4 percent) showed little or no change over the month.
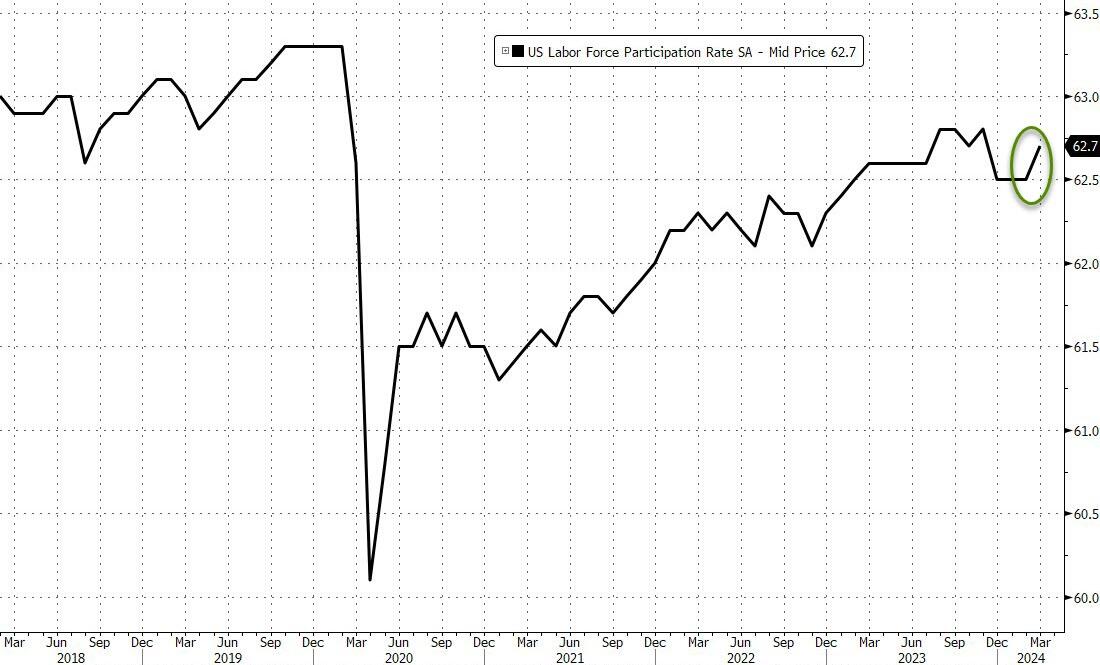
In contrast, the participation rate rose from 62.5% to 62.7%, above the 62.6% expected, as the overall civilian labor force increased slightly less than the number of employed people.
The silver lining to today's jobs report is that despite the hot print, the average hourly earnings came in as expected, rising 0.3% MoM, up from last month's upward revised 0.2% sequential increase (revised from 0.1%), On an annual basis, the hourly earnings rose 4.1%, as expected, and down from 4.3%. This was the lowest print in almost three years: the last time wages rose by this much was the summer of 2021.
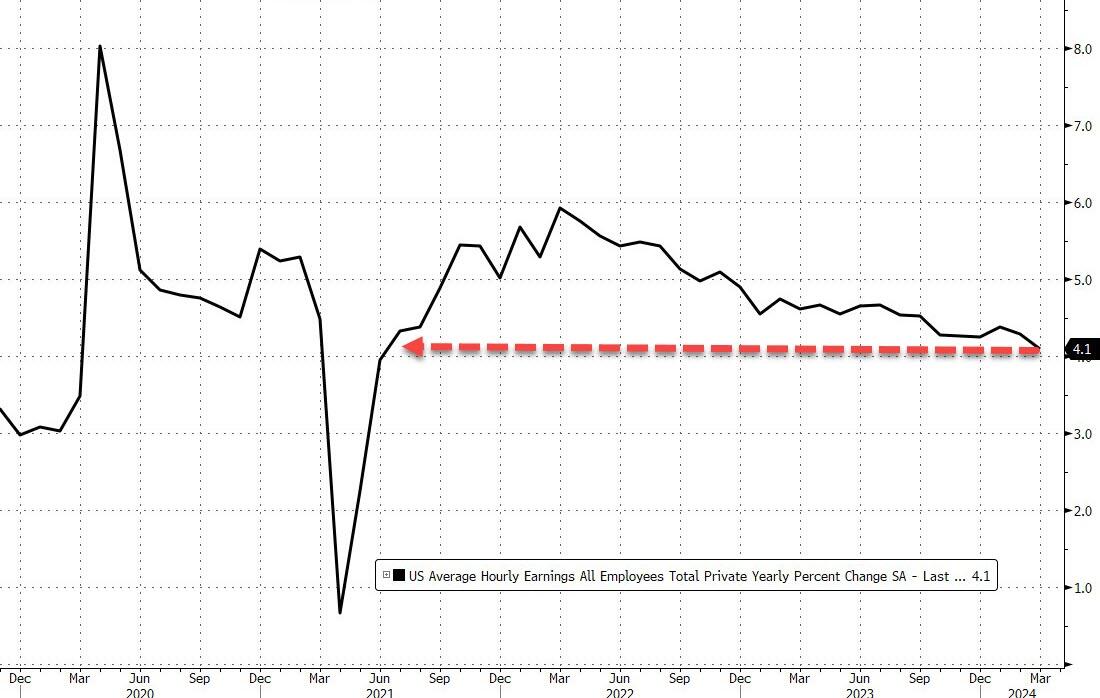
Taking a closer look at wages, In March, average hourly earnings for all employees on private nonfarm payrolls increased by 12 cents, or 0.3 percent, to $34.69. Over the past 12 months, average hourly earnings have increased by 4.1 percent. In March, average hourly earnings of private-sector production and nonsupervisory employees edged up by 7 cents, or 0.2 percent, to $29.79.
One reason why average hourly earnings did not increase is that in March, the average workweek for all employees on private nonfarm payrolls edged up by 0.1 hour to 34.4 hours. In manufacturing, the average workweek was unchanged at 40.0 hours, and overtime edged down by 0.1 hour to 2.9 hours in March. The average workweek for production and nonsupervisory employees on private nonfarm payrolls also edged up by 0.1 hour to 33.9 hours.
* * *
According to the BLS, the number of people not in the labor force who want a job came in little changed at 5.4 million.
“These individuals were not counted as unemployed because they were not actively looking for work during the 4 weeks preceding the survey or were unavailable to take a job.”
Also according to the report, the number of people employed part time for economic reasons, at 4.3 million. These individuals, who would have preferred full-time employment, were working part time because their hours had been reduced or they were unable to find full-time jobs.
Finally, the BLS reports that among those not in the labor force who wanted a job, the number of people marginally attached to the labor force, at 1.6 million, was little changed in March. These individuals wanted and were available for work and had looked for a job sometime in the prior 12 months but had not looked for work in the 4 weeks preceding the survey. The number of discouraged workers, a subset of the marginally attached who believed that no jobs were available for them, was little changed at 337,000 in March.
* * *
Taking a closer look at the composition of jobs by industry we find the following:
- Health care added 72,000 jobs in March, above the average monthly gain of 60,000 over the prior 12 months. In March, job growth continued in ambulatory health care services (+28,000), hospitals (+27,000), and nursing and residential care facilities (+18,000).
- In March, employment in government increased by 71,000, higher than the average monthly gain of 54,000 over the prior 12 months. Over the month, employment increased in local government (+49,000) and federal government (+9,000).
- Construction added 39,000 jobs in March, about double the average monthly gain of 19,000 over the prior 12 months. Over the month, employment increased in nonresidential specialty trade contractors (+16,000).
- Employment in leisure and hospitality trended up in March (+49,000) and has returned to its pre-pandemic February 2020 level. Over the prior 12 months, job growth in the industry had averaged 37,000 per month.
- Employment in the other services industry continued its upward trend in March (+16,000). The industry had added an average of 8,000 jobs per month over the prior 12 months. Employment in other services remains below its February 2020 level by 40,000, or 0.7 percent.
- Employment in social assistance continued to trend up in March (+9,000), below the average monthly gain of 22,000 over the prior 12 months.
- In March, employment was little changed in retail trade (+18,000). A job gain in general merchandise retailers (+20,000) was partially offset by job losses in building material and garden equipment and supplies dealers (-10,000) and in automotive parts, accessories, and tire retailers (-3,000).
- Employment showed little or no change over the month in other major industries, including mining, quarrying, and oil and gas extraction; manufacturing; wholesale trade; transportation and warehousing; information; financial activities; and professional and business services.
A visual breakdown shows that the bulk of jobs was in Education/Health and Government jobs, which accounted for more than half of all March jobs.
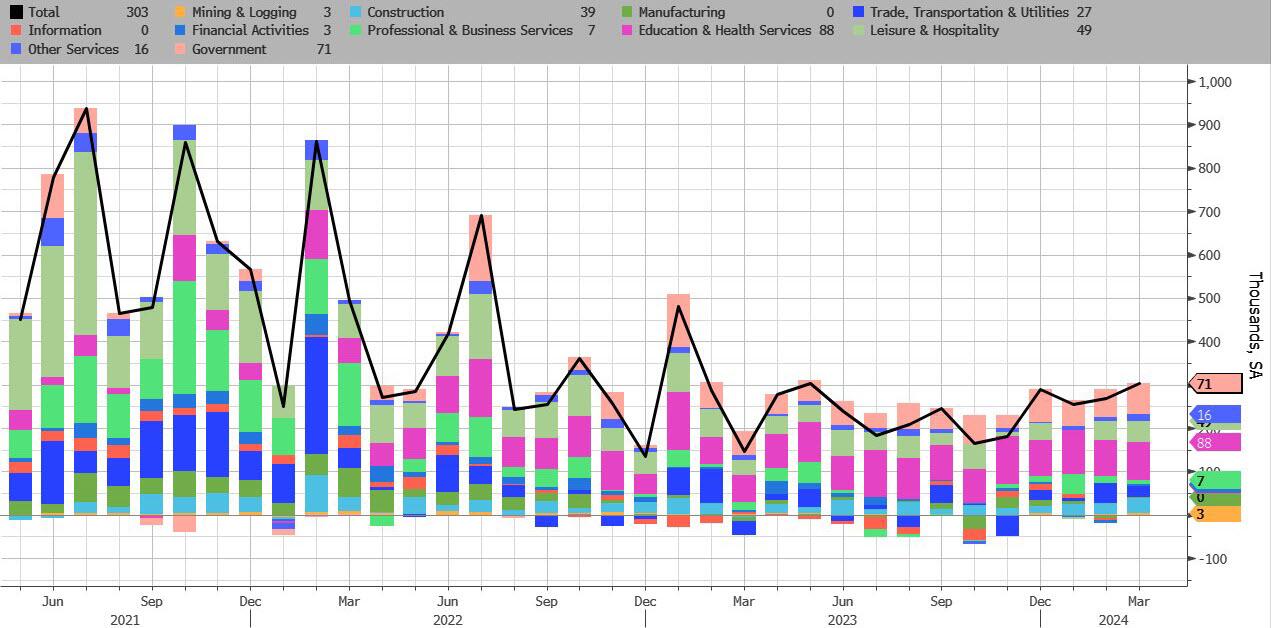
And a closer look at the best performing job category under Biden: government. In March, this added 71K, the second most since the start of 2023.
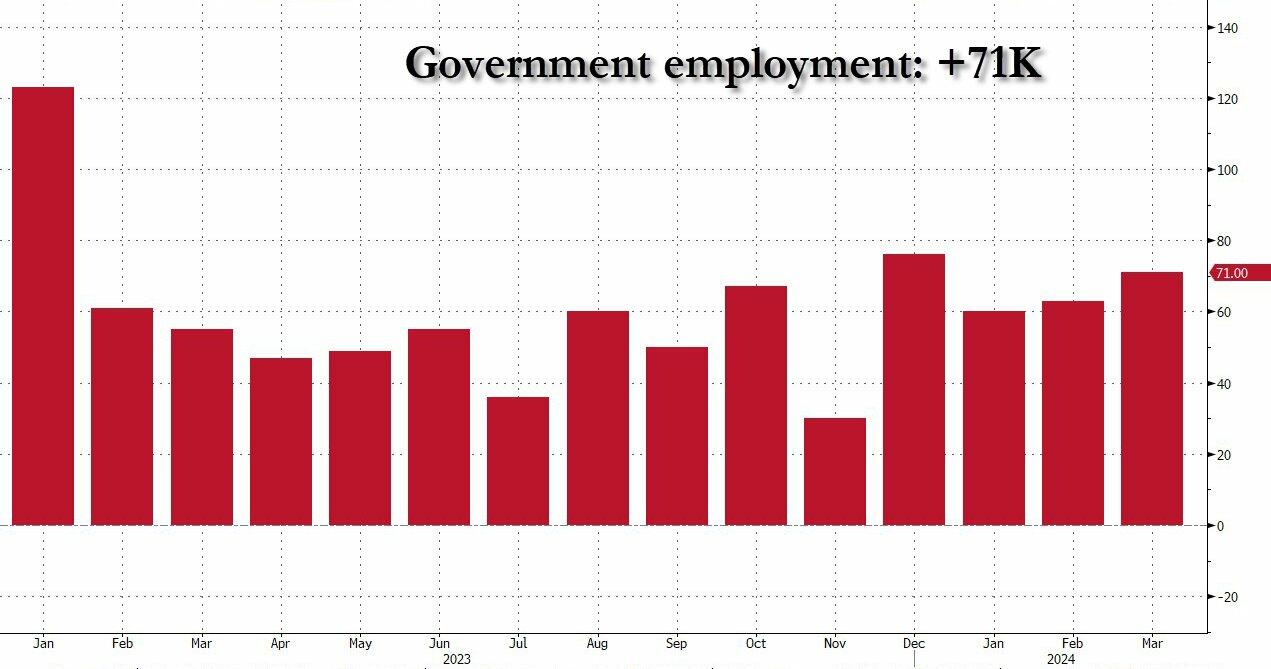
In sum: health care added 72,000 jobs; government roles increased by 71,000; other notable gains were construction, adding 39,000, and leisure and hospitality, adding 49,000.
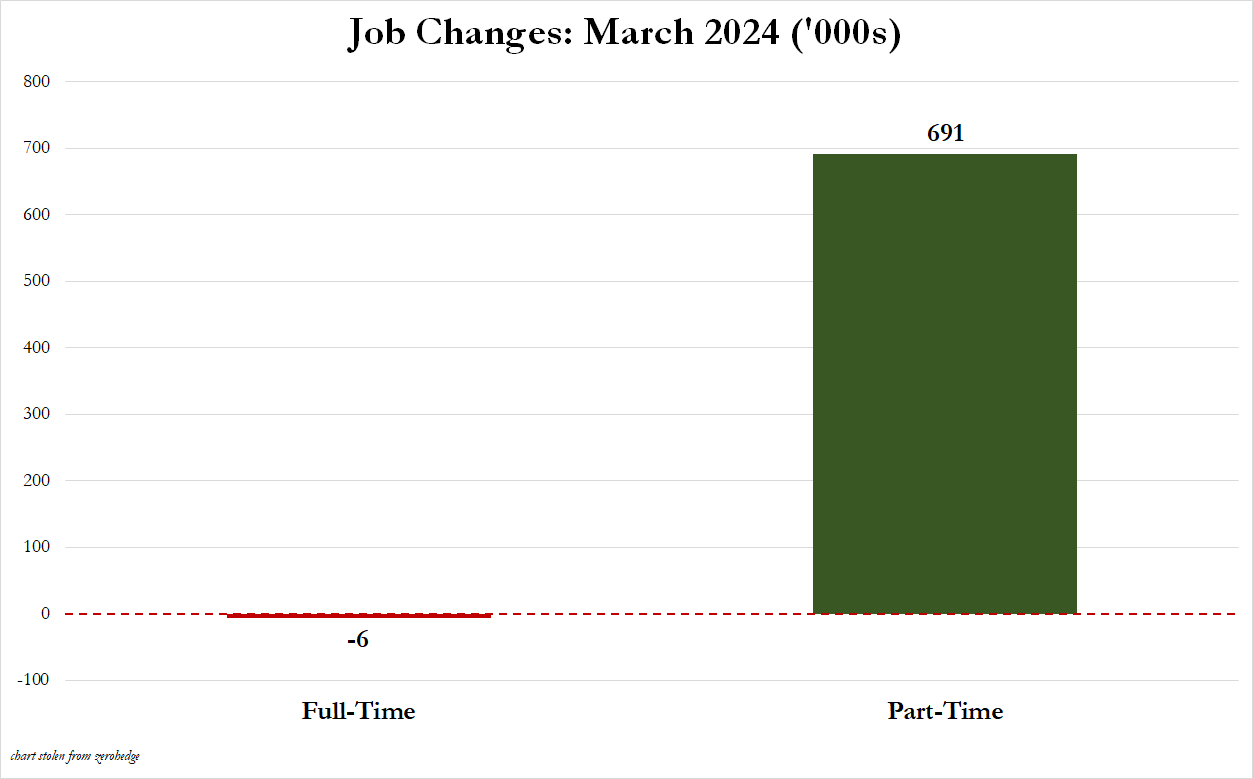
Finally, for those wondering if the jobs were all part-time, the answer is a resounding yes: in March, full-time jobs dropped by 6,000 as Part-time jobs soared by 691,000.
What was Wall Street's reaction? Here are some hot takes, starting with Bloomberg's Enda Curran who writes that since it’s an election year, these numbers will be trumpeted by the White House as evidence of their stewardship. The downside however is that they lean against calls for a rate cut, "something of a double-edged political sword."
Echoing this, Torsten Slok, Apollo's resident in house permabear who will never relax until you have sold all your assets to, well, Apollo writes that the number confirms the Fed will not cut rates this year:
“The source of this strength is easy financial conditions. The stock market is up +$10trn over the past five months, which is a significant wealth gain for household balance sheets. Credit spreads are tighter for IG, HY, and loans. Big rebound in IG issuance and HY issuance in January, February, and March. IPO activity is coming back and M&A activity is coming back. These factors will all support consumer spending, capex spending, and hiring over the coming quarters... We are sticking to our view that the Fed will not cut interest rates this year.”
Here is Seema Shah, chief global strategist, Principal Asset Management:
“At first sight, the jobs report leans against three cuts. Yet the average hourly earnings figures are in line with expectations and, as Powell has made quite clear in recent speeches, a strong labor market is not a concern if price pressures are moderating... Next week’s CPI report is the one that is pivotal for rate expectations. But today’s report should reassure markets that, if the Fed does not cut in June, it’s because the economy is still strong and earnings should remain in an upswing.”
Priya Misra, portfolio manager at JP Morgan Investment Management, says:
“If service inflation shows signs of picking up in the CPI and PCE reports later this month, Fed ‘patience’ might run thin. The market reaction makes sense to me – higher rates and weaker risk sentiment. I think risk assets are paying attention to rates now. Risk assets ignored the rates move until this week since Jan and Feb could be glossed over as noise. But if the economy is staying too hot, the market should question Fed cuts and the specter of Fed hikes comes back to the market.”
Ed Al-Hussainy, rates strategist at Columbia Threadneedle Investment, says:
“The key question is whether the combination of higher demand growth, momentum in employment, and the easing of financial conditions since last October start to show up in inflation. We’ll get another look at that in CPI/PPI data next week.”
Ali Jaffery, an economist at CIBC Capital Markets, sees immigration playing a role in today’s numbers:
“This has raised the sustainable level of job gains from 100K before the pandemic to about 180K. Today’s data is likely more evidence of that trend and supports the Fed’s view that the increase in labor supply is driving growth in the job market and the economy more broadly. Overall, the March employment report leans against an earlier cut by the Fed.”
Bryce Doty of Sit Investment Associates:
“Incredibly strong jobs data puts the bond market in panic mode over Fed cuts being delayed."
But...
“I keep scratching my head wondering why so many people are deciding to get jobs now when millions of job openings have been available for at least a couple of years. It’s not as though the economy suddenly produced these jobs. So people joining the workforce now must need the jobs. As a result, I’m cautious about how strong the jobs data really is for the economy. We expect a quarter point cut in the third quarter and a half point cut in the fourth quarter.”
We close again with Bloomberg's Enda Curran who writes that "at face value, these job numbers hardly lend themselves to a near-term rate cut."
Bottom line: strong report, until you look under the surface. For now, however, it will serve the White House to pitch Bidenomics as some miraculous economic panacea, while the market will try to soothe itself that the number was good, but not hot enough to prevent Powell from cutting rates in June.
International
Proposal To Move Bank Regulation Goalposts Signals Underlying Problems In Financial System
Proposal To Move Bank Regulation Goalposts Signals Underlying Problems In Financial System
Authored by Mike Maharrey via Money Metals,
If…
Share this:


Authored by Mike Maharrey via Money Metals,
If a formula spits out a number you don't like, just change the formula so you get a better number!
That’s exactly what the Bureau of Labor Statistics did to the Consumer Price Index formula in the 1990s. Because the CPI kept indicating price inflation was too high, the BLS tweaked the formula to spit out a lower inflation number.
Now the International Swaps and Derivatives Association (ISDA) is trying to talk the Federal Reserve into changing the formula for the supplementary leverage ratio (SLR) to make bank balance sheets look better.
This proposal sends some alarming messages about the stability of the banking system and confidence in U.S. government debt.
What Is the SLR and Why Do They Want to Change It?
The SLR is calculated by dividing the bank’s tier 1 capital (capital held in a bank's reserves and used to fund business activities for the bank's clients) by all assets on the bank’s balance sheet, including U.S. Treasuries and deposits at Federal Reserve Banks.
Banks use the SLR to calculate the amount of equity capital they must hold relative to their total leverage exposure. Regulations imposed after the 2008 financial crisis require category I, II, and III banks to maintain an SLR of 3 percent. “Globally Systemically Important Banks” are required to keep an extra 2 percent SLR buffer.
During the pandemic, the Fed temporarily altered SLR requirements, allowing banks to exclude Treasuries and reserves from the formula’s denominator. This made it easier to maintain the required SLR ratio.
As a Federal Reserve note explained, the banking system “exhibited considerable strains” during the reign of COVID-19. As the pandemic unfolded and governments began shutting down economies, banks quickly liquidated risky assets and increased their cash holdings. This resulted in a “sharp increase in bank deposits.”
According to the Fed note, “The associated rise in the overall balance sheets had the potential of causing their tier 1 capital levels to fall below the amount required by the SLR, which could have resulted in banks limiting their provision of financial services.”
To provide some relief, the central bank made temporary changes to the SLR formula effective April 1, 2020. The emergency rule allowing banks to exclude U.S. Treasuries from the calculation expired a year later.
In a letter addressed to the Federal Reserve, along with the FDIC, and the Office of the Comptroller of Currency, the ISDA urged these government agencies to make that “temporary, emergency” rule change permanent.
“To facilitate participation by banks in U.S. Treasury markets—including clearing U.S. Treasury security transactions for clients—the Agencies should revise the SLR to permanently exclude on-balance sheet U.S. Treasuries from total leverage exposure, consistent with the scope of the temporary exclusion for U.S. Treasuries that the Agencies implemented in 2020.”
The proposed rule change would allow banks to exclude both “on-balance sheet U.S. Treasuries that a bank holds in inventory or as part of its liquidity portfolio, as well as U.S. Treasuries the bank has received in a repo-style transaction to the extent the bank records the U.S. Treasuries on its balance sheet.”
This raises a question: does this indicate that the banking system is under “considerable strain?”
What Would a Change to the SLR Mean in Practice?
According to the ISDA, the change would “promote the stability of the U.S. Treasury market.” The organization also said it would more broadly “help support market liquidity in the context of projected increases in the size of the U.S. Treasury market and the importance of bank participation in the market.”
From a practical standpoint, it would incentivize banks to buy and hold more U.S. Treasuries by allowing them to hold them on their balance sheet without impacting their SLR. This would be good news for the U.S. Treasury Department, given that is selling billions of dollars in Treasuries every month to cover the massive government budget deficits.
The impact would be similar to quantitative easing.
In effect, the proposed change in the SLR would boost demand for Treasuries, driving prices higher and interest rates lower than they otherwise would be. Given the impact of Treasury yields on the broader bond market, it would also likely push other borrowing costs lower.
It would also enable banks to lend more money than they otherwise could under the current SLR scheme. This is a form of money creation and would have an inflationary effect.
European Investment Bank senior policy analyst Antonio Carlos Fernandes called this proposal “alarming.”
In an article published by Medium, Fernandes identifies several reasons banks would love to adjust the SLR requirements to exclude U.S. Treasuries.
- Treasuries are generally considered “risk-free” assets because they are backed by the “full faith and credit” of the U.S. government. The proposal to exclude them from the leverage ratio requirement implies banks perceive them as more risky. This could “potentially undermine confidence in U.S. government debt."
- The SLR is intended to backstop risk-based capital requirements and to ensure banks don’t become overleveraged, even with “safe” assets. The carveout for Treasuries would weaken these protections.
- The formula change would incentivize banks to load up on U.S. Treasuries. Fernandes called this a “concentration of risk” that would “heighten the interconnectedness between the banking system and government debt, posing systemic risks.”
- The request to exclude Treasuries from the SLR could signal “broader anxiety” about the U.S. fiscal situation and government debt levels. Given the spending problem in Washington D.C., this anxiety is certainly justified.
Fernandes summed up the situation this way:
“Any perception that banks require special exemptions for holding U.S. government debt could shake global confidence in Treasuries as a safe haven asset and could impact the status of the U.S. dollar.”
Trouble in the Banking System?
This proposal also casts doubt on the notion that the banking system is “sound and resilient.”
A year ago, rising interest rates precipitated a banking crisis kicked off by the collapse of Silicon Valley Bank. The Fed managed to paper over the problem with a bailout program.
Through the Bank Term Funding Program (BTFP), banks, savings associations, credit unions, and other eligible depository institutions were able to take out short-term loans (up to one year) using U.S. Treasuries, agency debt, mortgage-backed securities, and other qualifying assets as collateral.
Instead of valuing these collateral assets at their market value, banks were able to borrow against them “at par” (Face value). It would be like the bank extending you a second mortgage based on the original value of your house after a flood caused significant damage. Normal people would never get this kind of sweetheart deal.
The BTFP was set up to address a specific problem that took down Silicon Valley Bank and two other financial institutions.
SVB went under because it tried to sell its undervalued bonds to raise cash. The plan was to sell the longer-term, lower-interest-rate bonds and reinvest the money into shorter-duration bonds with a higher yield. Instead, the sale dented the bank’s balance sheet with a $1.8 billion loss driving worried depositors to pull funds out of the bank.
The BTFP gave banks facing similar problems an alternative. They could quickly raise capital against their bond portfolios without realizing big losses in an outright sale. It gave banks a way out, or at least the opportunity to kick the can down the road for a year.
Fernandes said the timing of this ISDA proposal should raise some questions about the global banking system.
“With the conclusion of the BTFP, are banks signaling a potential banking crisis on the horizon? Or perhaps, even more significantly, are they indicating concerns about an impending international financial crisis, given the central role that U.S. Treasuries play in the global financial markets?"
Money Metals President Stefan Gleason said these are just “more games” to try to make banks look safer than they really are, “even though they have a lot of exposure to U.S. bonds."
“Especially after they've experienced big value declines and an erosion in bank equity, causing their measured leverage to increase.”
Gleason is right. When you dig beneath all of the technical, regulatory mumbo-jumbo, this is just another example of the powers that be moving the goalposts to keep the game tilted in their favor.
International
Foreign investment in China’s biotechs continues big drop
Outside biotech money isn’t pouring into China like it used to.
In 2020 and 2021, venture investors put nearly $8 billion into Chinese biopharmas. But…
Share this:


Outside biotech money isn’t pouring into China like it used to.
In 2020 and 2021, venture investors put nearly $8 billion into Chinese biopharmas. But in the years that followed, those amounts have plunged as investors have sharply pulled back from China, according to data from DealForma. Private investments last year totaled a mere $600 million. And the decline has been echoed in the public market as well: A November report from McKinsey suggests that among 35 listed China biotechs, $80 billion in market cap had been erased since the peak.
The pullback by outside-China biopharma investors echoes a broader drop in foreign direct investment in the country amid geopolitical tensions with the US. And while American biotechs are slowly emerging from a post-pandemic slump, the recovery for their Chinese counterparts appears more elusive.
“There’s a big disconnect between people’s theses five years ago and what we’re facing right now,” said Yiqi Liu, senior investment analyst at Exome Asset Management, a New York-based asset management company that invests in public markets “across the worldwide healthcare industry.” While the firm does not publicly comment on portfolio exposure, it says it remains “conservative but diligent regarding our stock selections in China.”
The US-China tensions have only been exacerbated by US lawmakers’ attempts to limit the work between American biotech and pharma companies, and the WuXi family of companies and companies affiliated with sequencing giant BGI. Even as disclosures from US biopharmas underscore their reliance on WuXi’s services, a recent report alleging WuXi transferred a US client’s intellectual property to Chinese authorities has raised new concerns about IP protection.
In an environment where cross-border connections are viewed with increasing suspicion, some China-originated companies have chosen to play down their China roots, with I-Mab taking the dramatic step of splitting its China operations to focus on the US.
Source: DealForma

Click on the image to see the full-sized version
The reset follows a decade of rapid growth — financially and scientifically — of China’s biopharma sector.
 Roderick Wong
“It’s extra-tough probably for a lot of folks investing in China, whether you’re a locally China-based investor or a global investor, because it’s kind of the first bear market you’ve seen in China for biotech since the innovative sector really grew,” Roderick Wong, managing partner of RTW Investments, told Endpoints in February.
The start of the boom in outside investments came from a 2018 reform in the listing rules on the Hong Kong stock exchange, opening the door to IPOs by preclinical- or clinical-stage biotech companies that had yet to earn any revenue. Such companies had previously been barred from going public, and the change opened the floodgates to risk-taking capital from both foreign and domestic investors.
 Helen Chen
“When the Hong Kong stock exchange opened up the pre-revenue chapter in 2018, it accelerated the exit process for many of the investors in these companies,” observed Helen Chen, Greater China managing partner and global sector co-head at LEK Consulting. The firm’s Shanghai team advises both investors and life sciences companies on China strategies. “So in some ways, some of the investors may have loosened their standards, because they were anticipating much shorter exit periods.”
But investment returns on the Hong Kong exchange have been subpar, with the Hang Seng Hong Kong-listed Biotech Index plummeting close to 70% over the past three years and down more than 30% in the past year. That compares with a roughly 10% drop on the S&P Biotech ETF $XBI since then — and a post-pandemic rebound over the last year.
Meanwhile, the prospect of M&A, a major exit path for biotechs in the US and Europe, looks equally dim. Large Chinese biopharma companies have limited dry powder, while multinationals may be deterred by regulatory and geopolitical risks, according to the McKinsey report.
The exception has been AstraZeneca, which made a historic move with its $1 billion acquisition of cell therapy developer Gracell Biotechnologies in December — but most sources Endpoints spoke to viewed it as the exception, not the rule.
 Leon Tang
“Except for the Gracell-AZ M&A deal, you don’t find an M&A deal with biopharma and China biotech at all,” said Leon Tang, founder of InScienceWeTrust BioAdvisory, a boutique consulting firm founded in 2022 to advise companies on cross-border business development.
Exome had participated in a private placement in Gracell months before the buyout in the hopes that the biotech would generate more promising data on its early clinical program and eventually attract a big pharma partner much like Legend did. The buyout came as a “surprise,” Liu said.
As pricing pressures in the Chinese market keep domestic commercial expectations modest, the “China for global” strategy has become a key value proposition for foreign investors who find it hard to predict changes in the macroenvironment — and an alternative source of cash for companies.
Export of Chinese innovation “has been booming,” Tang said. Antibody-drug conjugates have become a favorite example for many, as drugmakers from Merck to BioNTech turn to Chinese players for their chemistry expertise.
In the meantime, the funding situation for Chinese biotechs may remain challenging for a little longer, leading to hiring freezes or lower R&D budgets. Domestic investors could plug the gap, although sources say many of them tend to focus more on cash flow-positive companies these days.
Top-tier venture investment funds such as OrbiMed, Sequoia, Qiming and Lilly Asia Ventures are “still continuing to search,” LEK’s Chen said. “But certainly they’re more careful.”
etf pandemic preclinical therapy recovery hong kong europe chinaGovernment
US Employment Data to Set Dollar’s Course
Overview: The
focus is squarely on the US employment report. At the risk of oversimplifying,
given the position adjustment in the past 48 hours, a solid…
Share this:


Overview: The focus is squarely on the US employment report. At the risk of oversimplifying, given the position adjustment in the past 48 hours, a solid report can see the greenback recover, while a disappointing report will likely see it deepen the correction of the rally that began with the February jobs report. The dollar recovered in the North American afternoon yesterday and many observers attributed it to the bevy of Fed comments. Yet, the interest rate market saw little reaction. It seemed that it was the dramatic reversal in US equities that helped dragged global shares down today, that forced US rates lower. Asia Pacific equities tumbled, led by more than 1% losses in Japan and South Korea. Europe's Stoxx 600 is off around 1.2%, and if sustained, could be its biggest loss so far this year. European benchmark yields are 1-3 bp firmer. The 10-year Treasury yield is up a couple of basis points to 4.33%. It settled near 4.20% a week ago.
The dollar is narrowly mixed against the G10 currencies, with the rally in oil giving the Norwegian krone the biggest lift (~0.3%), while the Swiss franc is the softest (~-0.2%). Emerging market currencies are mostly firmer. The timing of the reversal coincided with reports of Israeli Prime Minister Netanyahu signaling an escalation of the Middle East crisis by warning of confrontation with Iran and its proxies. May WTI bottomed near $84.65 shortly after midday in NY and within a few hours had reached through $87.20. It is consolidating in a narrow range above $86.35 after yesterday's big outside up day. Gold retreated to about $2268 today but has rebounded back above $2290 today.
Asia Pacific
The 1.5% month-over-month rise in Japanese retail sales in February hinted today's better household spending report. In February, household spending fell by 0.2% year-over-year; considerably better than the 2.9% decline median forecast in Bloomberg's survey. It is the smallest decline since last February when household spending rose by 1.6% year-over year. Spending rose by 1.4% month-over-month, the first increase since last September. As measured by GDP figures, Japanese consumption fell in the last three quarters last year, and economists in Bloomberg's survey anticipate a small decline in Q1 24. Looking ahead, the energy subsides are reduced this month and end next month. In June, income tax cuts will be implemented. Note that February labor earnings are due first thing Monday, but it is too early to see the impact of the annual wage round. Besides the wage data and February's current account, which is also to be announced Monday, the highlight of the week may be Prime Minister Kishida's visit to Washington. Security issues will be paramount. We had thought there was a reasonably good chance that Japan would be invited to join the AUKUS arrangement in some capacity. However, with Philippines' President Marcos also arriving for a triparty summit on April 11, a new security initiative may be announced.
Australia recorded an A$122.7 bln trade surplus in 2023, down from A$139.9 bln in 2022. It is off to a slower start this year. The February trade surplus, reported earlier today, of A$7.28 bln was considerably smaller than expected (~A$10.5 bln). That means that in the first two months of the year, Australia's surplus is running nearly 20% lower than in the Jan-Feb 2023 period. Goods exports fell by 2.2% while imports rose by 4.8% in February. Goods exports fell by an average of 0.4% a month last year, and that includes an average increase of 1.3% in Q4 23. Exports rose by 1.2% on average a month in 2022. Goods imports were flat last year, and that includes an average monthly decline of 2.5% in Q4 24. Australia's terms of trade (ratio of export and import prices) set a historic high in Q2 22 and deteriorated last year.
The dollar was confined to a narrow range against the yen for most of yesterday (~JPY151.55 to JPY151.85). It broke down as cross positions were unwound and fell to almost JPY151.10. The losses were extended in early Asia Pacific trading to about JPY150.80 after the better-than-expected Japanese spending data. The exchange rate did not react to Prime Minister Kishida's threat to act against "excessive yen moves," or BOJ Governor Ueda's suggestion in an interview that summer-fall time period for another hike. In fact, the dollar has gradually recovered to around JPY151.40 today. Still, the inability for the dollar to take out JPY152 shows the power of the communication channel rather than material intervention. Like China's push back against the weakening of the yuan, the broadsides about race to the bottom, seem misplaced. The Australian dollar powered through a trendline that connects the late December high (~$0.6870), the March 8 high (~$0.6670), and the March 21 high (~$0.6635). It came in slightly below $0.6600 yesterday. Despite the intraday penetration, the Aussie's gains were pared in the North American afternoon, and it settled near $0.6585, but still above Wednesday's high (~$0.6570). It has traded in about a third of a cent range today below $0.6600. On a strong US employment report, the Aussie could fall back toward the $0.6535 area. The dollar was so close to the upper end of its band against the yuan that before the yesterday and today's holiday some very short-dated swaps, which implied a move outside the band, were rejected. However, since it is arguably a dollar move taking place, a soft US jobs report, would likely take some pressure off the PBOC. The greenback slipped to an eight-day low against the offshore yuan (~CNH7.2410) but remains above the onshore band (CNY6.9530-CNY7.2368). Monday's fix will be important.
Europe
A notable recent development in the eurozone is the outperformance of the periphery compared with Germany and France. This was evident in March PMI. Italy and Spain's composite readings were above 50 while Germany and France remained below. This divergence was also, at least partially, evident underneath today's news that February retail sales fell by 0.5%, a little more than expected. It was also seen in the today's data. French industrial output rose 0.2% in February, half of what was expected. Spain's industrial output rose by 0.7%, well above the 0.2% median forecast in Bloomberg's survey. Germany reported February factory orders eked out a 0.2% increase. The market had expected a 0.7% rise. However, even this small gain was marred by the downward revision to January's series to show a 11.4% drop instead of 11.3%.
Italy's 10-year premium over Germany dropped from over 200 bp last October to almost 120 bp in the middle of last month. That was the least since late 2021. It recovered and reached almost 145 bp earlier this week and is back around 140 bp now. Spain's premium has a similar broad pattern. It premium over Germany peaked last October near 115 bp. It slipped below 80 bp in the middle of March, the least in two years. It widened a little into the end of the quarter but is narrowing again and is near 84 bp. Within the eurozone this year, only Cypriot 10-year bonds have outperformed Italy's BTPs (-7 bp vs. +10 bp). Next week's highlight is the ECB's meeting. The most that can be reasonably hoped for is more guidance from President Lagarde for a cut soon (June meeting next). The swaps market has nearly completely priced out a cut at next week's meeting. It has been last fully discounted at the end of July and has not been more than half priced in since mid-February.
The UK's manufacturing and services PMI have entered expansion territory above 50 and the construction PMI, released earlier today joined them with a 50.2 reading for the first time since last August. It has risen for four consecutive months. Still, the swaps market has boosted the chances of a June cut to about 80%, among the highest in two months. The highlight next week is February's monthly GDP print. In February, the Bank of England projected 0.1% growth in Q1 24, but this looks a bit conservative. Given the 0.2% expansion in January, it would seem to imply weakness in February and March.
A little before the last US jobs report, the euro was near $1.0980. The three-day rally through yesterday saw the euro recover from $1.0725 to almost $1.0880. The (61.8%) retracement of the euro's loss since the March high is slightly higher near $1.0885. The euro surrendered its gains and returned to the $1.0830 area. It is consolidating in about a fifth-of-a-cent range below $1.0845. A disappointing US employment report could see the euro test the $1.0920-30 area, while a solid report could perhaps see the $1.0780. There are options for about 1.5 bln euros at $1.08 that expire today. Sterling rose to a two-week high near $1.2685 and met the (38.2%) retracement target ($1.2675) of the decline since the last US jobs report, before reversing lower, falling to about $1.2635. Today, it is in about a third-of-a-cent range below $1.2650. It had bottomed Monday and Tuesday near $1.2540. Sterling had set the Q1 24 high slightly before the last US employment report in early March near $1.29. The next retracement target (50%) is near $1.2715 and disappointing US data could spur a run toward it. Favorable US data could see sterling push below $1.2580.
America
The US dollar's setback in recent days is reminiscent of what happened last month. The Dollar Index sold off by about 1.5% in the couple of days leading up to the February jobs report. It set a six-week low (~102.35) shortly before the jobs report before launching a rally that carried it to a new high for the year (~105.10) earlier this week. Since the high, the Dollar Index has pulled back by about 1.2%. Dollar bullish short-term momentum players and trend-followers have likely moved to the sidelines. Like last month, a solid jobs report can see the dollar recover. Some observers talk about a seasonally weak job growth in March, but in the past 20 years, it has been a 50/50 split between times when March nonfarm payroll growth was stronger than February and weaker.
The pandemic may have changed the pattern, and the data are seasonally adjusted. In the last two years, March job growth was weaker than February's by an average of about 255k. The median forecast in Bloomberg's survey looks for US businesses to have added around 62k fewer jobs last month than February (213k vs. 275k). Average hourly earnings are expected to rise by 0.3%, and that would bring the Q1 increase at an annualized rate to 3.6% after a 4.0% pace in Q4 23 and a 4.4% increase in Q1 23. However, the relationship between nominal wage growth and CPI/PCE deflator is tenuous. Productivity matters, of course, and most economists still seem to be working on assumptions of competitive capitalism instead of what exists today, oligopolies and monopsonies. Moreover, next week's March CPI will likely see the year-over-year headline rate accelerate and the core rate stable or slightly lower. The net effect, we suspect, between the employment and CPI, will do little for the Fed's confidence.
Canada reports its March jobs data as well, but it tends to be overwhelmed by the US report. Canada created an average of about 39k jobs a month in January and February, which is on par with the recent pace (34k in 2022 and 37k in 2023). Of the jobs created this year, about 30k on average were full-time posts, slightly better than the 28k average last year and somewhat softer than the 37k average in 2022. Still, Canada's challenge is that the labor force growth is faster than job creation, resulting in rising unemployment. The unemployment rate was at 5.0% from December 2022 through April 2023. It has risen steadily since then and has been at 5.8% for three of the four months through February. The median forecast in Bloomberg's survey is for it to have ticked up to 5.9% in March.
The US dollar initially extended its recent losses and slipped slightly below CAD1.3480 to record a two-week low. There are options for about $1.25 bln between CAD1.3500 and CAD1.3510 that expire today. However, in the North American afternoon, the greenback staged a broad recovery and set new session highs against slightly above CAD1.3560, leaving a potentially bullish hammer candlestick pattern in its wake. Follow-through gains today has seen the US dollar rise to CAD1.3580. A solid US jobs report could see the recent highs near CAD1.3615. There are options for about $635 mln at CAD1.36 that expire today. The greenback traded below MXN16.50 yesterday for the first time since the end of 2015 but reversed higher to a new session high near MXN16.6150. It has traded between MXN16.55 and MXN16.61 today. This week's high is closer to MXN16.67. The 20-day moving average is around MXN16.68 and the dollar has not above it since the end of February. The dollar had set a new high for the year against the Brazilian real on Wednesday a little above BRL5.09. It reversed lower and settled on the lows. Follow-through selling took the greenback to about BRL5.0050 yesterday before the broad recovery, which lifted the dollar to new session highs above BRL5.05.
unemployment pandemic bonds equities fed currencies us dollar euro yuan governor gdp recovery unemployment gold oil iran japan canada european europe uk france spain italy germany china


Experiencing extreme weather predicts support for policies to mitigate effects of climate change


MSM Trots Out ‘Bird Flu-Pocalypse’ After Texas Dairy Worker Falls Ill


CDC Releases Hidden Trove Of COVID-19 Vaccine Injury Reports


New Report Details Horrifying Cost Of Fauci’s Failures


Japanese yen flirting with 152


Why rural white Americans’ resentment is a threat to democracy


US Employment Data to Set Dollar’s Course


March Jobs Come In Red-Hot At 303K, Above Highest Estimate, As Unemployment Rate Drops
-

 International2 weeks ago
Parexel CEO to retire; CAR-T maker AffyImmune promotes business leader to chief executive
-

 Spread & Containment3 weeks ago
IFM’s Hat Trick and Reflections On Option-To-Buy M&A
-

 International4 weeks ago
EyePoint poaches medical chief from Apellis; Sandoz CFO, longtime BioNTech exec to retire
-

 International4 weeks ago
Walmart launches clever answer to Target’s new membership program
-

 Uncategorized3 days ago
Vaccinated People Show Long COVID-Like Symptoms With Detectable Spike Proteins: Preprint Study
-

 Uncategorized1 month ago
Evidence And Insights About Gold’s Long-Term Uptrend
-

 Spread & Containment2 weeks ago
Japanese Preprint Calls For mRNA VaccinesTo Be Suspended Over Blood Bank Contamination Concerns
-

 Spread & Containment2 days ago
Oura Ring launches genius new feature to take on Apple Watch