LENDINGTREE REPORTS FIRST QUARTER 2022 RESULTS
LENDINGTREE REPORTS FIRST QUARTER 2022 RESULTS
PR Newswire
CHARLOTTE, N.C., May 5, 2022
Revenue and VMM Growth Continued Despite Ongoing Macro Headwinds
Consolidated revenue of $283.2 million GAAP net loss from continuing operations of $10.8 millio…
Share this:


LENDINGTREE REPORTS FIRST QUARTER 2022 RESULTS
PR Newswire
CHARLOTTE, N.C., May 5, 2022
Revenue and VMM Growth Continued Despite Ongoing Macro Headwinds
- Consolidated revenue of $283.2 million
- GAAP net loss from continuing operations of $10.8 million or $(0.84) per diluted share
- Variable marketing margin of $94.1 million
- Adjusted EBITDA of $29.4 million
- Adjusted net income per share of $0.46
CHARLOTTE, N.C., May 5, 2022 /PRNewswire/ -- LendingTree, Inc. (NASDAQ: TREE), operator of LendingTree.com, the nation's leading online financial services marketplace, today announced results for the quarter ended March 31, 2022.
The company has posted a letter to shareholders on the company's website at investors.lendingtree.com.
"The diversity of our business continues to benefit shareholders as we grew revenue and VMM this quarter despite rapidly increasing interest rates and persistent inflationary headwinds," said Doug Lebda, Chairman and CEO. "We performed in line with our guidance across all metrics while continuing to invest in our strategic growth initiatives. The Home segment performed well, with improving volume and unit economics in home equity and purchase mortgage helping to offset the dramatic decline in refinance volume. Coupled with strong growth in the Consumer business, highlighted by fantastic results from personal loans and small business, our combined lender marketplace generated 9% and 23% YoY growth in revenue and VMM, respectively. The Insurance segment had improving results over the previous quarter, as our partners have been growing their budgets with us. We made the conscious decision to focus intently on consumer quality at the beginning of the industry's cyclical downturn last year, and we believe those efforts will continue to drive increased revenue and profitability for the business throughout 2022."
Trent Ziegler, CFO, added, "We remain in a position of strength to invest in our business, creating the premier customer financial shopping experience, while much of our competition struggle with profitability. We are leaning into this strength, maintaining the investment in our strategic priorities and the strength of our brand despite numerous macro headwinds. However, the persistency of inflation and its impact on our insurance partners, along with a significant jump in mortgage rates has to be acknowledged and reflected in our forecast. As a result, we are revising our financial outlook for 2022."
First Quarter 2022 Business Highlights
- Home segment revenue of $101.9 million decreased 20% over first quarter 2021 and produced segment profit of $35.9, down 8% over the same period.
- Within Home, mortgage products revenue of $78.0 million declined 33% over prior year.
- Consumer segment revenue of $101.1 million grew 75% over first quarter 2021 as trends continued to improve.
- Within Consumer, credit card revenue of $29.8 million was up 69% over prior year.
- Personal loans revenue of $35.2 million grew 137% over prior year.
- Revenue from our small business offering grew 138% over prior year.
- Insurance segment revenue of $80.0 million decreased 8% over first quarter 2021 and translated into Insurance segment profit of $21.1, down 36% over the same period.
- Through March 31, 2021, 22.1 million consumers have signed up for MyLendingTree.
LendingTree Summary Financial Metrics | |||||||||
Three Months Ended | Three Months Ended | ||||||||
2022 | 2021 | Y/Y | 2021 | QQ | |||||
Total revenue | $ | 283.2 | $ | 272.8 | 4 % | $ | 258.3 | 10 % | |
(Loss) income before income taxes | $ | (10.4) | $ | 28.0 | (137) % | $ | 60.2 | (117) % | |
Income tax expense | $ | (0.4) | $ | (8.7) | (95) % | $ | (11.8) | (97) % | |
Net (loss) income from continuing operations | $ | (10.8) | $ | 19.3 | (156)% | $ | 48.4 | (122)% | |
Net (loss) income from continuing operations % of revenue | (4)% | 7 % | 19 % | ||||||
(Loss) income per share from continuing operations | |||||||||
Basic | $ | (0.84) | $ | 1.48 | (157) % | $ | 3.67 | (123) % | |
Diluted | $ | (0.84) | $ | 1.37 | (161) % | $ | 3.57 | (124) % | |
Variable marketing margin | |||||||||
Total revenue | $ | 283.2 | $ | 272.8 | 4 % | $ | 258.3 | 10 % | |
Variable marketing expense (1) (2) | $ | (189.1) | $ | (183.8) | 3 % | $ | (169.8) | 11 % | |
Variable marketing margin (2) | $ | 94.1 | $ | 89.0 | 6% | $ | 88.5 | 6% | |
Variable marketing margin % of revenue (2) | 33% | 33% | 34% | ||||||
Adjusted EBITDA (2) | $ | 29.4 | $ | 30.7 | (4)% | $ | 24.7 | 19% | |
Adjusted EBITDA % of revenue (2) | 10% | 11% | 10% | ||||||
Adjusted net income (loss) (2) | $ | 6.1 | $ | 2.5 | 144% | $ | (4.1) | 249% | |
Adjusted net income (loss) per share (2) | $ | 0.46 | $ | 0.18 | 156% | $ | (0.31) | 248% | |
(1) | Represents the portion of selling and marketing expense attributable to variable costs paid for advertising, direct marketing and related expenses. Excludes overhead, fixed costs and personnel-related expenses. |
(2) | Variable marketing expense, variable marketing margin, variable marketing margin % of revenue, adjusted EBITDA, adjusted EBITDA % of revenue, adjusted net income and adjusted net income per share are non-GAAP measures. Please see "LendingTree's Reconciliation of Non-GAAP Measures to GAAP" and "LendingTree's Principles of Financial Reporting" below for more information. |
LendingTree Segment Results | |||||||||
Three Months Ended | Y/Y | Three Months Ended | QQ | ||||||
2022 | 2021 | 2021 | |||||||
Home (1) | |||||||||
Revenue | $ | 101.9 | $ | 128.1 | (20)% | $ | 96.3 | 6% | |
Segment Profit | $ | 35.9 | $ | 39.0 | (8)% | $ | 33.8 | 6% | |
Segment profit % of revenue | 35% | 30% | 35% | ||||||
Consumer (2) | |||||||||
Revenue | $ | 101.1 | $ | 57.9 | 75% | $ | 96.4 | 5% | |
Segment profit | $ | 42.5 | $ | 24.6 | 73% | $ | 40.8 | 4% | |
Segment profit % of revenue | 42% | 42% | 42% | ||||||
Insurance (3) | |||||||||
Revenue | $ | 80.0 | $ | 86.6 | (8)% | $ | 65.4 | 22% | |
Segment profit | $ | 21.1 | $ | 32.8 | (36)% | $ | 20.8 | 1% | |
Segment profit % of revenue | 26% | 38% | 32% | ||||||
Other (4) | |||||||||
Revenue | $ | 0.1 | $ | 0.1 | -% | $ | 0.2 | (50)% | |
(Loss) profit | $ | (0.1) | $ | (0.1) | -% | $ | 0.1 | (200)% | |
Total Revenue | $ | 283.2 | $ | 272.8 | 4% | $ | 258.3 | 10% | |
Total Segment profit | $ | 99.5 | $ | 96.3 | 3% | $ | 95.5 | 4% | |
Brand marketing expense (5) | $ | (5.4) | $ | (7.3) | (26)% | $ | (7.0) | (23)% | |
Variable marketing margin | $ | 94.1 | $ | 89.0 | 6% | $ | 88.5 | 6% | |
Variable marketing margin % of revenue | 33% | 33% | 34% | ||||||
(1) | The Home segment includes the following products: purchase mortgage, refinance mortgage, home equity loans, reverse mortgage loans, and real estate. |
(2) | The Consumer segment includes the following products: credit cards, personal loans, small business loans, student loans, auto loans, deposit accounts, and other credit products such as credit repair and debt settlement. |
(3) | The Insurance segment consists of insurance quote products. |
(4) | The Other category primarily includes marketing revenue and related expenses not allocated to a specific segment. |
(5) | Brand marketing expense represents the portion of selling and marketing expense attributable to variable costs paid for advertising, direct marketing and related expenses that are not assignable to the segments' products. This measure excludes overhead, fixed costs and personnel-related expenses. |
Financial Outlook
Today, the Company is providing revenue, variable marketing margin and adjusted EBITDA guidance for the second quarter of 2022 and revising our previous guidance for full-year 2022, as follows:
Second-quarter 2022:
- Revenue: $283 - $293 million
- Variable Marketing Margin: $100 - $106 million
- Adjusted EBITDA: $35 - $40 million
Full-year 2022:
- Revenue is now anticipated to be in the range of $1,150 - $1,190 million, representing growth of 5% - 8% over full-year 2021 results.
- Variable Marketing Margin is now expected to be in the range of $390 - $415 million.
- Adjusted EBITDA is now anticipated to be in the range of $140 - $150 million, up 4% - 11% over full-year 2021 results.
LendingTree is not able to provide a reconciliation of projected variable marketing margin or adjusted EBITDA to the most directly comparable expected GAAP results due to the unknown effect, timing and potential significance of the effects of legal matters and tax considerations. Expenses associated with legal matters and tax considerations have in the past, and may in the future, significantly affect GAAP results in a particular period.
Quarterly Conference Call
A conference call to discuss LendingTree's first quarter 2022 financial results will be webcast live today, May 05, 2022 at 9:00 AM Eastern Time (ET). The live audiocast is open to the public and will be available on LendingTree's investor relations website at investors.lendingtree.com. The call may also be accessed toll-free via phone at (877) 606-1416. Callers outside the United States and Canada may dial (707) 287-9313. Following completion of the call, a recorded replay of the webcast will be available on LendingTree's investor relations website until 12:00 PM ET on Friday, May 13, 2022. To listen to the telephone replay, call toll-free (855) 859-2056 with passcode #3228754. Callers outside the United States and Canada may dial (404) 537-3406 with passcode #3228754.
LENDINGTREE, INC. AND SUBSIDIARIES | ||
Three Months Ended | ||
2022 | 2021 | |
(in thousands, except per share | ||
Revenue | $ 283,178 | $ 272,750 |
Costs and expenses: | ||
Cost of revenue (exclusive of depreciation and amortization shown separately below) (1) | 15,561 | 13,895 |
Selling and marketing expense (1) | 204,157 | 197,462 |
General and administrative expense (1) | 35,973 | 34,989 |
Product development (1) | 14,052 | 12,468 |
Depreciation | 4,854 | 3,718 |
Amortization of intangibles | 7,917 | 11,312 |
Change in fair value of contingent consideration | — | 797 |
Restructuring and severance (1) | 3,625 | — |
Litigation settlements and contingencies | (27) | 16 |
Total costs and expenses | 286,112 | 274,657 |
Operating loss | (2,934) | (1,907) |
Other (expense) income, net: | ||
Interest expense, net | (7,505) | (10,215) |
Other (expense) income | (1) | 40,072 |
(Loss) income before income taxes | (10,440) | 27,950 |
Income tax expense | (383) | (8,638) |
Net (loss) income from continuing operations | (10,823) | 19,312 |
Loss from discontinued operations, net of tax | (3) | (263) |
Net (loss) income and comprehensive (loss) income | $ (10,826) | $ 19,049 |
Weighted average shares outstanding: | ||
Basic | 12,901 | 13,070 |
Diluted | 12,901 | 14,119 |
(Loss) income per share from continuing operations: | ||
Basic | $ (0.84) | $ 1.48 |
Diluted | $ (0.84) | $ 1.37 |
Loss per share from discontinued operations: | ||
Basic | $ — | $ (0.02) |
Diluted | $ — | $ (0.02) |
Net (loss) income per share: | ||
Basic | $ (0.84) | $ 1.46 |
Diluted | $ (0.84) | $ 1.35 |
(1)Amounts include non-cash compensation, as follows: | ||
Cost of revenue | $ 393 | $ 397 |
Selling and marketing expense | 2,039 | 1,802 |
General and administrative expense | 9,600 | 12,171 |
Product development | 1,965 | 2,066 |
Restructuring and severance | 1,083 | — |
LENDINGTREE, INC. AND SUBSIDIARIES | ||
March 31, | December 31, | |
(in thousands, except par value | ||
ASSETS: | ||
Cash and cash equivalents | $ 196,658 | $ 251,231 |
Restricted cash and cash equivalents | 120 | 111 |
Accounts receivable, net | 114,294 | 97,658 |
Prepaid and other current assets | 26,995 | 25,379 |
Total current assets | 338,067 | 374,379 |
Property and equipment | 70,680 | 72,477 |
Operating lease right-of-use assets | 74,807 | 77,346 |
Goodwill | 420,139 | 420,139 |
Intangible assets, net | 77,847 | 85,763 |
Deferred income tax assets | 127,823 | 87,581 |
Equity investment | 173,140 | 158,140 |
Other non-current assets | 6,969 | 6,942 |
Non-current assets of discontinued operations | — | 16,589 |
Total assets | $ 1,289,472 | $ 1,299,356 |
LIABILITIES: | ||
Current portion of long-term debt | $ 169,484 | $ 166,008 |
Accounts payable, trade | 9,909 | 1,692 |
Accrued expenses and other current liabilities | 107,881 | 106,731 |
Current liabilities of discontinued operations | 4 | 1 |
Total current liabilities | 287,278 | 274,432 |
Long-term debt | 564,981 | 478,151 |
Operating lease liabilities | 93,759 | 96,165 |
Deferred income tax liabilities | 2,265 | 2,265 |
Other non-current liabilities | 341 | 351 |
Total liabilities | 948,624 | 851,364 |
Commitments and contingencies | ||
SHAREHOLDERS' EQUITY: | ||
Preferred stock $.01 par value; 5,000,000 shares authorized; none issued or outstanding Common stock $.01 par value; 50,000,000 shares authorized; 16,119,648 and 16,070,720 shares | — | — |
issued, respectively, and 12,764,182 and 13,095,149 shares outstanding, respectively | 161 | 161 |
Additional paid-in capital | 1,145,038 | 1,242,794 |
Accumulated deficit | (538,173) | (571,794) |
Treasury stock; 3,355,466 shares and 2,975,571, shares respectively | (266,178) | (223,169) |
Total shareholders' equity | 340,848 | 447,992 |
Total liabilities and shareholders' equity | $ 1,289,472 | $ 1,299,356 |
LENDINGTREE, INC. AND SUBSIDIARIES | ||
Three Months Ended | ||
2022 | 2021 | |
(in thousands) | ||
Cash flows from operating activities attributable to continuing operations: | ||
Net (loss) income and comprehensive (loss) income | $ (10,826) | $ 19,049 |
Less: Loss from discontinued operations, net of tax | 3 | 263 |
Net (loss) income from continuing operations | (10,823) | 19,312 |
Adjustments to reconcile net (loss) income from continuing operations to net cash provided by operating activities attributable to continuing operations: | ||
Loss on impairments and disposal of assets | 431 | 348 |
Amortization of intangibles | 7,917 | 11,312 |
Depreciation | 4,854 | 3,718 |
Non-cash compensation expense | 15,080 | 16,436 |
Deferred income taxes | 326 | 8,638 |
Change in fair value of contingent consideration | — | 797 |
Gain on investments | — | (40,072) |
Bad debt expense | 850 | 516 |
Amortization of debt issuance costs | 2,467 | 1,275 |
Amortization of debt discount | 879 | 7,346 |
Reduction in carrying amount of ROU asset, offset by change in operating lease liabilities | (49) | 7,132 |
Changes in current assets and liabilities: | ||
Accounts receivable | (17,488) | (33,743) |
Prepaid and other current assets | (3,666) | (915) |
Accounts payable, accrued expenses and other current liabilities | 9,320 | 7,154 |
Income taxes receivable | 48 | (89) |
Other, net | (146) | (240) |
Net cash provided by operating activities attributable to continuing operations | 10,000 | 8,925 |
Cash flows from investing activities attributable to continuing operations: | ||
Capital expenditures | (3,465) | (10,553) |
Equity investment | (15,000) | (1,180) |
Net cash used in investing activities attributable to continuing operations | (18,465) | (11,733) |
Cash flows from financing activities attributable to continuing operations: | ||
Payments related to net-share settlement of stock-based compensation, net of proceeds from exercise of stock options |
(3,085) |
(4,801) |
Purchase of treasury stock | (43,009) | — |
Payment of debt issuance costs | (4) | (168) |
Other financing activities | — | (31) |
Net cash used in financing activities attributable to continuing operations | (46,098) | (5,000) |
Total cash used in continuing operations | (54,563) | (7,808) |
Discontinued operations: | ||
Net cash used in operating activities attributable to discontinued operations | (1) | (71) |
Total cash used in discontinued operations | (1) | (71) |
Net decrease in cash, cash equivalents, restricted cash and restricted cash equivalents | (54,564) | (7,879) |
Cash, cash equivalents, restricted cash and restricted cash equivalents at beginning of period | 251,342 | 170,049 |
Cash, cash equivalents, restricted cash and restricted cash equivalents at end of period | $ 196,778 | $ 162,170 |
LENDINGTREE'S RECONCILIATION OF NON-GAAP MEASURES TO GAAP
Variable Marketing Expense
Below is a reconciliation of selling and marketing expense to variable marketing expense. See "LendingTree's Principles of Financial Reporting" for further discussion of the Company's use of this non-GAAP measure.
Three Months Ended | |||
March 31, 2022 | December 31, 2021 | March 31, 2021 | |
(in thousands) | |||
Selling and marketing expense | $ 204,157 | $ 184,847 | $ 197,462 |
Non-variable selling and marketing expense (1) | (15,081) | (15,053) | (13,760) |
Variable marketing expense | $ 189,076 | $ 169,794 | $ 183,702 |
(1) | Represents the portion of selling and marketing expense not attributable to variable costs paid for advertising, direct marketing and related expenses. Includes overhead, fixed costs and personnel-related expenses. |
LENDINGTREE'S RECONCILIATION OF NON-GAAP MEASURES TO GAAP
Variable Marketing Margin
Below is a reconciliation of net (loss) income from continuing operations to variable marketing margin and net (loss) income from continuing operations % of revenue to variable marketing margin % of revenue. See "LendingTree's Principles of Financial Reporting" for further discussion of the Company's use of these non-GAAP measures.
Three Months Ended | |||
March 31, 2022 | December 31, 2021 | March 31, 2021 | |
(in thousands, except percentages) | |||
Net (loss) income from continuing operations | $ (10,823) | $ 48,432 | $ 19,312 |
Net (loss) income from continuing operations % of revenue | (4)% | 19% | 7% |
Adjustments to reconcile to variable marketing margin: | |||
Cost of revenue | 15,561 | 14,448 | 13,895 |
Non-variable selling and marketing expense (1) | 15,081 | 15,053 | 13,760 |
General and administrative expense | 35,973 | 38,546 | 34,989 |
Product development | 14,052 | 13,723 | 12,468 |
Depreciation | 4,854 | 4,941 | 3,718 |
Amortization of intangibles | 7,917 | 9,771 | 11,312 |
Change in fair value of contingent consideration | — | — | 797 |
Restructuring and severance | 3,625 | 6 | — |
Litigation settlements and contingencies | (27) | 32 | 16 |
Interest expense, net | 7,505 | 14,986 | 10,215 |
Other income | 1 | (83,200) | (40,072) |
Income tax expense | 383 | 11,753 | 8,638 |
Variable marketing margin | $ 94,102 | $ 88,491 | $ 89,048 |
Variable marketing margin % of revenue | 33% | 34% | 33% |
(1) | Represents the portion of selling and marketing expense not attributable to variable costs paid for advertising, direct marketing and related expenses. Includes overhead, fixed costs and personnel-related expenses. |
LENDINGTREE'S RECONCILIATION OF NON-GAAP MEASURES TO GAAP
Adjusted EBITDA
Below is a reconciliation of net (loss) income from continuing operations to adjusted EBITDA and net (loss) income from continuing operations % of revenue to adjusted EBITDA % of revenue. See "LendingTree's Principles of Financial Reporting" for further discussion of the Company's use of these non-GAAP measures.
Three Months Ended | |||
March 31, 2022 | December 31, 2021 | March 31, 2021 | |
(in thousands, except percentages) | |||
Net (loss) income from continuing operations | $ (10,823) | $ 48,432 | $ 19,312 |
Net (loss) income from continuing operations % of revenue | (4)% | 19% | 7% |
Adjustments to reconcile to adjusted EBITDA: | |||
Amortization of intangibles | 7,917 | 9,771 | 11,312 |
Depreciation | 4,854 | 4,941 | 3,718 |
Restructuring and severance | 3,625 | 6 | — |
Loss on impairments and disposal of assets | 431 | 814 | 348 |
Gain on investments | — | (83,200) | (40,072) |
Non-cash compensation | 13,997 | 16,751 | 16,436 |
Franchise tax caused by equity investment gain | 1,500 | — | — |
Change in fair value of contingent consideration | — | — | 797 |
Acquisition expense | 9 | 430 | 29 |
Litigation settlements and contingencies | (27) | 32 | 16 |
Interest expense, net | 7,505 | 14,986 | 10,215 |
Income tax expense | 383 | 11,753 | 8,638 |
Adjusted EBITDA | $ 29,371 | $ 24,716 | $ 30,749 |
Adjusted EBITDA % of revenue | 10% | 10% | 11% |
LENDINGTREE'S RECONCILIATION OF NON-GAAP MEASURES TO GAAP
Adjusted Net Income
Below is a reconciliation of net (loss) income from continuing operations to adjusted net income (loss) and net (loss) income per diluted share from continuing operations to adjusted net income (loss) per share. See "LendingTree's Principles of Financial Reporting" for further discussion of the Company's use of these non-GAAP measures.
Three Months Ended | |||
March 31, 2022 | December 31, 2021 | March 31, 2021 | |
(in thousands, except per share amounts) | |||
Net (loss) income from continuing operations | $ (10,823) | $ 48,432 | $ 19,312 |
Adjustments to reconcile to adjusted net (loss) income: | |||
Restructuring and severance | 3,625 | 6 | — |
Loss on impairments and disposal of assets | 431 | 814 | 348 |
Gain on investments | — | (83,200) | (40,072) |
Non-cash compensation | 13,997 | 16,751 | 16,436 |
Franchise tax caused by equity investment gain | 1,500 | — | — |
Change in fair value of contingent consideration | — | — | 797 |
Acquisition expense | 9 | 430 | 29 |
Litigation settlements and contingencies | (27) | 32 | 16 |
Income tax (benefit) expense from adjusted items | (5,106) | 16,980 | 5,699 |
Excess tax expense (benefit) from stock-based compensation | 2,468 | (4,336) | (32) |
Adjusted net income (loss) | $ 6,074 | $ (4,091) | $ 2,533 |
Net (loss) income per diluted share from continuing operations | $ (0.84) | $ 3.57 | $ 1.37 |
Adjustments to reconcile net (loss) income from continuing operations to | |||
adjusted net income (loss) | 1.31 | (3.87) | (1.19) |
Adjustments to reconcile effect of dilutive securities | (0.01) | (0.01) | — |
Adjusted net income (loss) per share | $ 0.46 | $ (0.31) | $ 0.18 |
Adjusted weighted average diluted shares outstanding | 13,167 | 13,212 | 14,119 |
Effect of dilutive securities | 266 | (346) | — |
Weighted average diluted shares outstanding | 12,901 | 13,558 | 14,119 |
Effect of dilutive securities | — | 346 | 1,049 |
Weighted average basic shares outstanding | 12,901 | 13,212 | 13,070 |
LENDINGTREE'S PRINCIPLES OF FINANCIAL REPORTING
LendingTree reports the following non-GAAP measures as supplemental to GAAP:
- Variable marketing margin, including variable marketing expense
- Variable marketing margin % of revenue
- Earnings Before Interest, Taxes, Depreciation and Amortization, as adjusted for certain items discussed below ("Adjusted EBITDA")
- Adjusted EBITDA % of revenue
- Adjusted net income
- Adjusted net income per share
Variable marketing margin is a measure of the efficiency of the Company's operating model, measuring revenue after subtracting variable marketing and advertising costs that directly influence revenue. The Company's operating model is highly sensitive to the amount and efficiency of variable marketing expenditures, and the Company's proprietary systems are able to make rapidly changing decisions concerning the deployment of variable marketing expenditures (primarily but not exclusively online and mobile advertising placement) based on proprietary and sophisticated analytics. Variable marketing margin and variable marketing margin % of revenue are primary metrics by which the Company measures the effectiveness of its marketing efforts.
Adjusted EBITDA and adjusted EBITDA % of revenue are primary metrics by which LendingTree evaluates the operating performance of its businesses, on which its marketing expenditures and internal budgets are based and, in the case of adjusted EBITDA, by which management and many employees are compensated in most years.
Adjusted net income and adjusted net income per share supplement GAAP income from continuing operations and GAAP income per diluted share from continuing operations by enabling investors to make period to period comparisons of those components of the nearest comparable GAAP measures that management believes better reflect the underlying financial performance of the Company's business operations during particular financial reporting periods. Adjusted net income and adjusted net income per share exclude certain amounts, such as non- cash compensation, non-cash asset impairment charges, gain/loss on disposal of assets, gain/loss on investments, restructuring and severance, litigation settlements and contingencies, acquisition and disposition income or expenses including with respect to changes in fair value of contingent consideration, gain/loss on extinguishment of debt, one-time items which are recognized and recorded under GAAP in particular periods but which might be viewed as not necessarily coinciding with the underlying business operations for the periods in which they are so recognized and recorded, the effects to income taxes of the aforementioned adjustments and any excess tax benefit or expense associated with stock-based compensation recorded in net income in conjunction with FASB pronouncement ASU 2016-09. LendingTree believes that adjusted net income and adjusted net income per share are useful financial indicators that provide a different view of the financial performance of the Company than adjusted EBITDA (the primary metric by which LendingTree evaluates the operating performance of its businesses) and the GAAP measures of net income from continuing operations and GAAP income per diluted share from continuing operations.
These non-GAAP measures should be considered in addition to results prepared in accordance with GAAP, but should not be considered a substitute for or superior to GAAP results. LendingTree provides and encourages investors to examine the reconciling adjustments between the GAAP and non-GAAP measures set forth above.
Definition of LendingTree's Non-GAAP Measures
Variable marketing margin is defined as revenue less variable marketing expense. Variable marketing expense is defined as the expense attributable to variable costs paid for advertising, direct marketing and related expenses, and excluding overhead, fixed costs and personnel-related expenses. The majority of these variable advertising costs are expressly intended to drive traffic to our websites and these variable advertising costs are included in selling and marketing expense on the Company's consolidated statements of operations and consolidated income.
EBITDA is defined as net income from continuing operations excluding interest, income taxes, amortization of intangibles and depreciation.
Adjusted EBITDA is defined as EBITDA excluding (1) non-cash compensation expense, (2) non-cash impairment charges, (3) gain/loss on disposal of assets, (4) gain/loss on investments, (5) restructuring and severance expenses, (6) litigation settlements and contingencies, (7) acquisitions and dispositions income or expense (including with respect to changes in fair value of contingent consideration), and (8) one-time items.
Adjusted net income is defined as net income (loss) from continuing operations excluding (1) non-cash compensation expense, (2) non-cash impairment charges, (3) gain/loss on disposal of assets, (4) gain/loss on investments, (5) restructuring and severance expenses, (6) litigation settlements and contingencies, (7) acquisitions and dispositions income or expense (including with respect to changes in fair value of contingent consideration), (8) gain/loss on extinguishment of debt, (9) one-time items, (10) the effects to income taxes of the aforementioned adjustments, and (11) any excess tax benefit or expense associated with stock-based compensation recorded in net income in conjunction with FASB pronouncement ASU 2016-09.
Adjusted net income per share is defined as adjusted net income divided by the adjusted weighted average diluted shares outstanding. For periods which the Company reports GAAP loss from continuing operations, the effects of potentially dilutive securities are excluded from the calculation of net loss per diluted share from continuing operations because their inclusion would have been anti-dilutive. In periods where the Company reports GAAP loss from continuing operations but reports positive non-GAAP adjusted net income, the effects of potentially dilutive securities are included in the denominator for calculating adjusted net income per share if their inclusion would be dilutive.
LendingTree endeavors to compensate for the limitations of these non-GAAP measures by also providing the comparable GAAP measures with equal or greater prominence and descriptions of the reconciling items, including quantifying such items, to derive the non-GAAP measures. These non-GAAP measures may not be comparable to similarly titled measures used by other companies.
One-Time Items
Adjusted EBITDA and adjusted net income are adjusted for one-time items, if applicable. Items are considered one- time in nature if they are non-recurring, infrequent or unusual, and have not occurred in the past two years or are not expected to recur in the next two years, in accordance with SEC rules. For the periods presented in this report, there are no adjustments for one-time items, except for the $1.5 million franchise tax caused by the equity investment gain in Stash.
Non-Cash Expenses That Are Excluded From LendingTree's Adjusted EBITDA and Adjusted Net Income
Non-cash compensation expense consists principally of expense associated with the grants of restricted stock, restricted stock units and stock options. These expenses are not paid in cash and LendingTree includes the related shares in its calculations of fully diluted shares outstanding. Upon settlement of restricted stock units, exercise of certain stock options or vesting of restricted stock awards, the awards may be settled on a net basis, with LendingTree remitting the required tax withholding amounts from its current funds. Cash expenditures for employer payroll taxes on non-cash compensation are included within adjusted EBITDA and adjusted net income.
Amortization of intangibles are non-cash expenses relating primarily to acquisitions. At the time of an acquisition, the intangible assets of the acquired company, such as purchase agreements, technology and customer relationships, are valued and amortized over their estimated lives. Amortization of intangibles are only excluded from adjusted EBITDA.
Safe Harbor Statement Under the Private Securities Litigation Reform Act of 1995
The matters contained in the discussion above may be considered to be "forward-looking statements" within the meaning of the Securities Act of 1933 and the Securities Exchange Act of 1934, as amended by the Private Securities Litigation Reform Act of 1995. Those statements include statements regarding the intent, belief or current expectations or anticipations of LendingTree and members of our management team. Factors currently known to management that could cause actual results to differ materially from those in forward-looking statements include the following: uncertainty regarding the duration and scope of the coronavirus referred to as COVID-19 pandemic; actions governments and businesses take in response to the pandemic, including actions that could affect levels of advertising activity; the impact of the pandemic and actions taken in response to the pandemic on national and regional economies and economic activity; the pace of recovery when the COVID-19 pandemic subsides; adverse conditions in the primary and secondary mortgage markets and in the economy, particularly interest rates; default rates on loans, particularly unsecured loans; demand by investors for unsecured personal loans; the effect of such demand on interest rates for personal loans and consumer demand for personal loans; seasonality of results; potential liabilities to secondary market purchasers; changes in the Company's relationships with network lenders, including dependence on certain key network lenders; breaches of network security or the misappropriation or misuse of personal consumer information; failure to provide competitive service; failure to maintain brand recognition; ability to attract and retain consumers in a cost-effective manner; the effects of potential acquisitions of other businesses, including the ability to integrate them successfully with LendingTree's existing operations; accounting rules related to contingent consideration and excess tax benefits or expenses on stock-based compensation that could materially affect earnings in future periods; ability to develop new products and services and enhance existing ones; competition; allegations of failure to comply with existing or changing laws, rules or regulations, or to obtain and maintain required licenses; failure of network lenders or other affiliated parties to comply with regulatory requirements; failure to maintain the integrity of systems and infrastructure; liabilities as a result of privacy regulations; failure to adequately protect intellectual property rights or allegations of infringement of intellectual property rights; and changes in management. These and additional factors to be considered are set forth under "Risk Factors" in our Annual Report on Form 10-K for the period ended December 31, 2021 and in our other filings with the Securities and Exchange Commission. LendingTree undertakes no obligation to update or revise forward-looking statements to reflect changed assumptions, the occurrence of unanticipated events or changes to future operating results or expectations.
About LendingTree, Inc.
LendingTree, Inc. is the parent of LendingTree, LLC and several companies owned by LendingTree, LLC (collectively, "LendingTree" or the "Company").
LendingTree operates what it believes to be the leading online consumer platform that connects consumers with the choices they need to be confident in their financial decisions. The Company offers consumers tools and resources, including free credit scores, that facilitate comparison-shopping for mortgage loans, home equity loans and lines of credit, reverse mortgage loans, auto loans, credit cards, deposit accounts, personal loans, student loans, small business loans, insurance quotes and other related offerings. The Company primarily seeks to match in-market consumers with multiple providers on its marketplace who can provide them with competing quotes for loans, deposit products, insurance or other related offerings they are seeking. The Company also serves as a valued partner to partners and other providers seeking an efficient, scalable and flexible source of customer acquisition with directly measurable benefits, by matching the consumer inquiries it generates with these providers.
LendingTree, Inc. is headquartered in Charlotte, NC. For more information, please visit www.lendingtree.com.
Investor Relations Contact:
investors@lendingtree.com
Media Contact:
press@lendingtree.com
View original content to download multimedia:https://www.prnewswire.com/news-releases/lendingtree-reports-first-quarter-2022-results-301540616.html
SOURCE LendingTree, Inc.
Uncategorized
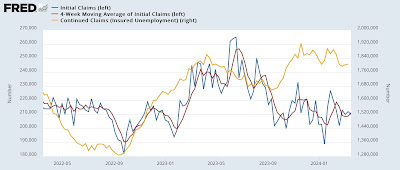
The positive streak of news from initial and continuing jobless claims continues
– by New Deal democratInitial and continuing claims once again continued their recent good streak. Initial claims declined -2,000 to 210,000, while…
Share this:

- by New Deal democrat

Because jobless claims can be used to forecast the “Sahm rule” for recessions, let’s update that as well.


International
Analysts issue unexpected crude oil price forecast after surge
Here’s what a key investment firm says about the commodity.
Share this:


Oil is an asset defined by volatility.
U.S. crude prices stood above $60 a barrel in January 2020, just as the covid pandemic began. Three months later, prices briefly went negative, as the pandemic crushed demand.
By June 2022 the price rebounded all the way to $120, as fiscal and monetary stimulus boosted the economy. The price fell back to $80 in September 2022. Since then, it has bounced between about $65 and $90.
Over the past two months, the price has climbed 15% to $82 as of March 20.
Bullish factors for oil prices
The move stems partly from indications that economic growth this year will be stronger than analysts expected.
Related: The Fed rate decision won't surprise markets. What happens next might
Vanguard has just raised its estimate for 2024 U.S. GDP growth to 2% from 0.5%.
Meanwhile, China’s factory output and retail sales exceeded forecasts in January and February. That could boost oil demand in the country, the world's No. 1 oil importer.
Also, drone strokes from Ukraine have knocked out some of Russia’s oil refinery capacity. Ukraine has hit at least nine major refineries this year, erasing an estimated 11% of Russia’s production capacity, according to Bloomberg.
“Russia is a gas station with an army, and we intend on destroying that gas station,” Francisco Serra-Martins, chief executive of drone manufacturer Terminal Autonomy, told the news service. Gasoline, of course, is one of the products made at refineries.
Speaking of gas, the recent surge of oil prices has sent it higher as well. The average national price for regular gas totaled $3.52 per gallon Wednesday, up 7% from a month ago, according to the American Automobile Association. And we’re nearing the peak driving season.
Another bullish factor for oil: Iraq said Monday that it’s cutting oil exports by 130,000 barrels per day in coming months. Iraq produced much more oil in January and February than its OPEC (Organization of Petroleum Exporting Countries) target.
Citigroup’s oil-price forecast
Yet, not everyone is bullish on oil going forward. Citigroup analysts see prices falling through next year, Dow Jones’s Oil Price Information Service (OPIS) reports.
More Economic Analysis:
- Bond markets tell Fed rate story that stocks still ignore
- February inflation surprises with modest uptick, but core pressures ease
- Vanguard unveils bold interest rate forecast ahead of Fed meeting
The analysts note that supply is at risk in Israel, Iran, Iraq, Libya, and Venezuela. But Saudi Arabia, the UAE, Kuwait, and Russia could easily make up any shortfall.
Moreover, output should also rise this year and next in the U.S., Canada, Brazil, and Guyana, the analysts said. Meanwhile, global demand growth will decelerate, amid increased electric vehicle use and economic weakness.
Regarding refineries, the analysts see strong gains in capacity and capacity upgrades this year.
What if Donald Trump is elected president again? That “would likely be bearish for oil and gas," as Trump's policies could boost trade tension, crimping demand, they said.
The analysts made predictions for European oil prices, the world’s benchmark, which sat Wednesday at $86.
They forecast a 9% slide in the second quarter to $78, then a decline to $74 in the third quarter and $70 in the fourth quarter.
Next year should see a descent to $65 in the first quarter, $60 in the second and third, and finally $55 in the fourth, Citi said. That would leave the price 36% below current levels.
U.S. crude prices will trade $4 below European prices from the second quarter this year until the end of 2025, the analysts maintain.
Related: Veteran fund manager picks favorite stocks for 2024
stimulus economic growth pandemic dow jones stocks fed army trump gdp stimulus oil iran brazil canada european russia ukraine chinaGovernment
How The Democrats Plan To Steal The Election
How The Democrats Plan To Steal The Election
Authored by Llewellyn Rockwell via LewRockwell.com,
Biden and Trump have clinched the nominations…
Share this:


Authored by Llewellyn Rockwell via LewRockwell.com,
Biden and Trump have clinched the nominations of their parties for President. Everybody is gearing up for a battle between them for the election in November. It’s obvious that Biden is “cognitively impaired.” In blunter language, “brain-dead”. Partisans of Trump are gearing up for a decisive victory.
But what if this battle is a sham? What if Biden’s elite gang of neo-con controllers won’t let Biden lose?
How can they stop him from losing? Simple. If it looks like he’s losing, the elite forces will create enough fake ballots to ensure victory. Our corrupt courts won’t stop them. They have done this before, and they will do it again, if they have to.
I said the Democrats have done this before.
The great Dr. Ron Paul explains one way they did this in 2020. The elite covered up a scandal that could have wrecked Biden’s chances:
“Move over Watergate. On or around Oct. 17, 2020, then-senior Biden campaign official Antony Blinken called up former acting CIA director Mike Morell to ask a favor: he needed high-ranking former US intelligence community officials to lie to the American people to save Biden’s lagging campaign from a massive brewing scandal.
The problem was that Joe Biden’s son, Hunter, had abandoned his laptop at a repair shop and the explosive contents of the computer were leaking out. The details of the Biden family’s apparent corruption and the debauchery of the former vice-president’s son were being reported by the New York Post, and with the election less than a month away, the Biden campaign needed to kill the story.
So, according to newly-released transcripts of Morell’s testimony before the House judiciary Committee, Blinken “triggered” Morell to put together a letter for some 50 senior intelligence officials to sign – using their high-level government titles – to claim that the laptop story “had all the hallmarks of a Russian disinformation campaign.”
In short, at the Biden campaign’s direction Morell launched a covert operation against the American people to undermine the integrity of the 2020 election. A letter signed by dozens of the highest-ranking former CIA, DIA, and NSA officials would surely carry enough weight to bury the Biden laptop story. It worked. Social media outlets prevented any reporting on the laptop from being posted and the mainstream media could easily ignore the story as it was merely “Russian propaganda.”
Asked recently by Judiciary Committee Chairman Jim Jordan (R-OH) why he agreed to draft the false sign-on letter, Morell testified that he wanted to “help Vice President Biden … because I wanted him to win the election.”
Morell also likely expected to be named by President Biden to head up the CIA when it came time to call in favors.
The Democrats and the mainstream media have relentlessly pushed the lie that the ruckus inside the US Capitol on Jan. 6th 2021 was a move by President Trump to overthrow the election results. Hundreds of “trespassers” were arrested and held in solitary confinement without trial to bolster the false narrative that a conspiracy to steal the election was taking place.
It turns out that there really was a conspiracy to steal the election, but it was opposite of what was reported. Just as the Steele Dossier was a Democratic Party covert action to plant the lie that the Russians were pulling strings for Trump, the “Russian disinformation campaign” letter was a lie to deflect scrutiny of the Biden family’s possible corruption in the final days of the campaign.
Did the Biden campaign’s disinformation campaign help rig the election in his favor? Polls suggest that Biden would not have been elected had the American electorate been informed about what was on Hunter Biden’s laptop. So yes, they cheated in the election.
The Democrats and the mainstream media are still at it, however. Now they are trying to kill the story of how they killed the story of the Biden laptop. This is a scandal that would once upon a time have ended in resignation, impeachment, and/or plenty of jail time. If they successfully bury this story, I hate to say it but there is no more rule of law in what has become the American banana republic.” See here.
But the main way the election can be rigged is by fraudulent “voting.” It’s much easier to do this with digital scanning of votes than with old-fashioned ballot boxes.
Dr. Naomi Wolf explains how electronic voting machines make it easier to steal elections:
“People could steal elections in this ‘analog’ technology of paper and locked ballot boxes, of course, by destroying or hiding votes, or by bribing voters, a la Tammany Hall, or by other forms of wrongdoing, so security and chain of custody, as well as anti-corruption scrutiny, were always needed in guaranteeing accurate election counts. But there was no reason, with analog physical processing of votes, to query the tradition of the secret ballot.
Before the digital scanning of votes, you could not hack a wooden ballot box; and you could not set an algorithm to misread a pile of paper ballots. So, at the end of the day, one way or another, you were counting physical documents.
Those days are gone, obviously, and in many districts there are digital systems reading ballots.” See here.
This isn’t the first time the Left has stolen an election. It happened in the 2020 presidential election too. Ron Unz offers his usual cogent analysis:
“There does seem to be considerable circumstantial evidence of widespread ballot fraud by Democratic Party forces, hardly surprising given the apocalyptic manner in which so many of their leaders had characterized the threat of a Trump reelection. After all, if they sincerely believed that a Trump victory would be catastrophic for America why would they not use every possible means, fair and foul alike, to save our country from that dire fate?
In particular, several of the major swing-states contain large cities—Detroit, Milwaukee, Philadelphia, and Atlanta—that are both totally controlled by the Democratic Party and also notoriously corrupt, and various eye-witnesses have suggested that the huge anti-Trump margins they provided may have been heavily ‘padded’ to ensure the candidate’s defeat.” See here.
In a program aired right after Biden’s pitiful State of the Union speech, the great Tucker Carlson pointed out that Biden’s “Justice” Department has already confessed that it plans to rig the election. It will do this by banning voter ID laws as “racist.” This permits an unlimited number of fake votes:
“If Joe Biden is so good at politics, why is he losing to Donald Trump, who the rest of us were assured was a retarded racist who no normal person would vote for? But now Joe Biden is getting stomped by Donald Trump, but he’s also at the same time good at politics? Right.
Again, they can’t win, but they’re not giving up. So what does that tell you? Well, they’re going to steal the election. We know they’re going to steal the election because they’re now saying so out loud. Here is the Attorney General of the United States, the chief law enforcement officer of this country in Selma, Alabama, just the other day.
[Now Carlson quotes the Attorney General, Merrick Garland:]
“The right to vote is still under attack, and that is why the Justice Department is fighting back. That is why one of the first things I did when I came into office was to double the size of the voting section of the Civil Rights Division. That is why we are challenging efforts by states and jurisdictions to implement discriminatory, burdensome, and unnecessary restrictions on access to the ballot, including those related to mail-in voting, the use of drop boxes and voter ID requirements. That is why we are working to block the adoption of discriminatory redistricting plans that dilute the vote of Black voters and other voters of color.
[Carlson then comments on Garland:]
“Did you catch that? Of course, you’re a racist. That’s always the takeaway. But consider the details of what the Attorney General of the United States just said. Mail-in balloting, drop boxes, voter ID requirements. The chief law enforcement officer of the United States Government is telling you that it’s immoral, in fact racist, in fact illegal to ask people for their IDs when they vote to verify they are who they say they are. What is that? Well, no one ever talks about this, but the justification for it is that somehow people of color, Black people, don’t have state-issued IDs. Somehow they’re living in a country where you can do virtually nothing without proving your identity with a government-issued ID without government-issued IDs. They can’t fly on planes, they can’t have checking accounts, they can’t have any interaction with the government, state, local, or federal. They can’t stay in hotels. They can’t have credit cards. Because someone without a state-issued ID can’t do any of those things.
But what’s so interesting is these same people, very much including the Attorney General and the administration he serves, is working to eliminate cash, to make this a cashless society. Have you been to a stadium event recently? No cash accepted. You have to have a credit card. In order to get a credit card you need a state-issued ID, and somehow that’s not racist. But it is racist to ask people to prove their identity when they choose the next President of the United States. That doesn’t make any sense at all. That’s a lie. It’s an easily provable lie, and anyone telling that lie is advocating for mass voter fraud, which the Attorney General is. There’s no other way to read it. So you should know that. You live in a country where the Attorney General is abetting, in fact calling for voter fraud, and that’s the only chance they have to get their guy re-elected.” See here.
Because of absentee ballots, the voting can be spread out over a long period of time. This makes voting fraud much easier. Mollie Hemingway has done a lot of research on this topic:
“In the 2020 presidential election, for the first time ever, partisan groups were allowed—on a widespread basis—to cross the bright red line separating government officials who administer elections from political operatives who work to win them. It is important to understand how this happened in order to prevent it in the future.
Months after the election, Time magazine published a triumphant story of how the election was won by “a well-funded cabal of powerful people, ranging across industries and ideologies, working together behind the scenes to influence perceptions, change rules and laws, steer media coverage and control the flow of information.” Written by Molly Ball, a journalist with close ties to Democratic leaders, it told a cheerful story of a “conspiracy unfolding behind the scenes,” the “result of an informal alliance between left-wing activists and business titans.”
A major part of this “conspiracy” to “save the 2020 election” was to use COVID as a pretext to maximize absentee and early voting. This effort was enormously successful. Nearly half of voters ended up voting by mail, and another quarter voted early. It was, Ball wrote, “practically a revolution in how people vote.” Another major part was to raise an army of progressive activists to administer the election at the ground level.
Here, one billionaire in particular took a leading role: Facebook founder Mark Zuckerberg.
Zuckerberg’s help to Democrats is well known when it comes to censoring their political opponents in the name of preventing “misinformation.” Less well known is the fact that he directly funded liberal groups running partisan get-out-the-vote operations. In fact, he helped those groups infiltrate election offices in key swing states by doling out large grants to crucial districts.
The Chan Zuckerberg Initiative, an organization led by Zuckerberg’s wife Priscilla, gave more than $400 million to nonprofit groups involved in “securing” the 2020 election. Most of those funds—colloquially called “Zuckerbucks”—were funneled through the Center for Tech and Civic Life (CTCL), a voter outreach organization founded by Tiana Epps-Johnson, Whitney May, and Donny Bridges. All three had previously worked on activism relating to election rules for the New Organizing Institute, once described by The Washington Post as “the Democratic Party’s Hogwarts for digital wizardry.”
Flush with $350 million in Zuckerbucks, the CTCL proceeded to disburse large grants to election officials and local governments across the country. These disbursements were billed publicly as “COVID-19 response grants,” ostensibly to help municipalities acquire protective gear for poll workers or otherwise help protect election officials and volunteers against the virus. In practice, relatively little money was spent for this. Here, as in other cases, COVID simply provided cover.
According to the Foundation for Government Accountability (FGA), Georgia received more than $31 million in Zuckerbucks, one of the highest amounts in the country. The three Georgia counties that received the most money spent only 1.3 percent of it on personal protective equipment. The rest was spent on salaries, laptops, vehicle rentals, attorney fees for public records requests, mail-in balloting, and other measures that allowed elections offices to hire activists to work the election. Not all Georgia counties received CTCL funding. And of those that did, Trump-voting counties received an average of $1.91 per registered voter, compared to $7.13 per registered voter in Biden-voting counties.
The FGA looked at this funding another way, too. Trump won Georgia by more than five points in 2016. He lost it by three-tenths of a point in 2020. On average, as a share of the two-party vote, most counties moved Democratic by less than one percentage point in that time. Counties that didn’t receive Zuckerbucks showed hardly any movement, but counties that did moved an average of 2.3 percentage points Democratic. In counties that did not receive Zuckerbucks, “roughly half saw an increase in Democrat votes that offset the increase in Republican votes, while roughly half saw the opposite trend.” In counties that did receive Zuckerbucks, by contrast, three quarters “saw a significant uptick in Democrat votes that offset any upward change in Republican votes,” including highly populated Fulton, Gwinnett, Cobb, and DeKalb counties.
Of all the 2020 battleground states, it is probably in Wisconsin where the most has been brought to light about how Zuckerbucks worked.
CTCL distributed $6.3 million to the Wisconsin cities of Racine, Green Bay, Madison, Milwaukee, and Kenosha—purportedly to ensure that voting could take place “in accordance with prevailing [anti-COVID] public health requirements.”
Wisconsin law says voting is a right, but that “voting by absentee ballot must be carefully regulated to prevent the potential for fraud or abuse; to prevent overzealous solicitation of absent electors who may prefer not to participate in an election.” Wisconsin law also says that elections are to be run by clerks or other government officials. But the five cities that received Zuckerbucks outsourced much of their election operation to private liberal groups, in one case so extensively that a sidelined government official quit in frustration.
This was by design. Cities that received grants were not allowed to use the money to fund outside help unless CTCL specifically approved their plans in writing. CTCL kept tight control of how money was spent, and it had an abundance of “partners” to help with anything the cities needed.
Some government officials were willing to do whatever CTCL recommended. “As far as I’m concerned I am taking all of my cues from CTCL and work with those you recommend,” Celestine Jeffreys, the chief of staff to Democratic Green Bay Mayor Eric Genrich, wrote in an email. CTCL not only had plenty of recommendations, but made available a “network of current and former election administrators and election experts” to scale up “your vote by mail processes” and “ensure forms, envelopes, and other materials are understood and completed correctly by voters.”
Power the Polls, a liberal group recruiting poll workers, promised to help with ballot curing. The liberal Mikva Challenge worked to recruit high school-age poll workers. And the left-wing Brennan Center offered help with “election integrity,” including “post-election audits” and “cybersecurity.”
The Center for Civic Design, an election administration policy organization that frequently partners with groups such as liberal billionaire Pierre Omidyar’s Democracy Fund, designed absentee ballots and voting instructions, often working directly with an election commission to design envelopes and create advertising and targeting campaigns. The Elections Group, also linked to the Democracy Fund, provided technical assistance in handling drop boxes and conducted voter outreach. The communications director for the Center for Secure and Modern Elections, an organization that advocates sweeping changes to the elections process, ran a conference call to help Green Bay develop Spanish-language radio ads and geofencing to target voters in a predefined area.
Digital Response, a nonprofit launched in 2020, offered to “bring voters an updated elections website,” “run a website health check,” “set up communications channels,” “bring poll worker application and management online,” “track and respond to polling location wait times,” “set up voter support and email response tools,” “bring vote-by-mail applications online,” “process incoming [vote-by-mail] applications,” and help with “ballot curing process tooling and voter notification.”
The National Vote at Home Institute was presented as a “technical assistance partner” that could “support outreach around absentee voting,” provide and oversee voting machines, consult on methods to cure absentee ballots, and even assume the duty of curing ballots.
A few weeks after the five Wisconsin cities received their grants, CTCL emailed Claire Woodall-Vogg, the executive director of the Milwaukee Election Commission, to offer “an experienced elections staffer that could potentially embed with your staff in Milwaukee in a matter of days.” The staffer leading Wisconsin’s portion of the National Vote at Home Institute was an out-of-state Democratic activist named Michael Spitzer-Rubenstein. As soon as he met with Woodall-Vogg, he asked for contacts in other cities and at the Wisconsin Elections Commission.
Spitzer-Rubenstein would eventually take over much of Green Bay’s election planning from the official charged with running the election, Green Bay Clerk Kris Teske. This made Teske so unhappy that she took Family and Medical Leave prior to the election and quit shortly thereafter.
Emails from Spitzer-Rubenstein show the extent to which he was managing the election process. To one government official he wrote, “By Monday, I’ll have our edits on the absentee voting instructions. We’re pushing Quickbase to get their system up and running and I’ll keep you updated. I’ll revise the planning tool to accurately reflect the process. I’ll create a flowchart for the vote-by-mail processing that we will be able to share with both inspectors and also observers.”
Once early voting started, Woodall-Vogg would provide Spitzer-Rubenstein with daily updates on the numbers of absentee ballots returned and still outstanding in each ward—prized information for a political operative.
Amazingly, Spitzer-Rubenstein even asked for direct access to the Milwaukee Election Commission’s voter database:
“Would you or someone else on your team be able to do a screen-share so we can see the process for an export?” he wrote.
“Do you know if WisVote has an [application programming interface] or anything similar so that it can connect with other software apps? That would be the holy grail.”
Even for Woodall-Vogg, that was too much.
“While I completely understand and appreciate the assistance that is trying to be provided,” she replied, “I am definitely not comfortable having a non-staff member involved in the function of our voter database, much less recording it.”
When these emails were released in 2021, they stunned Wisconsin observers. “What exactly was the National Vote at Home Institute doing with its daily reports? Was it making sure that people were actually voting from home by going door-to-door to collect ballots from voters who had not yet turned theirs in? Was this data sharing a condition of the CTCL grant? And who was really running Milwaukee’s election?” asked Dan O’Donnell, whose election analysis appeared at Wisconsin’s conservative MacIver Institute.
Kris Teske, the sidelined Green Bay city clerk—in whose office Wisconsin law actually places the responsibility to conduct elections—had of course seen what was happening early on. “I just don’t know where the Clerk’s Office fits in anymore,” she wrote in early July. By August, she was worried about legal exposure: “I don’t understand how people who don’t have the knowledge of the process can tell us how to manage the election,” she wrote on August 28.
Green Bay Mayor Eric Genrich simply handed over Teske’s authority to agents from outside groups and gave them leadership roles in collecting absentee ballots, fixing ballots that would otherwise be voided for failure to follow the law, and even supervising the counting of ballots. “The grant mentors would like to meet with you to discuss, further, the ballot curing process. Please let them know when you’re available,” Genrich’s chief of staff told Teske.
Spitzer-Rubenstein explained that the National Vote at Home Institute had done the same for other cities in Wisconsin. “We have a process map that we’ve worked out with Milwaukee for their process. We can also adapt the letter we’re sending out with rejected absentee ballots along with a call script alerting voters. (We can also get people to make the calls, too, so you don’t need to worry about it.)”
Other emails show that Spitzer-Rubenstein had keys to the central counting facility and access to all the machines before election night. His name was on contracts with the hotel hosting the ballot counting.
Sandy Juno, who was clerk of Brown County, where Green Bay is located, later testified about the problems in a legislative hearing. “He was advising them on things. He was touching the ballots. He had access to see how the votes were counted,” Juno said of Spitzer-Rubenstein. Others testified that he was giving orders to poll workers and seemed to be the person running the election night count operation.
“I would really like to think that when we talk about security of elections, we’re talking about more than just the security of the internet,” Juno said. “You know, it has to be security of the physical location, where you’re not giving a third party keys to where you have your election equipment.”
Juno noted that there were irregularities in the counting, too, with no consistency between the various tables. Some had absentee ballots face-up, so anyone could see how they were marked. Poll workers were seen reviewing ballots not just to see that they’d been appropriately checked by the clerk, but “reviewing how they were marked.” And poll workers fixing ballots used the same color pens as the ones ballots had been filled out in, contrary to established procedures designed to make sure observers could differentiate between voters’ marks and poll workers’ marks.
The plan by Democratic strategists to bring activist groups into election offices worked in part because no legislature had ever imagined that a nonprofit could take over so many election offices so easily.
“If it can happen to Green Bay, Wisconsin, sweet little old Green Bay, Wisconsin, these people can coordinate any place,” said Janel Brandtjen, a state representative in Wisconsin.
She was right. What happened in Green Bay happened in Democrat-run cities and counties across the country. Four hundred million Zuckerbucks were distributed with strings attached. Officials were required to work with “partner organizations” to massively expand mail-in voting and staff their election operations with partisan activists. The plan was genius. And because no one ever imagined that the election system could be privatized in this way, there were no laws to prevent it.
"Such laws should now be a priority.” See here.
Let’s do everything we can to publicize the steal. That way, we have a chance to prevent it.


Analysts issue unexpected crude oil price forecast after surge


Young People Aren’t Nearly Angry Enough About Government Debt


Apartment permits are back to recession lows. Will mortgage rates follow?


There Goes The Fed’s Inflation Target: Goldman Sees Terminal Rate 100bps Higher At 3.5%


Student loan borrowers may finally get answers to loan forgiveness issues


Study: Life’s building blocks are surprisingly stable in Venus-like conditions


Bolsonaro Indicted By Brazilian Police For Falsifying Covid-19 Vaccine Records


ARPA-H appoints Etta Pisano to lead its Advancing Clinical Trials Readiness Initiative


COVID-19 Infection Increases Risk Of Autoimmune Diseases By Up To 30 Percent: Study


“Are you better off than you were four years ago?”
-

 Spread & Containment1 week ago
IFM’s Hat Trick and Reflections On Option-To-Buy M&A
-

 Uncategorized4 weeks ago
All Of The Elements Are In Place For An Economic Crisis Of Staggering Proportions
-

 International2 weeks ago
EyePoint poaches medical chief from Apellis; Sandoz CFO, longtime BioNTech exec to retire
-

 Uncategorized1 month ago
California Counties Could Be Forced To Pay $300 Million To Cover COVID-Era Program
-

 Uncategorized4 weeks ago
Apparel Retailer Express Moving Toward Bankruptcy
-

 Uncategorized1 month ago
Industrial Production Decreased 0.1% in January
-

 International2 weeks ago
Walmart launches clever answer to Target’s new membership program
-

 Uncategorized1 month ago
RFK Jr: The Wuhan Cover-Up & The Rise Of The Biowarfare-Industrial Complex